VOTING POWER100.00%
DOWNVOTE POWER100.00%
RESOURCE CREDITS100.00%
REPUTATION PROGRESS86.91%
Net Worth
0.894USD
STEEM
5.656STEEM
SBD
0.071SBD
Own SP
10.300SP
Detailed Balance
| STEEM | ||
| balance | 5.059STEEM | STEEM |
| market_balance | 0.000STEEM | STEEM |
| savings_balance | 0.000STEEM | STEEM |
| reward_steem_balance | 0.597STEEM | STEEM |
| STEEM POWER | ||
| Own SP | 10.300SP | SP |
| Delegated Out | 0.000SP | SP |
| Delegation In | 0.000SP | SP |
| Effective Power | 10.300SP | SP |
| Reward SP (pending) | 0.681SP | SP |
| SBD | ||
| sbd_balance | 0.001SBD | SBD |
| sbd_conversions | 0.000SBD | SBD |
| sbd_market_balance | 0.000SBD | SBD |
| savings_sbd_balance | 0.000SBD | SBD |
| reward_sbd_balance | 0.070SBD | SBD |
{
  "balance": "5.059 STEEM",
  "savings_balance": "0.000 STEEM",
  "reward_steem_balance": "0.597 STEEM",
  "vesting_shares": "16772.665322 VESTS",
  "delegated_vesting_shares": "0.000000 VESTS",
  "received_vesting_shares": "0.000000 VESTS",
  "sbd_balance": "0.001 SBD",
  "savings_sbd_balance": "0.000 SBD",
  "reward_sbd_balance": "0.070 SBD",
  "conversions": []
}
Account Info
| name | proofofresearch |
| id | 1093835 |
| rank | 127,216 |
| reputation | 161315752180 |
| created | 2018-07-28T23:26:54 |
| recovery_account | anonsteem |
| proxy | None |
| post_count | 74 |
| comment_count | 0 |
| lifetime_vote_count | 0 |
| witnesses_voted_for | 0 |
| last_post | 2018-10-13T08:05:24 |
| last_root_post | 2018-10-13T08:05:24 |
| last_vote_time | 2018-10-13T04:46:54 |
| proxied_vsf_votes | 0, 0, 0, 0 |
| can_vote | 1 |
| voting_power | 9,799 |
| delayed_votes | 0 |
| balance | 5.059 STEEM |
| savings_balance | 0.000 STEEM |
| sbd_balance | 0.001 SBD |
| savings_sbd_balance | 0.000 SBD |
| vesting_shares | 16772.665322 VESTS |
| delegated_vesting_shares | 0.000000 VESTS |
| received_vesting_shares | 0.000000 VESTS |
| reward_vesting_balance | 1377.342666 VESTS |
| vesting_balance | 0.000 STEEM |
| vesting_withdraw_rate | 0.000000 VESTS |
| next_vesting_withdrawal | 1969-12-31T23:59:59 |
| withdrawn | 0 |
| to_withdraw | 0 |
| withdraw_routes | 0 |
| savings_withdraw_requests | 0 |
| last_account_recovery | 1970-01-01T00:00:00 |
| reset_account | null |
| last_owner_update | 1970-01-01T00:00:00 |
| last_account_update | 2018-07-28T23:53:15 |
| mined | No |
| sbd_seconds | 0 |
| sbd_last_interest_payment | 1970-01-01T00:00:00 |
| savings_sbd_last_interest_payment | 1970-01-01T00:00:00 |
{
  "id": 1093835,
  "name": "proofofresearch",
  "owner": {
    "weight_threshold": 1,
    "account_auths": [],
    "key_auths": [
      [
        "STM6UHRSsR2p6iQcRJJYioikQCThcvDatDwGHZy9gwkyoy65M1pPH",
        1
      ]
    ]
  },
  "active": {
    "weight_threshold": 1,
    "account_auths": [],
    "key_auths": [
      [
        "STM6KyYr1JLnCE2CainvgWyKWCeKwKs5BXvDAGwnbJB1QzNxWzRXa",
        1
      ]
    ]
  },
  "posting": {
    "weight_threshold": 1,
    "account_auths": [],
    "key_auths": [
      [
        "STM5pcS8NVoo7TCn4KRkavn2kVS4onNtUd1egNDuRLfC8goHXg5E6",
        1
      ]
    ]
  },
  "memo_key": "STM7juYLhpRsZRGxSfGeamVMky42f74nCjoqseUgv3ekmVv82FcLh",
  "json_metadata": "{\"profile\":{\"name\":\"ProofofResearch\",\"profile_image\":\"https://cdn.steemitimages.com/DQmXWtFsFR64AC23HwGw1vAogsiKre8wm2v4c8yhndi8viT/Proof%20of%20Research%20Brain%20LARGE%20FULL%20w%20phrase.png\",\"cover_image\":\"https://cdn.steemitimages.com/DQmWTC4cTfvzBmpgExMyhjmZtLcEdGDKVgaMb9t8EbRSABx/Wow%20this%20is%20awesome.png\",\"website\":\"https://t.me/MerkleTrader\"}}",
  "posting_json_metadata": "{\"profile\":{\"name\":\"ProofofResearch\",\"profile_image\":\"https://cdn.steemitimages.com/DQmXWtFsFR64AC23HwGw1vAogsiKre8wm2v4c8yhndi8viT/Proof%20of%20Research%20Brain%20LARGE%20FULL%20w%20phrase.png\",\"cover_image\":\"https://cdn.steemitimages.com/DQmWTC4cTfvzBmpgExMyhjmZtLcEdGDKVgaMb9t8EbRSABx/Wow%20this%20is%20awesome.png\",\"website\":\"https://t.me/MerkleTrader\"}}",
  "proxy": "",
  "last_owner_update": "1970-01-01T00:00:00",
  "last_account_update": "2018-07-28T23:53:15",
  "created": "2018-07-28T23:26:54",
  "mined": false,
  "recovery_account": "anonsteem",
  "last_account_recovery": "1970-01-01T00:00:00",
  "reset_account": "null",
  "comment_count": 0,
  "lifetime_vote_count": 0,
  "post_count": 74,
  "can_vote": true,
  "voting_manabar": {
    "current_mana": "16437212015",
    "last_update_time": 1539406014
  },
  "downvote_manabar": {
    "current_mana": 0,
    "last_update_time": 1532820414
  },
  "voting_power": 9799,
  "balance": "5.059 STEEM",
  "savings_balance": "0.000 STEEM",
  "sbd_balance": "0.001 SBD",
  "sbd_seconds": "0",
  "sbd_seconds_last_update": "2018-09-25T07:04:45",
  "sbd_last_interest_payment": "1970-01-01T00:00:00",
  "savings_sbd_balance": "0.000 SBD",
  "savings_sbd_seconds": "0",
  "savings_sbd_seconds_last_update": "1970-01-01T00:00:00",
  "savings_sbd_last_interest_payment": "1970-01-01T00:00:00",
  "savings_withdraw_requests": 0,
  "reward_sbd_balance": "0.070 SBD",
  "reward_steem_balance": "0.597 STEEM",
  "reward_vesting_balance": "1377.342666 VESTS",
  "reward_vesting_steem": "0.681 STEEM",
  "vesting_shares": "16772.665322 VESTS",
  "delegated_vesting_shares": "0.000000 VESTS",
  "received_vesting_shares": "0.000000 VESTS",
  "vesting_withdraw_rate": "0.000000 VESTS",
  "next_vesting_withdrawal": "1969-12-31T23:59:59",
  "withdrawn": 0,
  "to_withdraw": 0,
  "withdraw_routes": 0,
  "curation_rewards": 0,
  "posting_rewards": 11698,
  "proxied_vsf_votes": [
    0,
    0,
    0,
    0
  ],
  "witnesses_voted_for": 0,
  "last_post": "2018-10-13T08:05:24",
  "last_root_post": "2018-10-13T08:05:24",
  "last_vote_time": "2018-10-13T04:46:54",
  "post_bandwidth": 0,
  "pending_claimed_accounts": 0,
  "vesting_balance": "0.000 STEEM",
  "reputation": "161315752180",
  "transfer_history": [],
  "market_history": [],
  "post_history": [],
  "vote_history": [],
  "other_history": [],
  "witness_votes": [],
  "tags_usage": [],
  "guest_bloggers": [],
  "rank": 127216
}
Withdraw Routes
| Incoming | Outgoing |
|---|---|
Empty | Empty |
{
  "incoming": [],
  "outgoing": []
}From Date
To Date
frenglinreplied to @proofofresearch / rspdz02023/04/06 04:03:39
frenglinreplied to @proofofresearch / rspdz0
2023/04/06 04:03:39
| parent author | proofofresearch |
| parent permlink | some-tips-to-identify-pump-and-dumps-early-and-utilize-this-information-to-your-advantage |
| author | frenglin |
| permlink | rspdz0 |
| title | |
| body | If you’re looking for a tablet for entertainment, then you’ll want to look for one with a large screen and great sound quality. The Apple iPad Pro 12.9" is the perfect device for this purpose. https://workusingtablets.com/best-tablet-for-trading-stocks/ |
| json metadata | {"links":["https://workusingtablets.com/best-tablet-for-trading-stocks/"],"app":"steemit/0.2"} |
| Transaction Info | Block #73515440/Trx 381c258bd85588eb6c6b279b6b55317a53f549ce |
View Raw JSON Data
{
  "trx_id": "381c258bd85588eb6c6b279b6b55317a53f549ce",
  "block": 73515440,
  "trx_in_block": 2,
  "op_in_trx": 0,
  "virtual_op": 0,
  "timestamp": "2023-04-06T04:03:39",
  "op": [
    "comment",
    {
      "parent_author": "proofofresearch",
      "parent_permlink": "some-tips-to-identify-pump-and-dumps-early-and-utilize-this-information-to-your-advantage",
      "author": "frenglin",
      "permlink": "rspdz0",
      "title": "",
      "body": "If you’re looking for a tablet for entertainment, then you’ll want to look for one with a large screen and great sound quality. The Apple iPad Pro 12.9\" is the perfect device for this purpose.  https://workusingtablets.com/best-tablet-for-trading-stocks/",
      "json_metadata": "{\"links\":[\"https://workusingtablets.com/best-tablet-for-trading-stocks/\"],\"app\":\"steemit/0.2\"}"
    }
  ]
}2019/07/29 00:24:15
2019/07/29 00:24:15
| parent author | proofofresearch |
| parent permlink | ripple-looks-ripe-for-a-reload-of-the-shorts |
| author | steemitboard |
| permlink | steemitboard-notify-proofofresearch-20190729t002415000z |
| title | |
| body | Congratulations @proofofresearch! You received a personal award! <table><tr><td>https://steemitimages.com/70x70/http://steemitboard.com/@proofofresearch/birthday1.png</td><td>Happy Birthday! - You are on the Steem blockchain for 1 year!</td></tr></table> <sub>_You can view [your badges on your Steem Board](https://steemitboard.com/@proofofresearch) and compare to others on the [Steem Ranking](https://steemitboard.com/ranking/index.php?name=proofofresearch)_</sub> ###### [Vote for @Steemitboard as a witness](https://v2.steemconnect.com/sign/account-witness-vote?witness=steemitboard&approve=1) to get one more award and increased upvotes! |
| json metadata | {"image":["https://steemitboard.com/img/notify.png"]} |
| Transaction Info | Block #35071450/Trx ac84dfc6ba5e6e8c3a3c0ae082dbef06fb4b3691 |
View Raw JSON Data
{
  "trx_id": "ac84dfc6ba5e6e8c3a3c0ae082dbef06fb4b3691",
  "block": 35071450,
  "trx_in_block": 8,
  "op_in_trx": 0,
  "virtual_op": 0,
  "timestamp": "2019-07-29T00:24:15",
  "op": [
    "comment",
    {
      "parent_author": "proofofresearch",
      "parent_permlink": "ripple-looks-ripe-for-a-reload-of-the-shorts",
      "author": "steemitboard",
      "permlink": "steemitboard-notify-proofofresearch-20190729t002415000z",
      "title": "",
      "body": "Congratulations @proofofresearch! You received a personal award!\n\n<table><tr><td>https://steemitimages.com/70x70/http://steemitboard.com/@proofofresearch/birthday1.png</td><td>Happy Birthday! - You are on the Steem blockchain for 1 year!</td></tr></table>\n\n<sub>_You can view [your badges on your Steem Board](https://steemitboard.com/@proofofresearch) and compare to others on the [Steem Ranking](https://steemitboard.com/ranking/index.php?name=proofofresearch)_</sub>\n\n\n###### [Vote for @Steemitboard as a witness](https://v2.steemconnect.com/sign/account-witness-vote?witness=steemitboard&approve=1) to get one more award and increased upvotes!",
      "json_metadata": "{\"image\":[\"https://steemitboard.com/img/notify.png\"]}"
    }
  ]
}2019/02/12 23:35:18
2019/02/12 23:35:18
| voter | holosplay |
| author | proofofresearch |
| permlink | usdzcash-is-nothing-more-than-a-pump-and-dump-get-rich-quick-scheme |
| weight | 10000 (100.00%) |
| Transaction Info | Block #30295917/Trx 350885a26793074b1adb804812591c6f19d47aea |
View Raw JSON Data
{
  "trx_id": "350885a26793074b1adb804812591c6f19d47aea",
  "block": 30295917,
  "trx_in_block": 35,
  "op_in_trx": 0,
  "virtual_op": 0,
  "timestamp": "2019-02-12T23:35:18",
  "op": [
    "vote",
    {
      "voter": "holosplay",
      "author": "proofofresearch",
      "permlink": "usdzcash-is-nothing-more-than-a-pump-and-dump-get-rich-quick-scheme",
      "weight": 10000
    }
  ]
}getsome3000upvoted (100.00%) @proofofresearch / serious-issues-with-usdneo-it-does-not-work2018/12/11 13:07:48
getsome3000upvoted (100.00%) @proofofresearch / serious-issues-with-usdneo-it-does-not-work
2018/12/11 13:07:48
| voter | getsome3000 |
| author | proofofresearch |
| permlink | serious-issues-with-usdneo-it-does-not-work |
| weight | 10000 (100.00%) |
| Transaction Info | Block #28470496/Trx 7a3d572e79232b33a1e10a23bb0ed33e9a4294c1 |
View Raw JSON Data
{
  "trx_id": "7a3d572e79232b33a1e10a23bb0ed33e9a4294c1",
  "block": 28470496,
  "trx_in_block": 30,
  "op_in_trx": 0,
  "virtual_op": 0,
  "timestamp": "2018-12-11T13:07:48",
  "op": [
    "vote",
    {
      "voter": "getsome3000",
      "author": "proofofresearch",
      "permlink": "serious-issues-with-usdneo-it-does-not-work",
      "weight": 10000
    }
  ]
}nckoubaupvoted (100.00%) @proofofresearch / serious-issues-with-usdneo-it-does-not-work2018/11/29 17:21:36
nckoubaupvoted (100.00%) @proofofresearch / serious-issues-with-usdneo-it-does-not-work
2018/11/29 17:21:36
| voter | nckouba |
| author | proofofresearch |
| permlink | serious-issues-with-usdneo-it-does-not-work |
| weight | 10000 (100.00%) |
| Transaction Info | Block #28130142/Trx c769643bb1f7089d2ed06e8d32427f702e285f0f |
View Raw JSON Data
{
  "trx_id": "c769643bb1f7089d2ed06e8d32427f702e285f0f",
  "block": 28130142,
  "trx_in_block": 1,
  "op_in_trx": 0,
  "virtual_op": 0,
  "timestamp": "2018-11-29T17:21:36",
  "op": [
    "vote",
    {
      "voter": "nckouba",
      "author": "proofofresearch",
      "permlink": "serious-issues-with-usdneo-it-does-not-work",
      "weight": 10000
    }
  ]
}magnet4rupvoted (100.00%) @proofofresearch / ichimoku-cloud-explained-thoroughly-debunking-ichimoku-myths2018/11/15 12:01:27
magnet4rupvoted (100.00%) @proofofresearch / ichimoku-cloud-explained-thoroughly-debunking-ichimoku-myths
2018/11/15 12:01:27
| voter | magnet4r |
| author | proofofresearch |
| permlink | ichimoku-cloud-explained-thoroughly-debunking-ichimoku-myths |
| weight | 10000 (100.00%) |
| Transaction Info | Block #27720742/Trx e28d20264a19c05a2540350e6e59533cbe2e638b |
View Raw JSON Data
{
  "trx_id": "e28d20264a19c05a2540350e6e59533cbe2e638b",
  "block": 27720742,
  "trx_in_block": 24,
  "op_in_trx": 0,
  "virtual_op": 0,
  "timestamp": "2018-11-15T12:01:27",
  "op": [
    "vote",
    {
      "voter": "magnet4r",
      "author": "proofofresearch",
      "permlink": "ichimoku-cloud-explained-thoroughly-debunking-ichimoku-myths",
      "weight": 10000
    }
  ]
}proofofresearchpublished a new post: ripple-looks-ripe-for-a-reload-of-the-shorts2018/10/13 08:39:54
proofofresearchpublished a new post: ripple-looks-ripe-for-a-reload-of-the-shorts
2018/10/13 08:39:54
| parent author | |
| parent permlink | bitcoin |
| author | proofofresearch |
| permlink | ripple-looks-ripe-for-a-reload-of-the-shorts |
| title | Ripple Looks Ripe for a Reload of the Shorts |
| body | @@ -6886,18 +6886,18 @@ Aggressi -ng +ve Moving |
| json metadata | {"tags":["bitcoin","crypto","cryptocurrency","priceanalysis","technicalanalysis"],"image":["https://cdn-images-1.medium.com/max/1100/1*vERKeNo7IP-PTL8AVEP45g.png","https://cdn-images-1.medium.com/max/2000/1*hilgeYTFWhG4hVPTFuDf-Q.png","https://cdn-images-1.medium.com/max/2000/1*glCDIAdQ9b_EaCC7bYhtwA.png","https://cdn-images-1.medium.com/max/2000/1*F36qFLkskqgwLf0dkGOcbg.png","https://cdn-images-1.medium.com/max/2000/1*rjYK_nWzAsC6CglOWYmiRQ.png","https://cdn-images-1.medium.com/max/2000/1*QKXY78h0aewwieWiJA7pzQ.png","https://cdn-images-1.medium.com/max/2000/1*SCzh5ggwy2VHkUoJXq5KpA.png","https://cdn-images-1.medium.com/max/2000/1*m188eDFSGMTMek8qNrryCA.png","https://cdn-images-1.medium.com/max/2000/1*1Pat6cZhhSNhySfHPyM4Ow.png","https://cdn-images-1.medium.com/max/2000/1*uIcMmbW5gJq0UOqdwpzVnQ.png","https://cdn-images-1.medium.com/max/2000/1*m-PM3G9RqlIpZ_GHnuPbKg.png","https://cdn-images-1.medium.com/max/2000/1*xlABVsjQbepVAnnQQcgAsQ.png","https://cdn-images-1.medium.com/max/2000/1*RTX3Xf42CR6sx1F0cb_ftw.png","https://cdn-images-1.medium.com/max/2000/1*6_gbya2W9XndO0pUxP45NQ.png","https://cdn-images-1.medium.com/max/2000/1*gbMutJ9_ceC8leGoefYO6g.png","https://cdn-images-1.medium.com/max/1100/0*YoAOMuewT_Qyhd2g.png","https://cdn-images-1.medium.com/max/1100/0*Y4FVy4e7Cm1upt5t.png","https://cdn-images-1.medium.com/max/2000/1*ZPF_St8LUS8xcGkO5gb88g.png"],"links":["https://www.tradingview.com/chart/XRPUSD/6IztJNTJ-Ripple-Looks-Primed-For-a-20-Decline/","https://www.tradingview.com/x/vUzhSbxW/","https://www.tradingview.com/x/PDD8rY5Z/","https://www.tradingview.com/x/SmXswU5s/","https://www.tradingview.com/x/fCczaAiu/","https://www.tradingview.com/x/skBsqacw/","https://www.tradingview.com/x/DRrUbnia/","https://www.tradingview.com/x/GK4CdLVa/","https://www.tradingview.com/x/N3WGoCyz/","https://www.tradingview.com/x/AaNUM9co/","https://www.tradingview.com/x/xzNTaYes/","https://www.tradingview.com/x/KtgYCBKp/","https://www.tradingview.com/x/9Tqo9NHY/","https://www.tradingview.com/x/t2YhgV3M/","https://www.tradingview.com/x/ZAkazICA/","https://dailypriceaction.com/friday-qna/should-you-wait-for-a-retest-following-a-forex-breakout","https://www.tradingview.com/x/xesdcuo7/"],"app":"steemit/0.1","format":"markdown"} |
| Transaction Info | Block #26767021/Trx 4938b3479dbdba3eba9c6d9ee32fa36d691e61fa |
View Raw JSON Data
{
  "trx_id": "4938b3479dbdba3eba9c6d9ee32fa36d691e61fa",
  "block": 26767021,
  "trx_in_block": 11,
  "op_in_trx": 0,
  "virtual_op": 0,
  "timestamp": "2018-10-13T08:39:54",
  "op": [
    "comment",
    {
      "parent_author": "",
      "parent_permlink": "bitcoin",
      "author": "proofofresearch",
      "permlink": "ripple-looks-ripe-for-a-reload-of-the-shorts",
      "title": "Ripple Looks Ripe for a Reload of the Shorts",
      "body": "@@ -6886,18 +6886,18 @@\n Aggressi\n-ng\n+ve\n  Moving \n",
      "json_metadata": "{\"tags\":[\"bitcoin\",\"crypto\",\"cryptocurrency\",\"priceanalysis\",\"technicalanalysis\"],\"image\":[\"https://cdn-images-1.medium.com/max/1100/1*vERKeNo7IP-PTL8AVEP45g.png\",\"https://cdn-images-1.medium.com/max/2000/1*hilgeYTFWhG4hVPTFuDf-Q.png\",\"https://cdn-images-1.medium.com/max/2000/1*glCDIAdQ9b_EaCC7bYhtwA.png\",\"https://cdn-images-1.medium.com/max/2000/1*F36qFLkskqgwLf0dkGOcbg.png\",\"https://cdn-images-1.medium.com/max/2000/1*rjYK_nWzAsC6CglOWYmiRQ.png\",\"https://cdn-images-1.medium.com/max/2000/1*QKXY78h0aewwieWiJA7pzQ.png\",\"https://cdn-images-1.medium.com/max/2000/1*SCzh5ggwy2VHkUoJXq5KpA.png\",\"https://cdn-images-1.medium.com/max/2000/1*m188eDFSGMTMek8qNrryCA.png\",\"https://cdn-images-1.medium.com/max/2000/1*1Pat6cZhhSNhySfHPyM4Ow.png\",\"https://cdn-images-1.medium.com/max/2000/1*uIcMmbW5gJq0UOqdwpzVnQ.png\",\"https://cdn-images-1.medium.com/max/2000/1*m-PM3G9RqlIpZ_GHnuPbKg.png\",\"https://cdn-images-1.medium.com/max/2000/1*xlABVsjQbepVAnnQQcgAsQ.png\",\"https://cdn-images-1.medium.com/max/2000/1*RTX3Xf42CR6sx1F0cb_ftw.png\",\"https://cdn-images-1.medium.com/max/2000/1*6_gbya2W9XndO0pUxP45NQ.png\",\"https://cdn-images-1.medium.com/max/2000/1*gbMutJ9_ceC8leGoefYO6g.png\",\"https://cdn-images-1.medium.com/max/1100/0*YoAOMuewT_Qyhd2g.png\",\"https://cdn-images-1.medium.com/max/1100/0*Y4FVy4e7Cm1upt5t.png\",\"https://cdn-images-1.medium.com/max/2000/1*ZPF_St8LUS8xcGkO5gb88g.png\"],\"links\":[\"https://www.tradingview.com/chart/XRPUSD/6IztJNTJ-Ripple-Looks-Primed-For-a-20-Decline/\",\"https://www.tradingview.com/x/vUzhSbxW/\",\"https://www.tradingview.com/x/PDD8rY5Z/\",\"https://www.tradingview.com/x/SmXswU5s/\",\"https://www.tradingview.com/x/fCczaAiu/\",\"https://www.tradingview.com/x/skBsqacw/\",\"https://www.tradingview.com/x/DRrUbnia/\",\"https://www.tradingview.com/x/GK4CdLVa/\",\"https://www.tradingview.com/x/N3WGoCyz/\",\"https://www.tradingview.com/x/AaNUM9co/\",\"https://www.tradingview.com/x/xzNTaYes/\",\"https://www.tradingview.com/x/KtgYCBKp/\",\"https://www.tradingview.com/x/9Tqo9NHY/\",\"https://www.tradingview.com/x/t2YhgV3M/\",\"https://www.tradingview.com/x/ZAkazICA/\",\"https://dailypriceaction.com/friday-qna/should-you-wait-for-a-retest-following-a-forex-breakout\",\"https://www.tradingview.com/x/xesdcuo7/\"],\"app\":\"steemit/0.1\",\"format\":\"markdown\"}"
    }
  ]
}steeming-hotupvoted (0.75%) @proofofresearch / ripple-looks-ripe-for-a-reload-of-the-shorts2018/10/13 08:10:57
steeming-hotupvoted (0.75%) @proofofresearch / ripple-looks-ripe-for-a-reload-of-the-shorts
2018/10/13 08:10:57
| voter | steeming-hot |
| author | proofofresearch |
| permlink | ripple-looks-ripe-for-a-reload-of-the-shorts |
| weight | 75 (0.75%) |
| Transaction Info | Block #26766442/Trx e444caadce59fb732582669a09ef13501edb7641 |
View Raw JSON Data
{
  "trx_id": "e444caadce59fb732582669a09ef13501edb7641",
  "block": 26766442,
  "trx_in_block": 16,
  "op_in_trx": 0,
  "virtual_op": 0,
  "timestamp": "2018-10-13T08:10:57",
  "op": [
    "vote",
    {
      "voter": "steeming-hot",
      "author": "proofofresearch",
      "permlink": "ripple-looks-ripe-for-a-reload-of-the-shorts",
      "weight": 75
    }
  ]
}proofofresearchpublished a new post: ripple-looks-ripe-for-a-reload-of-the-shorts2018/10/13 08:05:48
proofofresearchpublished a new post: ripple-looks-ripe-for-a-reload-of-the-shorts
2018/10/13 08:05:48
| parent author | |
| parent permlink | bitcoin |
| author | proofofresearch |
| permlink | ripple-looks-ripe-for-a-reload-of-the-shorts |
| title | Ripple Looks Ripe for a Reload of the Shorts |
| body | @@ -373,522 +373,95 @@ e:%0A%0A -%5B**%22Ripple Looks Primed For a 20%25 Decline! %22 by trader CryptoMedication - published October 06, 2018** %0A_For those that have been following the price articles that have been put out in recent times, the recent downturn in%E2%80%A6_www.tradingview.com%5D(https://www.tradingview.com/chart/XRPUSD/6IztJNTJ-Ripple-Looks-Primed-For-a-20-Decline/ %22https://www.tradingview.com/chart/XRPUSD/6IztJNTJ-Ripple-Looks-Primed-For-a-20-Decline/%22)%5B%5D(https://www.tradingview.com/chart/XRPUSD/6IztJNTJ-Ripple-Looks-Primed-For-a-20-Decline/) +https://www.tradingview.com/chart/XRPUSD/6IztJNTJ-Ripple-Looks-Primed-For-a-20-Decline/ %0A%0ATh |
| json metadata | {"tags":["bitcoin","crypto","cryptocurrency","priceanalysis","technicalanalysis"],"image":["https://cdn-images-1.medium.com/max/1100/1*vERKeNo7IP-PTL8AVEP45g.png","https://cdn-images-1.medium.com/max/2000/1*hilgeYTFWhG4hVPTFuDf-Q.png","https://cdn-images-1.medium.com/max/2000/1*glCDIAdQ9b_EaCC7bYhtwA.png","https://cdn-images-1.medium.com/max/2000/1*F36qFLkskqgwLf0dkGOcbg.png","https://cdn-images-1.medium.com/max/2000/1*rjYK_nWzAsC6CglOWYmiRQ.png","https://cdn-images-1.medium.com/max/2000/1*QKXY78h0aewwieWiJA7pzQ.png","https://cdn-images-1.medium.com/max/2000/1*SCzh5ggwy2VHkUoJXq5KpA.png","https://cdn-images-1.medium.com/max/2000/1*m188eDFSGMTMek8qNrryCA.png","https://cdn-images-1.medium.com/max/2000/1*1Pat6cZhhSNhySfHPyM4Ow.png","https://cdn-images-1.medium.com/max/2000/1*uIcMmbW5gJq0UOqdwpzVnQ.png","https://cdn-images-1.medium.com/max/2000/1*m-PM3G9RqlIpZ_GHnuPbKg.png","https://cdn-images-1.medium.com/max/2000/1*xlABVsjQbepVAnnQQcgAsQ.png","https://cdn-images-1.medium.com/max/2000/1*RTX3Xf42CR6sx1F0cb_ftw.png","https://cdn-images-1.medium.com/max/2000/1*6_gbya2W9XndO0pUxP45NQ.png","https://cdn-images-1.medium.com/max/2000/1*gbMutJ9_ceC8leGoefYO6g.png","https://cdn-images-1.medium.com/max/1100/0*YoAOMuewT_Qyhd2g.png","https://cdn-images-1.medium.com/max/1100/0*Y4FVy4e7Cm1upt5t.png","https://cdn-images-1.medium.com/max/2000/1*ZPF_St8LUS8xcGkO5gb88g.png"],"links":["https://www.tradingview.com/chart/XRPUSD/6IztJNTJ-Ripple-Looks-Primed-For-a-20-Decline/","https://www.tradingview.com/x/vUzhSbxW/","https://www.tradingview.com/x/PDD8rY5Z/","https://www.tradingview.com/x/SmXswU5s/","https://www.tradingview.com/x/fCczaAiu/","https://www.tradingview.com/x/skBsqacw/","https://www.tradingview.com/x/DRrUbnia/","https://www.tradingview.com/x/GK4CdLVa/","https://www.tradingview.com/x/N3WGoCyz/","https://www.tradingview.com/x/AaNUM9co/","https://www.tradingview.com/x/xzNTaYes/","https://www.tradingview.com/x/KtgYCBKp/","https://www.tradingview.com/x/9Tqo9NHY/","https://www.tradingview.com/x/t2YhgV3M/","https://www.tradingview.com/x/ZAkazICA/","https://dailypriceaction.com/friday-qna/should-you-wait-for-a-retest-following-a-forex-breakout","https://www.tradingview.com/x/xesdcuo7/"],"app":"steemit/0.1","format":"markdown"} |
| Transaction Info | Block #26766339/Trx 334c8c20276c4912b84b99bd0db235574796fffb |
View Raw JSON Data
{
  "trx_id": "334c8c20276c4912b84b99bd0db235574796fffb",
  "block": 26766339,
  "trx_in_block": 12,
  "op_in_trx": 0,
  "virtual_op": 0,
  "timestamp": "2018-10-13T08:05:48",
  "op": [
    "comment",
    {
      "parent_author": "",
      "parent_permlink": "bitcoin",
      "author": "proofofresearch",
      "permlink": "ripple-looks-ripe-for-a-reload-of-the-shorts",
      "title": "Ripple Looks Ripe for a Reload of the Shorts",
      "body": "@@ -373,522 +373,95 @@\n e:%0A%0A\n-%5B**%22Ripple Looks Primed For a 20%25 Decline! %22 by trader CryptoMedication - published October 06, 2018**  %0A_For those that have been following the price articles that have been put out in recent times, the recent downturn in%E2%80%A6_www.tradingview.com%5D(https://www.tradingview.com/chart/XRPUSD/6IztJNTJ-Ripple-Looks-Primed-For-a-20-Decline/ %22https://www.tradingview.com/chart/XRPUSD/6IztJNTJ-Ripple-Looks-Primed-For-a-20-Decline/%22)%5B%5D(https://www.tradingview.com/chart/XRPUSD/6IztJNTJ-Ripple-Looks-Primed-For-a-20-Decline/)\n+https://www.tradingview.com/chart/XRPUSD/6IztJNTJ-Ripple-Looks-Primed-For-a-20-Decline/\n %0A%0ATh\n",
      "json_metadata": "{\"tags\":[\"bitcoin\",\"crypto\",\"cryptocurrency\",\"priceanalysis\",\"technicalanalysis\"],\"image\":[\"https://cdn-images-1.medium.com/max/1100/1*vERKeNo7IP-PTL8AVEP45g.png\",\"https://cdn-images-1.medium.com/max/2000/1*hilgeYTFWhG4hVPTFuDf-Q.png\",\"https://cdn-images-1.medium.com/max/2000/1*glCDIAdQ9b_EaCC7bYhtwA.png\",\"https://cdn-images-1.medium.com/max/2000/1*F36qFLkskqgwLf0dkGOcbg.png\",\"https://cdn-images-1.medium.com/max/2000/1*rjYK_nWzAsC6CglOWYmiRQ.png\",\"https://cdn-images-1.medium.com/max/2000/1*QKXY78h0aewwieWiJA7pzQ.png\",\"https://cdn-images-1.medium.com/max/2000/1*SCzh5ggwy2VHkUoJXq5KpA.png\",\"https://cdn-images-1.medium.com/max/2000/1*m188eDFSGMTMek8qNrryCA.png\",\"https://cdn-images-1.medium.com/max/2000/1*1Pat6cZhhSNhySfHPyM4Ow.png\",\"https://cdn-images-1.medium.com/max/2000/1*uIcMmbW5gJq0UOqdwpzVnQ.png\",\"https://cdn-images-1.medium.com/max/2000/1*m-PM3G9RqlIpZ_GHnuPbKg.png\",\"https://cdn-images-1.medium.com/max/2000/1*xlABVsjQbepVAnnQQcgAsQ.png\",\"https://cdn-images-1.medium.com/max/2000/1*RTX3Xf42CR6sx1F0cb_ftw.png\",\"https://cdn-images-1.medium.com/max/2000/1*6_gbya2W9XndO0pUxP45NQ.png\",\"https://cdn-images-1.medium.com/max/2000/1*gbMutJ9_ceC8leGoefYO6g.png\",\"https://cdn-images-1.medium.com/max/1100/0*YoAOMuewT_Qyhd2g.png\",\"https://cdn-images-1.medium.com/max/1100/0*Y4FVy4e7Cm1upt5t.png\",\"https://cdn-images-1.medium.com/max/2000/1*ZPF_St8LUS8xcGkO5gb88g.png\"],\"links\":[\"https://www.tradingview.com/chart/XRPUSD/6IztJNTJ-Ripple-Looks-Primed-For-a-20-Decline/\",\"https://www.tradingview.com/x/vUzhSbxW/\",\"https://www.tradingview.com/x/PDD8rY5Z/\",\"https://www.tradingview.com/x/SmXswU5s/\",\"https://www.tradingview.com/x/fCczaAiu/\",\"https://www.tradingview.com/x/skBsqacw/\",\"https://www.tradingview.com/x/DRrUbnia/\",\"https://www.tradingview.com/x/GK4CdLVa/\",\"https://www.tradingview.com/x/N3WGoCyz/\",\"https://www.tradingview.com/x/AaNUM9co/\",\"https://www.tradingview.com/x/xzNTaYes/\",\"https://www.tradingview.com/x/KtgYCBKp/\",\"https://www.tradingview.com/x/9Tqo9NHY/\",\"https://www.tradingview.com/x/t2YhgV3M/\",\"https://www.tradingview.com/x/ZAkazICA/\",\"https://dailypriceaction.com/friday-qna/should-you-wait-for-a-retest-following-a-forex-breakout\",\"https://www.tradingview.com/x/xesdcuo7/\"],\"app\":\"steemit/0.1\",\"format\":\"markdown\"}"
    }
  ]
}proofofresearchpublished a new post: ripple-looks-ripe-for-a-reload-of-the-shorts2018/10/13 08:05:24
proofofresearchpublished a new post: ripple-looks-ripe-for-a-reload-of-the-shorts
2018/10/13 08:05:24
| parent author | |
| parent permlink | bitcoin |
| author | proofofresearch |
| permlink | ripple-looks-ripe-for-a-reload-of-the-shorts |
| title | Ripple Looks Ripe for a Reload of the Shorts |
| body |  After making the bold (and nearly 100% accurate) claim that Ripple would backslide by nearly 20% in value, this article shall serve as a follow-up of sorts to that claim in order to attest to its veracity (or lack thereof). The claim in specific has been successfully archived on TradingView here: [**"Ripple Looks Primed For a 20% Decline! " by trader CryptoMedication - published October 06, 2018** _For those that have been following the price articles that have been put out in recent times, the recent downturn in…_www.tradingview.com](https://www.tradingview.com/chart/XRPUSD/6IztJNTJ-Ripple-Looks-Primed-For-a-20-Decline/ "https://www.tradingview.com/chart/XRPUSD/6IztJNTJ-Ripple-Looks-Primed-For-a-20-Decline/")[](https://www.tradingview.com/chart/XRPUSD/6IztJNTJ-Ripple-Looks-Primed-For-a-20-Decline/) Thus far, Ripple is down 14% from the price that it was when this original price analysis (advocating for an aggressive short position) was originally crafted. There is a R/R on the trade that describes the exact targets and S/L for the trade here as well. The purpose of this analysis will also be to see whether there needs to be any adjustment in the trading strategy that was prescribed in this article in order to preserve maximum security for consumer funds. ### Ripple Price Analysis  [https://www.tradingview.com/x/vUzhSbxW/](https://www.tradingview.com/x/vUzhSbxW/) From the very first picture, the strong and demonstrable downtrend on the H1 chart (1-hour time frame) should be fairly obvious. ‘  [https://www.tradingview.com/x/PDD8rY5Z/](https://www.tradingview.com/x/PDD8rY5Z/) Each translucent blue box in the picture above represents another instance where the price failed to break above the overhead diagonal downtrend resistance. As credible trading theory dictates, the repeated testing and failure to break above the diagonal downtrend resistance should be seen as a reinforcement of the overhead downtrend resistance as an increasingly strong entity. Again, it is worth noting that this formation has taken place on the H1 chart. ### Brief Look at Chart Formations  [https://www.tradingview.com/x/SmXswU5s/](https://www.tradingview.com/x/SmXswU5s/)  [https://www.tradingview.com/x/fCczaAiu/](https://www.tradingview.com/x/fCczaAiu/) ### Let’s Scroll Out to Larger Chart Resolutions **_Below is the Zero_n0ncense Reversion Ribbon V2 on the H4 :_**  [https://www.tradingview.com/x/skBsqacw/](https://www.tradingview.com/x/skBsqacw/) **_In the picture above, there are a few things of note:_** 1. The ZN Reversion Ribbon V2 has been applied to the chart. This is a custom indicator (i.e., you cannot add this to your TV chart without my express permission at this point in time; give it another day or so). 2. This indicator essentially acts as an indicator and an EMA reversion in one. 3. The fact that the last three candles have a heavy green fill in with a red outside (showing that the red candles have been candled), means that there is strongly waning buy pressure (if any at this point). 4. In addition, there seems to be a slight convergence of the Histogram, which would corroborate the assumption that the gains that are being experienced in the markets at this current point in time are larger temporary in nature and not an indicative of a general ‘bottom’ in the market (although there are numerous accurate contemporary examples that can be made). To wrap it up, the indicator is still flashing off **_bearish signals._** However, here’s a potentially bullish indicator that can be spotted on the daily charts for $XRP. ### Zero_n0ncense Balance of Power RSI (14)  [https://www.tradingview.com/x/DRrUbnia/](https://www.tradingview.com/x/DRrUbnia/) On its face, you read this indicator the exact same way that you read the regular RSI, but with a twist. **_With this indicator:_** 1. The purpose of this line is to track the underlying momentum of the Balance of Power indicator. 2. The Balance of Power indicator is designed to track **_buy and sell pressure_**, not necessarily price action (the normal RSI can track price action). 3. Thus, the Balance of Power RSI provides a means of tracking the **_momentum_** of a cryptocurrency’s underlying buy and sell pressure by smoothing the data from the basis Balance of Power indicator, then subsequently and accurately plotting its momentum by using past price data.  [https://www.tradingview.com/x/GK4CdLVa/](https://www.tradingview.com/x/GK4CdLVa/) What is noteworthy about this indicator is that what the line is literally telling us is that there is **_still no relief in the underlying buy pressure for $XRP._** Now, let’s check out the line on a smaller time frame than the daily to see if we can detect any individuals beginning to accumulate $XRP at some of the levels that it has been over the last couple of days or so while the price action has stabilized.  [https://www.tradingview.com/x/N3WGoCyz/](https://www.tradingview.com/x/N3WGoCyz/) The picture above shows the Balance of Power RSI on the H6 chart. From the data above, it is hard to conclude that there is **_any underlying trend in the price that can be biased toward buying or selling._** ### Volatility RSI  [https://www.tradingview.com/x/AaNUM9co/](https://www.tradingview.com/x/AaNUM9co/) The volatility RSI is yet another custom indicator was designed with volatility as its basis, rather than the price. Thus, as the line nears the bottom, so does volatility. The theory behind this is that volatility generally increases substantially as the price increases (in this bear market), and, as such, when the line is headed upward, so is the general price of the underlying asset that this indicator is tracking volatility for. Thus, from what we can see in the picture above for the H6, the volatility may be very close to ‘bottoming out’ in a short-term sense.  [https://www.tradingview.com/x/xzNTaYes/](https://www.tradingview.com/x/xzNTaYes/) As can be seen in the picture above, the RSI(14) gives us no information that is useful for us to work with on the H6, so let’s pan down to a lower time frame.  [https://www.tradingview.com/x/KtgYCBKp/](https://www.tradingview.com/x/KtgYCBKp/) The same can be said of the H3 as well. Overall, however, the RSI(14) is reflecting a bearish trend that is yet to be broken on the H3 and above, which is still **_very bearish overall_**. ### Aggressing Moving Average Indicator (Custom)  [https://www.tradingview.com/x/9Tqo9NHY/](https://www.tradingview.com/x/9Tqo9NHY/) In situations like these where there appear to be no indicators on the chart that are capable of assisting with the rendering of a predictive analysis, I tend to rely on the ‘fastest ‘ indicators that I have. In this instance, that would be the aggressive MA, which is a custom indicator that is infused with a plethora of mathematical calculations and price signals with the purpose of curating the **_fastest signal_**. As one can see from the chart above, this ‘super fast’ indicator has provided a sell signal. ### Support/Resistance Points **_The most obvious sighting can be spotted directly on the chart itself:_**  [https://www.tradingview.com/x/t2YhgV3M/](https://www.tradingview.com/x/t2YhgV3M/) Above, the overhead resistance that is shown was actually formerly a **_major point of support._**  [https://www.tradingview.com/x/ZAkazICA/](https://www.tradingview.com/x/ZAkazICA/) Therefore, the theory that I have is this: It seems as though the price of Ripple is merely re-testing the overhead resistance point before it continues downward. I say this because; 1. There is nothing in the underlying indicators to suggest that this is a true reversal. 2. The failure of the price to actually break above this overhead resistance which, once again, was a major point of support in numerous instances prior is another major red flag. **_See below to see what I mean:_** Using a set of pictures from the site, [https://dailypriceaction.com/friday-qna/should-you-wait-for-a-retest-following-a-forex-breakout](https://dailypriceaction.com/friday-qna/should-you-wait-for-a-retest-following-a-forex-breakout) , I will illustrate my point:  The scenario that you see above is one of a typical ‘breakout’ where the price has just plummeted through a solid and well-tested uptrend support.  Once this happens, there is usually a period of time where the price will ‘re-test’ that same support as a resistance point before continuing its descent. ### Conclusion Now, the inherent danger here is obvious: **_What if this is not a re-test and the price continues to rise?_** This is a valid fear that most traders have when it comes to making such an assumption because a failure to recognize the difference between a re-test and an ascension toward a higher price point may = dramatic losses in question. However, in this instance, there does not appear to be anything that signifies the price will go up. However, in order to hedge onself, the following R/R is advocated for this trade (if one has consolidated the profits from their short already and is looking to re-enter in with another short position):  [https://www.tradingview.com/x/xesdcuo7/](https://www.tradingview.com/x/xesdcuo7/) The ‘stop’ for this trade is placed slightly below the next overhead resistance point in order to provide greater assurance for traders that the S/L will be successfully triggered (the close one is to a resistance/support point, the more likely it is that the S/L will not trigger in the event that there is a massive switch in sentiment/price action spontaneously) The ‘reward’ / take profit portion of the trade is placed at the same spot that we placed our last reward spot in the preceding price analysis because it is the next reliable support point that can be identified on the chart. |
| json metadata | {"tags":["bitcoin","crypto","cryptocurrency","priceanalysis","technicalanalysis"],"image":["https://cdn-images-1.medium.com/max/1100/1*vERKeNo7IP-PTL8AVEP45g.png","https://cdn-images-1.medium.com/max/2000/1*hilgeYTFWhG4hVPTFuDf-Q.png","https://cdn-images-1.medium.com/max/2000/1*glCDIAdQ9b_EaCC7bYhtwA.png","https://cdn-images-1.medium.com/max/2000/1*F36qFLkskqgwLf0dkGOcbg.png","https://cdn-images-1.medium.com/max/2000/1*rjYK_nWzAsC6CglOWYmiRQ.png","https://cdn-images-1.medium.com/max/2000/1*QKXY78h0aewwieWiJA7pzQ.png","https://cdn-images-1.medium.com/max/2000/1*SCzh5ggwy2VHkUoJXq5KpA.png","https://cdn-images-1.medium.com/max/2000/1*m188eDFSGMTMek8qNrryCA.png","https://cdn-images-1.medium.com/max/2000/1*1Pat6cZhhSNhySfHPyM4Ow.png","https://cdn-images-1.medium.com/max/2000/1*uIcMmbW5gJq0UOqdwpzVnQ.png","https://cdn-images-1.medium.com/max/2000/1*m-PM3G9RqlIpZ_GHnuPbKg.png","https://cdn-images-1.medium.com/max/2000/1*xlABVsjQbepVAnnQQcgAsQ.png","https://cdn-images-1.medium.com/max/2000/1*RTX3Xf42CR6sx1F0cb_ftw.png","https://cdn-images-1.medium.com/max/2000/1*6_gbya2W9XndO0pUxP45NQ.png","https://cdn-images-1.medium.com/max/2000/1*gbMutJ9_ceC8leGoefYO6g.png","https://cdn-images-1.medium.com/max/1100/0*YoAOMuewT_Qyhd2g.png","https://cdn-images-1.medium.com/max/1100/0*Y4FVy4e7Cm1upt5t.png","https://cdn-images-1.medium.com/max/2000/1*ZPF_St8LUS8xcGkO5gb88g.png"],"links":["https://www.tradingview.com/chart/XRPUSD/6IztJNTJ-Ripple-Looks-Primed-For-a-20-Decline/","https://www.tradingview.com/x/vUzhSbxW/","https://www.tradingview.com/x/PDD8rY5Z/","https://www.tradingview.com/x/SmXswU5s/","https://www.tradingview.com/x/fCczaAiu/","https://www.tradingview.com/x/skBsqacw/","https://www.tradingview.com/x/DRrUbnia/","https://www.tradingview.com/x/GK4CdLVa/","https://www.tradingview.com/x/N3WGoCyz/","https://www.tradingview.com/x/AaNUM9co/","https://www.tradingview.com/x/xzNTaYes/","https://www.tradingview.com/x/KtgYCBKp/","https://www.tradingview.com/x/9Tqo9NHY/","https://www.tradingview.com/x/t2YhgV3M/","https://www.tradingview.com/x/ZAkazICA/","https://dailypriceaction.com/friday-qna/should-you-wait-for-a-retest-following-a-forex-breakout","https://www.tradingview.com/x/xesdcuo7/"],"app":"steemit/0.1","format":"markdown"} |
| Transaction Info | Block #26766331/Trx 50802e89fb45f1ddb79c0ecb8bc6bb8141ecf143 |
View Raw JSON Data
{
"trx_id": "50802e89fb45f1ddb79c0ecb8bc6bb8141ecf143",
"block": 26766331,
"trx_in_block": 12,
"op_in_trx": 0,
"virtual_op": 0,
"timestamp": "2018-10-13T08:05:24",
"op": [
"comment",
{
"parent_author": "",
"parent_permlink": "bitcoin",
"author": "proofofresearch",
"permlink": "ripple-looks-ripe-for-a-reload-of-the-shorts",
"title": "Ripple Looks Ripe for a Reload of the Shorts",
"body": "\n\nAfter making the bold (and nearly 100% accurate) claim that Ripple would backslide by nearly 20% in value, this article shall serve as a follow-up of sorts to that claim in order to attest to its veracity (or lack thereof).\n\nThe claim in specific has been successfully archived on TradingView here:\n\n[**\"Ripple Looks Primed For a 20% Decline! \" by trader CryptoMedication - published October 06, 2018** \n_For those that have been following the price articles that have been put out in recent times, the recent downturn in…_www.tradingview.com](https://www.tradingview.com/chart/XRPUSD/6IztJNTJ-Ripple-Looks-Primed-For-a-20-Decline/ \"https://www.tradingview.com/chart/XRPUSD/6IztJNTJ-Ripple-Looks-Primed-For-a-20-Decline/\")[](https://www.tradingview.com/chart/XRPUSD/6IztJNTJ-Ripple-Looks-Primed-For-a-20-Decline/)\n\nThus far, Ripple is down 14% from the price that it was when this original price analysis (advocating for an aggressive short position) was originally crafted.\n\nThere is a R/R on the trade that describes the exact targets and S/L for the trade here as well.\n\nThe purpose of this analysis will also be to see whether there needs to be any adjustment in the trading strategy that was prescribed in this article in order to preserve maximum security for consumer funds.\n\n### Ripple Price Analysis\n\n\n\n[https://www.tradingview.com/x/vUzhSbxW/](https://www.tradingview.com/x/vUzhSbxW/)\n\nFrom the very first picture, the strong and demonstrable downtrend on the H1 chart (1-hour time frame) should be fairly obvious. ‘\n\n\n\n[https://www.tradingview.com/x/PDD8rY5Z/](https://www.tradingview.com/x/PDD8rY5Z/)\n\nEach translucent blue box in the picture above represents another instance where the price failed to break above the overhead diagonal downtrend resistance.\n\nAs credible trading theory dictates, the repeated testing and failure to break above the diagonal downtrend resistance should be seen as a reinforcement of the overhead downtrend resistance as an increasingly strong entity.\n\nAgain, it is worth noting that this formation has taken place on the H1 chart.\n\n### Brief Look at Chart Formations\n\n\n\n[https://www.tradingview.com/x/SmXswU5s/](https://www.tradingview.com/x/SmXswU5s/)\n\n\n\n[https://www.tradingview.com/x/fCczaAiu/](https://www.tradingview.com/x/fCczaAiu/)\n\n### Let’s Scroll Out to Larger Chart Resolutions\n\n \n\n**_Below is the Zero_n0ncense Reversion Ribbon V2 on the H4 :_**\n\n\n\n[https://www.tradingview.com/x/skBsqacw/](https://www.tradingview.com/x/skBsqacw/)\n\n**_In the picture above, there are a few things of note:_**\n\n1. The ZN Reversion Ribbon V2 has been applied to the chart. This is a custom indicator (i.e., you cannot add this to your TV chart without my express permission at this point in time; give it another day or so).\n2. This indicator essentially acts as an indicator and an EMA reversion in one.\n3. The fact that the last three candles have a heavy green fill in with a red outside (showing that the red candles have been candled), means that there is strongly waning buy pressure (if any at this point).\n4. In addition, there seems to be a slight convergence of the Histogram, which would corroborate the assumption that the gains that are being experienced in the markets at this current point in time are larger temporary in nature and not an indicative of a general ‘bottom’ in the market (although there are numerous accurate contemporary examples that can be made).\n\nTo wrap it up, the indicator is still flashing off **_bearish signals._**\n\nHowever, here’s a potentially bullish indicator that can be spotted on the daily charts for $XRP.\n\n### Zero_n0ncense Balance of Power RSI (14)\n\n\n\n[https://www.tradingview.com/x/DRrUbnia/](https://www.tradingview.com/x/DRrUbnia/)\n\nOn its face, you read this indicator the exact same way that you read the regular RSI, but with a twist.\n\n**_With this indicator:_**\n\n1. The purpose of this line is to track the underlying momentum of the Balance of Power indicator.\n2. The Balance of Power indicator is designed to track **_buy and sell pressure_**, not necessarily price action (the normal RSI can track price action).\n3. Thus, the Balance of Power RSI provides a means of tracking the **_momentum_** of a cryptocurrency’s underlying buy and sell pressure by smoothing the data from the basis Balance of Power indicator, then subsequently and accurately plotting its momentum by using past price data.\n\n\n\n[https://www.tradingview.com/x/GK4CdLVa/](https://www.tradingview.com/x/GK4CdLVa/)\n\nWhat is noteworthy about this indicator is that what the line is literally telling us is that there is **_still no relief in the underlying buy pressure for $XRP._**\n\nNow, let’s check out the line on a smaller time frame than the daily to see if we can detect any individuals beginning to accumulate $XRP at some of the levels that it has been over the last couple of days or so while the price action has stabilized.\n\n\n\n[https://www.tradingview.com/x/N3WGoCyz/](https://www.tradingview.com/x/N3WGoCyz/)\n\nThe picture above shows the Balance of Power RSI on the H6 chart.\n\nFrom the data above, it is hard to conclude that there is **_any underlying trend in the price that can be biased toward buying or selling._**\n\n \n\n### Volatility RSI\n\n\n\n[https://www.tradingview.com/x/AaNUM9co/](https://www.tradingview.com/x/AaNUM9co/)\n\nThe volatility RSI is yet another custom indicator was designed with volatility as its basis, rather than the price.\n\nThus, as the line nears the bottom, so does volatility.\n\nThe theory behind this is that volatility generally increases substantially as the price increases (in this bear market), and, as such, when the line is headed upward, so is the general price of the underlying asset that this indicator is tracking volatility for.\n\nThus, from what we can see in the picture above for the H6, the volatility may be very close to ‘bottoming out’ in a short-term sense.\n\n\n\n[https://www.tradingview.com/x/xzNTaYes/](https://www.tradingview.com/x/xzNTaYes/)\n\nAs can be seen in the picture above, the RSI(14) gives us no information that is useful for us to work with on the H6, so let’s pan down to a lower time frame.\n\n\n\n[https://www.tradingview.com/x/KtgYCBKp/](https://www.tradingview.com/x/KtgYCBKp/)\n\nThe same can be said of the H3 as well.\n\nOverall, however, the RSI(14) is reflecting a bearish trend that is yet to be broken on the H3 and above, which is still **_very bearish overall_**.\n\n### Aggressing Moving Average Indicator (Custom)\n\n\n\n[https://www.tradingview.com/x/9Tqo9NHY/](https://www.tradingview.com/x/9Tqo9NHY/)\n\nIn situations like these where there appear to be no indicators on the chart that are capable of assisting with the rendering of a predictive analysis, I tend to rely on the ‘fastest ‘ indicators that I have.\n\nIn this instance, that would be the aggressive MA, which is a custom indicator that is infused with a plethora of mathematical calculations and price signals with the purpose of curating the **_fastest signal_**.\n\nAs one can see from the chart above, this ‘super fast’ indicator has provided a sell signal.\n\n### Support/Resistance Points\n\n \n\n**_The most obvious sighting can be spotted directly on the chart itself:_**\n\n\n\n[https://www.tradingview.com/x/t2YhgV3M/](https://www.tradingview.com/x/t2YhgV3M/)\n\nAbove, the overhead resistance that is shown was actually formerly a **_major point of support._**\n\n\n\n[https://www.tradingview.com/x/ZAkazICA/](https://www.tradingview.com/x/ZAkazICA/)\n\nTherefore, the theory that I have is this:\n\nIt seems as though the price of Ripple is merely re-testing the overhead resistance point before it continues downward.\n\nI say this because;\n\n1. There is nothing in the underlying indicators to suggest that this is a true reversal.\n2. The failure of the price to actually break above this overhead resistance which, once again, was a major point of support in numerous instances prior is another major red flag.\n\n**_See below to see what I mean:_**\n\nUsing a set of pictures from the site, [https://dailypriceaction.com/friday-qna/should-you-wait-for-a-retest-following-a-forex-breakout](https://dailypriceaction.com/friday-qna/should-you-wait-for-a-retest-following-a-forex-breakout) , I will illustrate my point:\n\n\n\nThe scenario that you see above is one of a typical ‘breakout’ where the price has just plummeted through a solid and well-tested uptrend support.\n\n \n\n\n\n \n\nOnce this happens, there is usually a period of time where the price will ‘re-test’ that same support as a resistance point before continuing its descent.\n\n### Conclusion\n\nNow, the inherent danger here is obvious:\n\n**_What if this is not a re-test and the price continues to rise?_**\n\nThis is a valid fear that most traders have when it comes to making such an assumption because a failure to recognize the difference between a re-test and an ascension toward a higher price point may = dramatic losses in question.\n\nHowever, in this instance, there does not appear to be anything that signifies the price will go up.\n\nHowever, in order to hedge onself, the following R/R is advocated for this trade (if one has consolidated the profits from their short already and is looking to re-enter in with another short position):\n\n\n\n[https://www.tradingview.com/x/xesdcuo7/](https://www.tradingview.com/x/xesdcuo7/)\n\nThe ‘stop’ for this trade is placed slightly below the next overhead resistance point in order to provide greater assurance for traders that the S/L will be successfully triggered (the close one is to a resistance/support point, the more likely it is that the S/L will not trigger in the event that there is a massive switch in sentiment/price action spontaneously)\n\nThe ‘reward’ / take profit portion of the trade is placed at the same spot that we placed our last reward spot in the preceding price analysis because it is the next reliable support point that can be identified on the chart.",
"json_metadata": "{\"tags\":[\"bitcoin\",\"crypto\",\"cryptocurrency\",\"priceanalysis\",\"technicalanalysis\"],\"image\":[\"https://cdn-images-1.medium.com/max/1100/1*vERKeNo7IP-PTL8AVEP45g.png\",\"https://cdn-images-1.medium.com/max/2000/1*hilgeYTFWhG4hVPTFuDf-Q.png\",\"https://cdn-images-1.medium.com/max/2000/1*glCDIAdQ9b_EaCC7bYhtwA.png\",\"https://cdn-images-1.medium.com/max/2000/1*F36qFLkskqgwLf0dkGOcbg.png\",\"https://cdn-images-1.medium.com/max/2000/1*rjYK_nWzAsC6CglOWYmiRQ.png\",\"https://cdn-images-1.medium.com/max/2000/1*QKXY78h0aewwieWiJA7pzQ.png\",\"https://cdn-images-1.medium.com/max/2000/1*SCzh5ggwy2VHkUoJXq5KpA.png\",\"https://cdn-images-1.medium.com/max/2000/1*m188eDFSGMTMek8qNrryCA.png\",\"https://cdn-images-1.medium.com/max/2000/1*1Pat6cZhhSNhySfHPyM4Ow.png\",\"https://cdn-images-1.medium.com/max/2000/1*uIcMmbW5gJq0UOqdwpzVnQ.png\",\"https://cdn-images-1.medium.com/max/2000/1*m-PM3G9RqlIpZ_GHnuPbKg.png\",\"https://cdn-images-1.medium.com/max/2000/1*xlABVsjQbepVAnnQQcgAsQ.png\",\"https://cdn-images-1.medium.com/max/2000/1*RTX3Xf42CR6sx1F0cb_ftw.png\",\"https://cdn-images-1.medium.com/max/2000/1*6_gbya2W9XndO0pUxP45NQ.png\",\"https://cdn-images-1.medium.com/max/2000/1*gbMutJ9_ceC8leGoefYO6g.png\",\"https://cdn-images-1.medium.com/max/1100/0*YoAOMuewT_Qyhd2g.png\",\"https://cdn-images-1.medium.com/max/1100/0*Y4FVy4e7Cm1upt5t.png\",\"https://cdn-images-1.medium.com/max/2000/1*ZPF_St8LUS8xcGkO5gb88g.png\"],\"links\":[\"https://www.tradingview.com/chart/XRPUSD/6IztJNTJ-Ripple-Looks-Primed-For-a-20-Decline/\",\"https://www.tradingview.com/x/vUzhSbxW/\",\"https://www.tradingview.com/x/PDD8rY5Z/\",\"https://www.tradingview.com/x/SmXswU5s/\",\"https://www.tradingview.com/x/fCczaAiu/\",\"https://www.tradingview.com/x/skBsqacw/\",\"https://www.tradingview.com/x/DRrUbnia/\",\"https://www.tradingview.com/x/GK4CdLVa/\",\"https://www.tradingview.com/x/N3WGoCyz/\",\"https://www.tradingview.com/x/AaNUM9co/\",\"https://www.tradingview.com/x/xzNTaYes/\",\"https://www.tradingview.com/x/KtgYCBKp/\",\"https://www.tradingview.com/x/9Tqo9NHY/\",\"https://www.tradingview.com/x/t2YhgV3M/\",\"https://www.tradingview.com/x/ZAkazICA/\",\"https://dailypriceaction.com/friday-qna/should-you-wait-for-a-retest-following-a-forex-breakout\",\"https://www.tradingview.com/x/xesdcuo7/\"],\"app\":\"steemit/0.1\",\"format\":\"markdown\"}"
}
]
}2018/10/13 06:55:51
2018/10/13 06:55:51
| voter | mrakodrap |
| author | proofofresearch |
| permlink | serious-accumulation-on-litecoin-could-precede-a-major-boom-in-price |
| weight | 1000 (10.00%) |
| Transaction Info | Block #26764941/Trx bfdd33744134f34a5e8dfb2423ab72683d6e899f |
View Raw JSON Data
{
  "trx_id": "bfdd33744134f34a5e8dfb2423ab72683d6e899f",
  "block": 26764941,
  "trx_in_block": 12,
  "op_in_trx": 0,
  "virtual_op": 0,
  "timestamp": "2018-10-13T06:55:51",
  "op": [
    "vote",
    {
      "voter": "mrakodrap",
      "author": "proofofresearch",
      "permlink": "serious-accumulation-on-litecoin-could-precede-a-major-boom-in-price",
      "weight": 1000
    }
  ]
}2018/10/13 04:46:54
2018/10/13 04:46:54
| voter | proofofresearch |
| author | proofofresearch |
| permlink | serious-accumulation-on-litecoin-could-precede-a-major-boom-in-price |
| weight | 10000 (100.00%) |
| Transaction Info | Block #26762362/Trx fcd0836223ae0499ebdc190736f18e1e822a3b63 |
View Raw JSON Data
{
  "trx_id": "fcd0836223ae0499ebdc190736f18e1e822a3b63",
  "block": 26762362,
  "trx_in_block": 15,
  "op_in_trx": 0,
  "virtual_op": 0,
  "timestamp": "2018-10-13T04:46:54",
  "op": [
    "vote",
    {
      "voter": "proofofresearch",
      "author": "proofofresearch",
      "permlink": "serious-accumulation-on-litecoin-could-precede-a-major-boom-in-price",
      "weight": 10000
    }
  ]
}proofofresearchpublished a new post: serious-accumulation-on-litecoin-could-precede-a-major-boom-in-price2018/10/13 04:46:45
proofofresearchpublished a new post: serious-accumulation-on-litecoin-could-precede-a-major-boom-in-price
2018/10/13 04:46:45
| parent author | |
| parent permlink | bitcoin |
| author | proofofresearch |
| permlink | serious-accumulation-on-litecoin-could-precede-a-major-boom-in-price |
| title | This was a test post |
| body | Testing with an older post to see if I'm still able to actually post on Steemit without them charging an arm and a leg. |
| json metadata | {"tags":["bitcoin","crypto","cryptocurrency","priceanalysis","technicalanalysis"],"app":"steemit/0.1","format":"markdown"} |
| Transaction Info | Block #26762359/Trx 4a6d27fdce0ddd3353aeea4450f77d1a3d845581 |
View Raw JSON Data
{
  "trx_id": "4a6d27fdce0ddd3353aeea4450f77d1a3d845581",
  "block": 26762359,
  "trx_in_block": 5,
  "op_in_trx": 0,
  "virtual_op": 0,
  "timestamp": "2018-10-13T04:46:45",
  "op": [
    "comment",
    {
      "parent_author": "",
      "parent_permlink": "bitcoin",
      "author": "proofofresearch",
      "permlink": "serious-accumulation-on-litecoin-could-precede-a-major-boom-in-price",
      "title": "This was a test post",
      "body": "Testing with an older post to see if I'm still able to actually post on Steemit without them  charging an arm and a leg.",
      "json_metadata": "{\"tags\":[\"bitcoin\",\"crypto\",\"cryptocurrency\",\"priceanalysis\",\"technicalanalysis\"],\"app\":\"steemit/0.1\",\"format\":\"markdown\"}"
    }
  ]
}2018/10/13 04:46:18
2018/10/13 04:46:18
| parent author | proofofresearch |
| parent permlink | serious-accumulation-on-litecoin-could-precede-a-major-boom-in-price |
| author | cheetah |
| permlink | cheetah-re-proofofresearchserious-accumulation-on-litecoin-could-precede-a-major-boom-in-price |
| title | |
| body | Hi! I am a robot. I just upvoted you! I found similar content that readers might be interested in: https://bitcoinexchangeguide.com/serious-accumulation-on-litecoin-ltc-could-precede-a-major-boom-in-price/ |
| json metadata | |
| Transaction Info | Block #26762350/Trx 8bd6f4c820df6cf83c4bfceba3e7674be01ac8b7 |
View Raw JSON Data
{
  "trx_id": "8bd6f4c820df6cf83c4bfceba3e7674be01ac8b7",
  "block": 26762350,
  "trx_in_block": 16,
  "op_in_trx": 0,
  "virtual_op": 0,
  "timestamp": "2018-10-13T04:46:18",
  "op": [
    "comment",
    {
      "parent_author": "proofofresearch",
      "parent_permlink": "serious-accumulation-on-litecoin-could-precede-a-major-boom-in-price",
      "author": "cheetah",
      "permlink": "cheetah-re-proofofresearchserious-accumulation-on-litecoin-could-precede-a-major-boom-in-price",
      "title": "",
      "body": "Hi! I am a robot. I just upvoted you! I found similar content that readers might be interested in:\nhttps://bitcoinexchangeguide.com/serious-accumulation-on-litecoin-ltc-could-precede-a-major-boom-in-price/",
      "json_metadata": ""
    }
  ]
}2018/10/13 04:46:12
2018/10/13 04:46:12
| voter | cheetah |
| author | proofofresearch |
| permlink | serious-accumulation-on-litecoin-could-precede-a-major-boom-in-price |
| weight | 8 (0.08%) |
| Transaction Info | Block #26762348/Trx ea13155f02cee4fe22c8345a8a2b313a0f990735 |
View Raw JSON Data
{
  "trx_id": "ea13155f02cee4fe22c8345a8a2b313a0f990735",
  "block": 26762348,
  "trx_in_block": 6,
  "op_in_trx": 0,
  "virtual_op": 0,
  "timestamp": "2018-10-13T04:46:12",
  "op": [
    "vote",
    {
      "voter": "cheetah",
      "author": "proofofresearch",
      "permlink": "serious-accumulation-on-litecoin-could-precede-a-major-boom-in-price",
      "weight": 8
    }
  ]
}proofofresearchpublished a new post: serious-accumulation-on-litecoin-could-precede-a-major-boom-in-price2018/10/13 04:46:03
proofofresearchpublished a new post: serious-accumulation-on-litecoin-could-precede-a-major-boom-in-price
2018/10/13 04:46:03
| parent author | |
| parent permlink | bitcoin |
| author | proofofresearch |
| permlink | serious-accumulation-on-litecoin-could-precede-a-major-boom-in-price |
| title | Serious Accumulation on Litecoin Could Precede a Major Boom in Price |
| body | # Serious Accumulation on Litecoin Could Precede a Major Boom in Price  Originally posted at: [https://bitcoinexchangeguide.com/serious-accumulation-on-litecoin-ltc-could-precede-a-major-boom-in-price/](https://bitcoinexchangeguide.com/serious-accumulation-on-litecoin-ltc-could-precede-a-major-boom-in-price/) ; Author: Zerononcense / ProofofResearch At the time of writing, it appears that Litecoin has **_finally gained some level of momentum in the markets_** after consolidating for a number of days. This is notable because, among its peers (other coins in the T10), Litecoin has been posting a solid performance. This is reflected in the chart below, which provides a comparison among the coins; Litecoin, Ethereum, Ripple, Bitcoin, Bitcoin Cash, Stellar Lumens and Monero on a price scale that adjusts the scale of the prices to a 100 max in order to render a valid comparison (because you can’t compare a $60 Litecoin to a $6,500 Bitcoin).  [https://www.tradingview.com/x/SpRxsA0Y/](https://www.tradingview.com/x/SpRxsA0Y/) If the price chart above seems a bit confusing, don’t worry — below is a comprehensive itemized list of the information that is most important to glean from Litecoin’s price movements: 1. Litecoin is currently ranked 4th among ‘competing coins’ in the T10, which places it exactly in the middle of the pack among our 7 coin sample behind Stellar Lumens, Ripple, Bitcoin Cash (which recently surpassed it in performance). Conversely, Litecoin is currently above Bitcoin, Monero, and Ethereum in terms of price movement. 2. Litecoin’s performance as of late has picked up some steam. However, in terms of its ‘rank’ among the 6 other competitors on our list, Bitcoin Cash’s recent performance has outpaced it in a number of ways, leaving Litecoin in the middle of the pack in terms of $$ appreciation. 3. In an unrelated note, its worth pointing out the observation that Bitcoin is currently at the **_bottom of this list_**. 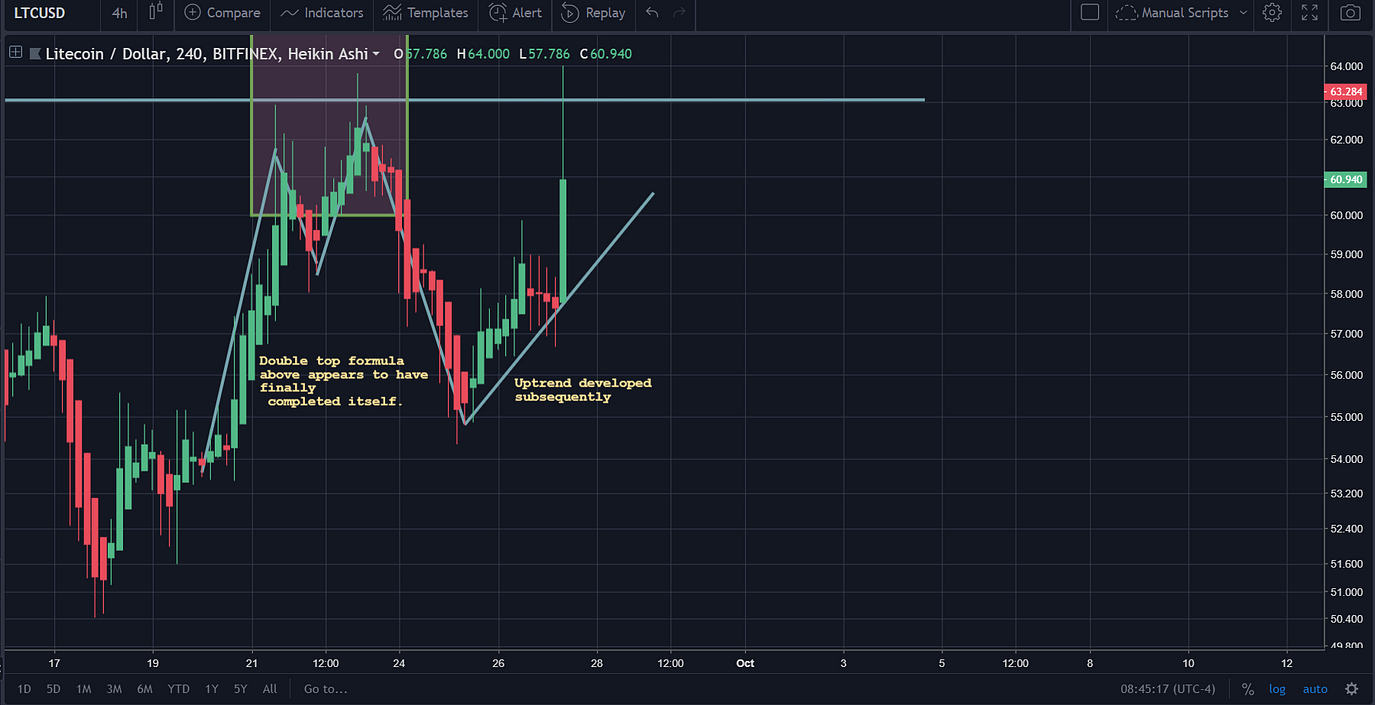 [https://www.tradingview.com/x/sbH27yne/](https://www.tradingview.com/x/sbH27yne/) 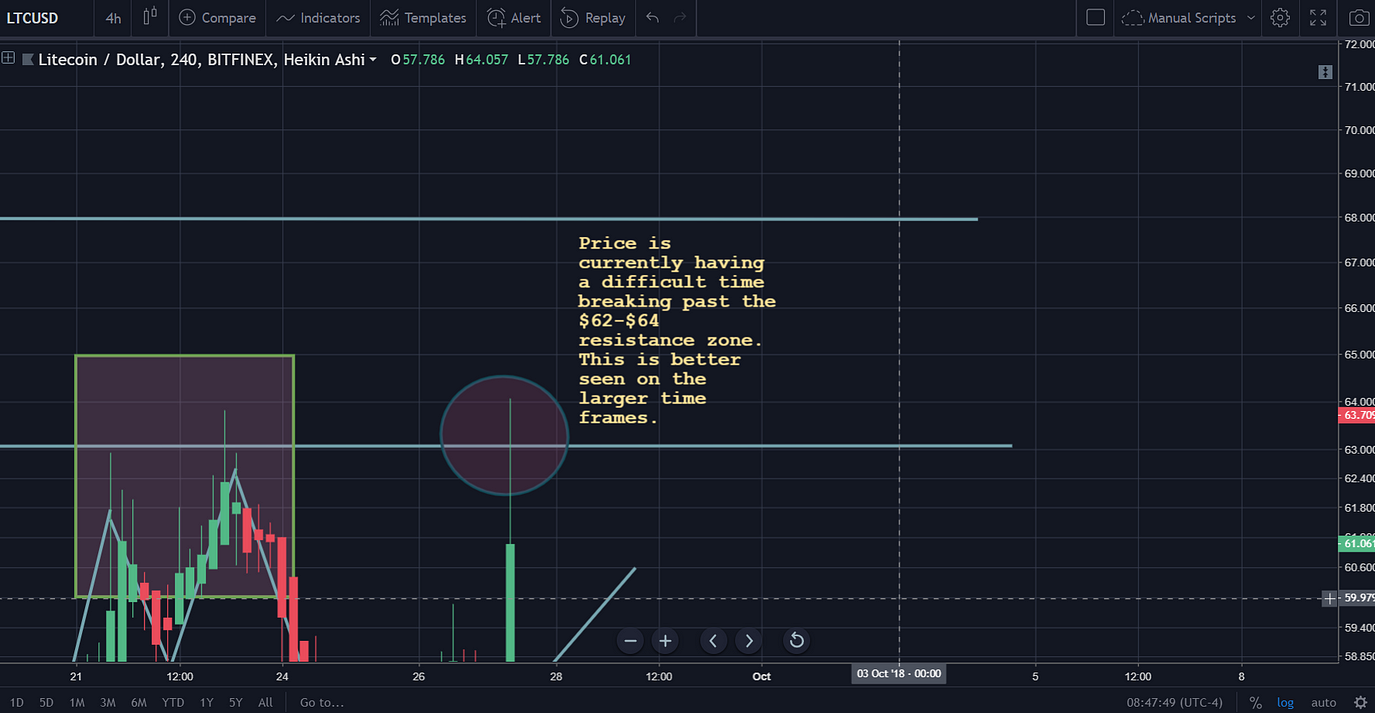 [https://www.tradingview.com/x/dve4hCj0/](https://www.tradingview.com/x/dve4hCj0/) Above is Litecoin on the H4 chart. As the above two pictures show, there was an ever so slight double-top pattern that concluded around September 25th, that was followed by an abrupt uptick in the price, followed by a sudden breakout on the chart’s most current candle (at the time of writing). As noted in earlier price analysis articles, its never a wise idea to trade upon data that is formulating at the moment. Thus, the notes that are drawn in the pictures above are only for educational/entertainment purposes. The indicators, however, yield more useful information about the underlying price movements for Litecoin over the last few periods. # Zero_n0ncense BoP RSI As noted in prior documentation, this is a custom indicator. 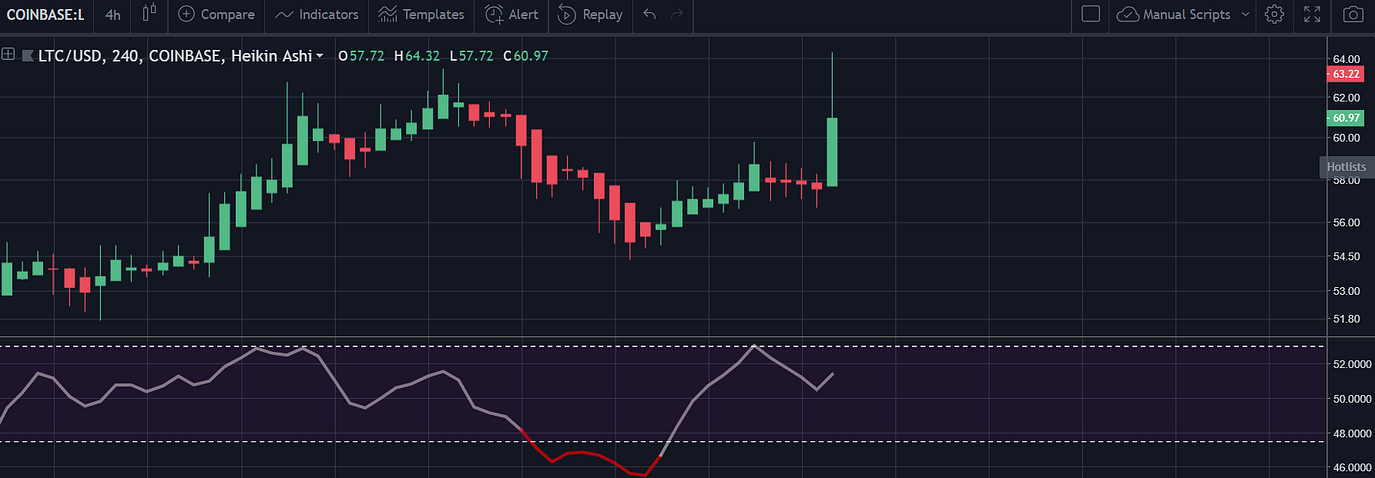 [https://www.tradingview.com/x/ho6n3TgQ/](https://www.tradingview.com/x/ho6n3TgQ/) Using the principle of the Balance of Power, this indicator is able to dictate when there is immense selling pressure and, conversely, when there is accumulation. From the chart above, its apparent that there was a heavy undercurrent of accumulation among traders while the price was consolidating. When this occurs, this is almost always a precursor to noteworthy gains in the near future. 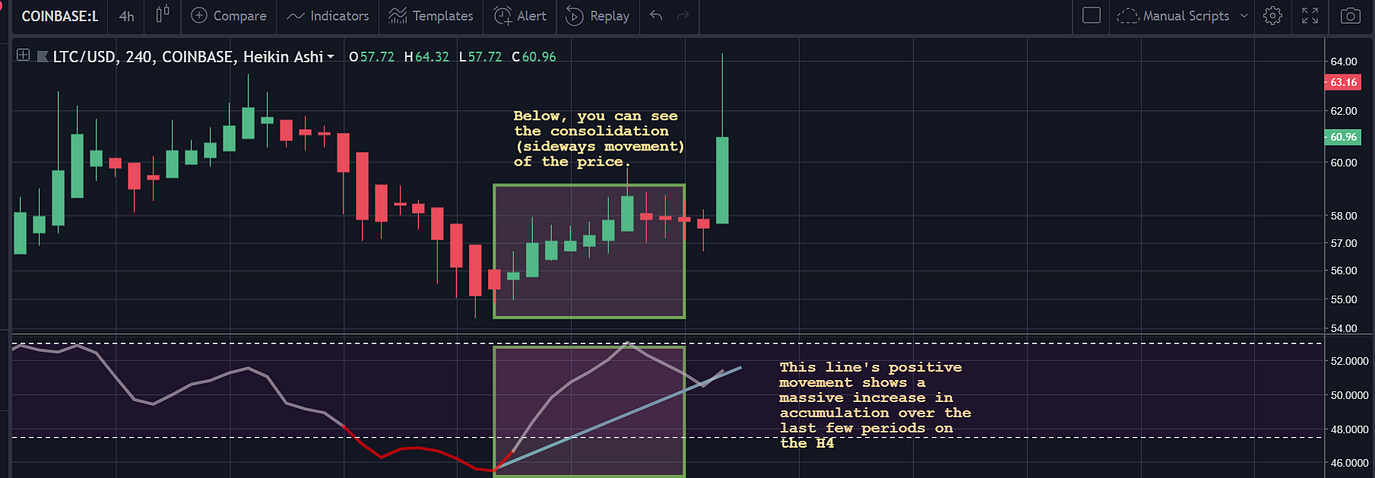 [https://www.tradingview.com/x/uGEhK0oF/](https://www.tradingview.com/x/uGEhK0oF/) # Litecoin on the Daily While the daily is substantially more bullish for Litecoin (USD pairing), we can still see the major undercurrent of accumulation here as well. 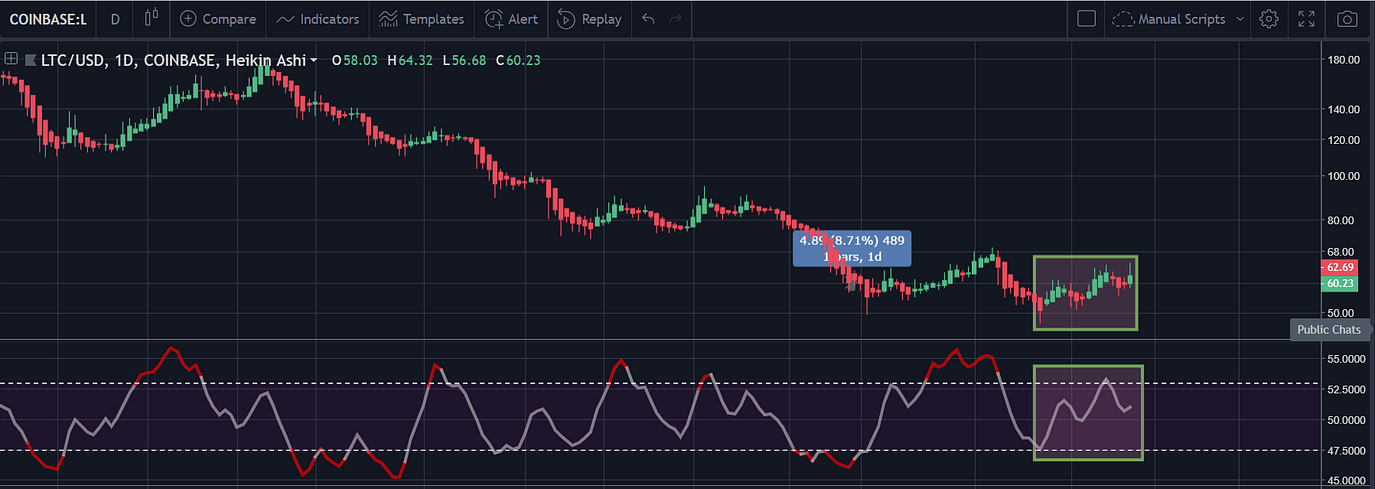 [https://www.tradingview.com/x/ejQdPluT/](https://www.tradingview.com/x/ejQdPluT/) Volatility has been slowly increasing over this time period as well after reaching a low a few weeks ago, and it appears that the price of Litecoin **_could be poised_** to make some further sustained gains in the market. # Descending Triangle Formation  [https://www.tradingview.com/x/e5UbEOx4/](https://www.tradingview.com/x/e5UbEOx4/) **_Above, it appears that Litecoin is in the midst of a descending triangle formation:_** 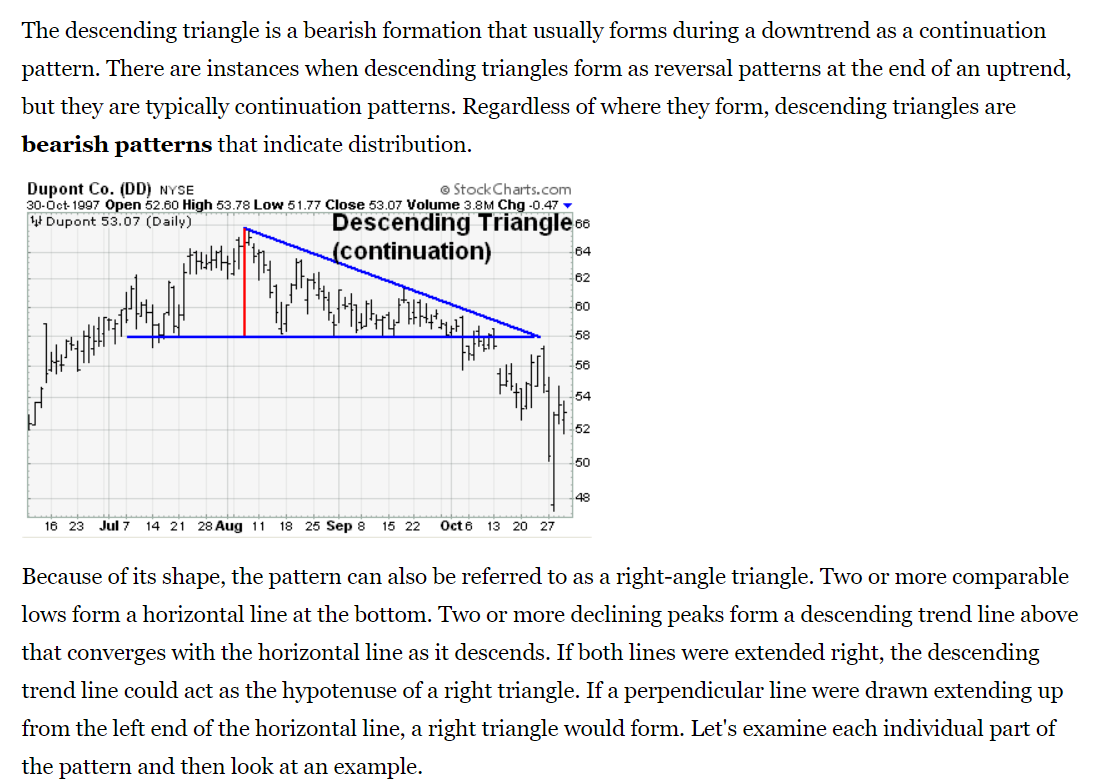 Source: [https://stockcharts.com/school/doku.php?id=chart_school:chart_analysis:chart_patterns:descending_triangle_continuation](https://stockcharts.com/school/doku.php?id=chart_school:chart_analysis:chart_patterns:descending_triangle_continuation) Convention states that this would be a **continuation pattern**_._ So, in this situation, that means that the price is supposed to break downward. However, the price could go either way. # Conclusion Given the formation of the descending triangle formation in conjunction with the underlying bullish sentiment on the chart, the future of Litecoin’s price action is fairly ambivalent at this point. However, if Litecoin manages to break out above the downtrend line (that it is currently trading against, depicted in the photo above), then the price gains from that point moving forward could be substantial. There are other points of analysis that traders must look at before considering themselves ‘educated’ on the possible price action moving from this point. However, if a trader has sufficiently hedged their risk on the market, then they should be safe. **_Disclaimer: The author neither owns any cryptocurrency at this time and has no affiliation with Litecoin, its subsidiaries or related entities. This article is not financial advice and the author holds zero liability for any decisions that you make contingent upon the information contained within._** |
| json metadata | {"tags":["bitcoin","crypto","cryptocurrency","priceanalysis","technicalanalysis"],"image":["https://cdn-images-1.medium.com/max/1100/1*XWQJSYvdPBbNL8lAWTnTRA.gif","https://cdn-images-1.medium.com/max/1375/1*fTrSC4Mlfgm-1znRIRR63Q.png","https://cdn-images-1.medium.com/max/1375/1*121TEBMUJ7eDz6ks2wST1g.png","https://cdn-images-1.medium.com/max/1375/1*ERf3lC3E4G3CLiNA_zV2lQ.png","https://cdn-images-1.medium.com/max/1375/1*3GVl2YCIwXMRIfgM0CkiYA.png","https://cdn-images-1.medium.com/max/1375/1*p4t7ufxrLydcEemHUeqMJw.png","https://cdn-images-1.medium.com/max/1375/1*WwxZpPZ4BdfuQC7Sic0b7g.png","https://cdn-images-1.medium.com/max/1375/1*mHhTX6OxKRLiQZDD8nbTkQ.png","https://cdn-images-1.medium.com/max/1375/1*GdHIaKdywpT6drhMlWAr4A.png"],"links":["https://bitcoinexchangeguide.com/serious-accumulation-on-litecoin-ltc-could-precede-a-major-boom-in-price/","https://www.tradingview.com/x/SpRxsA0Y/","https://www.tradingview.com/x/sbH27yne/","https://www.tradingview.com/x/dve4hCj0/","https://www.tradingview.com/x/ho6n3TgQ/","https://www.tradingview.com/x/uGEhK0oF/","https://www.tradingview.com/x/ejQdPluT/","https://www.tradingview.com/x/e5UbEOx4/","https://stockcharts.com/school/doku.php?id=chart_school:chart_analysis:chart_patterns:descending_triangle_continuation"],"app":"steemit/0.1","format":"markdown"} |
| Transaction Info | Block #26762345/Trx 09a3550a54242ab1f3c7a1f3329282cd821f5ccd |
View Raw JSON Data
{
"trx_id": "09a3550a54242ab1f3c7a1f3329282cd821f5ccd",
"block": 26762345,
"trx_in_block": 19,
"op_in_trx": 0,
"virtual_op": 0,
"timestamp": "2018-10-13T04:46:03",
"op": [
"comment",
{
"parent_author": "",
"parent_permlink": "bitcoin",
"author": "proofofresearch",
"permlink": "serious-accumulation-on-litecoin-could-precede-a-major-boom-in-price",
"title": "Serious Accumulation on Litecoin Could Precede a Major Boom in Price",
"body": "# Serious Accumulation on Litecoin Could Precede a Major Boom in Price\n\n\n\nOriginally posted at: [https://bitcoinexchangeguide.com/serious-accumulation-on-litecoin-ltc-could-precede-a-major-boom-in-price/](https://bitcoinexchangeguide.com/serious-accumulation-on-litecoin-ltc-could-precede-a-major-boom-in-price/) ; Author: Zerononcense / ProofofResearch\n\nAt the time of writing, it appears that Litecoin has **_finally gained some level of momentum in the markets_** after consolidating for a number of days.\n\nThis is notable because, among its peers (other coins in the T10), Litecoin has been posting a solid performance.\n\nThis is reflected in the chart below, which provides a comparison among the coins; Litecoin, Ethereum, Ripple, Bitcoin, Bitcoin Cash, Stellar Lumens and Monero on a price scale that adjusts the scale of the prices to a 100 max in order to render a valid comparison (because you can’t compare a $60 Litecoin to a $6,500 Bitcoin).\n\n\n\n[https://www.tradingview.com/x/SpRxsA0Y/](https://www.tradingview.com/x/SpRxsA0Y/)\n\nIf the price chart above seems a bit confusing, don’t worry — below is a comprehensive itemized list of the information that is most important to glean from Litecoin’s price movements:\n\n1. Litecoin is currently ranked 4th among ‘competing coins’ in the T10, which places it exactly in the middle of the pack among our 7 coin sample behind Stellar Lumens, Ripple, Bitcoin Cash (which recently surpassed it in performance). Conversely, Litecoin is currently above Bitcoin, Monero, and Ethereum in terms of price movement.\n2. Litecoin’s performance as of late has picked up some steam. However, in terms of its ‘rank’ among the 6 other competitors on our list, Bitcoin Cash’s recent performance has outpaced it in a number of ways, leaving Litecoin in the middle of the pack in terms of $$ appreciation.\n3. In an unrelated note, its worth pointing out the observation that Bitcoin is currently at the **_bottom of this list_**.\n\n\n\n[https://www.tradingview.com/x/sbH27yne/](https://www.tradingview.com/x/sbH27yne/)\n\n\n\n[https://www.tradingview.com/x/dve4hCj0/](https://www.tradingview.com/x/dve4hCj0/)\n\nAbove is Litecoin on the H4 chart.\n\nAs the above two pictures show, there was an ever so slight double-top pattern that concluded around September 25th, that was followed by an abrupt uptick in the price, followed by a sudden breakout on the chart’s most current candle (at the time of writing).\n\nAs noted in earlier price analysis articles, its never a wise idea to trade upon data that is formulating at the moment. Thus, the notes that are drawn in the pictures above are only for educational/entertainment purposes.\n\nThe indicators, however, yield more useful information about the underlying price movements for Litecoin over the last few periods.\n\n# Zero_n0ncense BoP RSI\n\nAs noted in prior documentation, this is a custom indicator.\n\n\n\n[https://www.tradingview.com/x/ho6n3TgQ/](https://www.tradingview.com/x/ho6n3TgQ/)\n\nUsing the principle of the Balance of Power, this indicator is able to dictate when there is immense selling pressure and, conversely, when there is accumulation.\n\nFrom the chart above, its apparent that there was a heavy undercurrent of accumulation among traders while the price was consolidating.\n\nWhen this occurs, this is almost always a precursor to noteworthy gains in the near future.\n\n\n\n[https://www.tradingview.com/x/uGEhK0oF/](https://www.tradingview.com/x/uGEhK0oF/)\n\n# Litecoin on the Daily\n\nWhile the daily is substantially more bullish for Litecoin (USD pairing), we can still see the major undercurrent of accumulation here as well.\n\n\n\n[https://www.tradingview.com/x/ejQdPluT/](https://www.tradingview.com/x/ejQdPluT/)\n\nVolatility has been slowly increasing over this time period as well after reaching a low a few weeks ago, and it appears that the price of Litecoin **_could be poised_** to make some further sustained gains in the market.\n\n# Descending Triangle Formation\n\n\n\n[https://www.tradingview.com/x/e5UbEOx4/](https://www.tradingview.com/x/e5UbEOx4/)\n\n**_Above, it appears that Litecoin is in the midst of a descending triangle formation:_**\n\n\n\nSource: [https://stockcharts.com/school/doku.php?id=chart_school:chart_analysis:chart_patterns:descending_triangle_continuation](https://stockcharts.com/school/doku.php?id=chart_school:chart_analysis:chart_patterns:descending_triangle_continuation)\n\nConvention states that this would be a **continuation pattern**_._\n\nSo, in this situation, that means that the price is supposed to break downward.\n\nHowever, the price could go either way.\n\n# Conclusion\n\nGiven the formation of the descending triangle formation in conjunction with the underlying bullish sentiment on the chart, the future of Litecoin’s price action is fairly ambivalent at this point.\n\nHowever, if Litecoin manages to break out above the downtrend line (that it is currently trading against, depicted in the photo above), then the price gains from that point moving forward could be substantial.\n\nThere are other points of analysis that traders must look at before considering themselves ‘educated’ on the possible price action moving from this point. However, if a trader has sufficiently hedged their risk on the market, then they should be safe.\n\n**_Disclaimer: The author neither owns any cryptocurrency at this time and has no affiliation with Litecoin, its subsidiaries or related entities. This article is not financial advice and the author holds zero liability for any decisions that you make contingent upon the information contained within._**",
"json_metadata": "{\"tags\":[\"bitcoin\",\"crypto\",\"cryptocurrency\",\"priceanalysis\",\"technicalanalysis\"],\"image\":[\"https://cdn-images-1.medium.com/max/1100/1*XWQJSYvdPBbNL8lAWTnTRA.gif\",\"https://cdn-images-1.medium.com/max/1375/1*fTrSC4Mlfgm-1znRIRR63Q.png\",\"https://cdn-images-1.medium.com/max/1375/1*121TEBMUJ7eDz6ks2wST1g.png\",\"https://cdn-images-1.medium.com/max/1375/1*ERf3lC3E4G3CLiNA_zV2lQ.png\",\"https://cdn-images-1.medium.com/max/1375/1*3GVl2YCIwXMRIfgM0CkiYA.png\",\"https://cdn-images-1.medium.com/max/1375/1*p4t7ufxrLydcEemHUeqMJw.png\",\"https://cdn-images-1.medium.com/max/1375/1*WwxZpPZ4BdfuQC7Sic0b7g.png\",\"https://cdn-images-1.medium.com/max/1375/1*mHhTX6OxKRLiQZDD8nbTkQ.png\",\"https://cdn-images-1.medium.com/max/1375/1*GdHIaKdywpT6drhMlWAr4A.png\"],\"links\":[\"https://bitcoinexchangeguide.com/serious-accumulation-on-litecoin-ltc-could-precede-a-major-boom-in-price/\",\"https://www.tradingview.com/x/SpRxsA0Y/\",\"https://www.tradingview.com/x/sbH27yne/\",\"https://www.tradingview.com/x/dve4hCj0/\",\"https://www.tradingview.com/x/ho6n3TgQ/\",\"https://www.tradingview.com/x/uGEhK0oF/\",\"https://www.tradingview.com/x/ejQdPluT/\",\"https://www.tradingview.com/x/e5UbEOx4/\",\"https://stockcharts.com/school/doku.php?id=chart_school:chart_analysis:chart_patterns:descending_triangle_continuation\"],\"app\":\"steemit/0.1\",\"format\":\"markdown\"}"
}
]
}proofofresearchreceived 0.028 SBD, 0.041 SP author reward for @proofofresearch / how-to-gain-value-from-my-price-analysis-articles-monero-example2018/10/02 07:12:00
proofofresearchreceived 0.028 SBD, 0.041 SP author reward for @proofofresearch / how-to-gain-value-from-my-price-analysis-articles-monero-example
2018/10/02 07:12:00
| author | proofofresearch |
| permlink | how-to-gain-value-from-my-price-analysis-articles-monero-example |
| sbd payout | 0.028 SBD |
| steem payout | 0.000 STEEM |
| vesting payout | 66.661646 VESTS |
| Transaction Info | Block #26448678/Virtual Operation #7 |
View Raw JSON Data
{
  "trx_id": "0000000000000000000000000000000000000000",
  "block": 26448678,
  "trx_in_block": 4294967295,
  "op_in_trx": 0,
  "virtual_op": 7,
  "timestamp": "2018-10-02T07:12:00",
  "op": [
    "author_reward",
    {
      "author": "proofofresearch",
      "permlink": "how-to-gain-value-from-my-price-analysis-articles-monero-example",
      "sbd_payout": "0.028 SBD",
      "steem_payout": "0.000 STEEM",
      "vesting_payout": "66.661646 VESTS"
    }
  ]
}proofofresearchreceived 0.042 SBD, 0.060 SP author reward for @proofofresearch / bitcoin-price-analysis-9-23-2018-potential-re-test-before-advance2018/09/30 06:28:39
proofofresearchreceived 0.042 SBD, 0.060 SP author reward for @proofofresearch / bitcoin-price-analysis-9-23-2018-potential-re-test-before-advance
2018/09/30 06:28:39
| author | proofofresearch |
| permlink | bitcoin-price-analysis-9-23-2018-potential-re-test-before-advance |
| sbd payout | 0.042 SBD |
| steem payout | 0.000 STEEM |
| vesting payout | 96.972962 VESTS |
| Transaction Info | Block #26390243/Virtual Operation #4 |
View Raw JSON Data
{
  "trx_id": "0000000000000000000000000000000000000000",
  "block": 26390243,
  "trx_in_block": 4294967295,
  "op_in_trx": 0,
  "virtual_op": 4,
  "timestamp": "2018-09-30T06:28:39",
  "op": [
    "author_reward",
    {
      "author": "proofofresearch",
      "permlink": "bitcoin-price-analysis-9-23-2018-potential-re-test-before-advance",
      "sbd_payout": "0.042 SBD",
      "steem_payout": "0.000 STEEM",
      "vesting_payout": "96.972962 VESTS"
    }
  ]
}proofofresearchfollowed @eosone2018/09/29 05:50:54
proofofresearchfollowed @eosone
2018/09/29 05:50:54
| required auths | [] |
| required posting auths | ["proofofresearch"] |
| id | follow |
| json | ["follow",{"follower":"proofofresearch","following":"eosone","what":["blog"]}] |
| Transaction Info | Block #26360727/Trx 8b4dc536d3b5c67a2687ea315f9a63ecac912cf2 |
View Raw JSON Data
{
  "trx_id": "8b4dc536d3b5c67a2687ea315f9a63ecac912cf2",
  "block": 26360727,
  "trx_in_block": 2,
  "op_in_trx": 0,
  "virtual_op": 0,
  "timestamp": "2018-09-29T05:50:54",
  "op": [
    "custom_json",
    {
      "required_auths": [],
      "required_posting_auths": [
        "proofofresearch"
      ],
      "id": "follow",
      "json": "[\"follow\",{\"follower\":\"proofofresearch\",\"following\":\"eosone\",\"what\":[\"blog\"]}]"
    }
  ]
}sensationupvoted (100.00%) @proofofresearch / usdxlm-looks-bearish-short-term-super-bullish-longer-term2018/09/25 10:54:42
sensationupvoted (100.00%) @proofofresearch / usdxlm-looks-bearish-short-term-super-bullish-longer-term
2018/09/25 10:54:42
| voter | sensation |
| author | proofofresearch |
| permlink | usdxlm-looks-bearish-short-term-super-bullish-longer-term |
| weight | 10000 (100.00%) |
| Transaction Info | Block #26251841/Trx b1137857e5326920de3cd85724a86d46ba0131c9 |
View Raw JSON Data
{
  "trx_id": "b1137857e5326920de3cd85724a86d46ba0131c9",
  "block": 26251841,
  "trx_in_block": 10,
  "op_in_trx": 0,
  "virtual_op": 0,
  "timestamp": "2018-09-25T10:54:42",
  "op": [
    "vote",
    {
      "voter": "sensation",
      "author": "proofofresearch",
      "permlink": "usdxlm-looks-bearish-short-term-super-bullish-longer-term",
      "weight": 10000
    }
  ]
}2018/09/25 10:01:06
2018/09/25 10:01:06
| parent author | proofofresearch |
| parent permlink | usdxlm-looks-bearish-short-term-super-bullish-longer-term |
| author | steemitboard |
| permlink | steemitboard-notify-proofofresearch-20180925t100108000z |
| title | |
| body | Congratulations @proofofresearch! You have completed the following achievement on the Steem blockchain and have been rewarded with new badge(s) : [](http://steemitboard.com/@proofofresearch) Award for the number of posts published <sub>_Click on the badge to view your Board of Honor._</sub> <sub>_If you no longer want to receive notifications, reply to this comment with the word_ `STOP`</sub> > Support [SteemitBoard's project](https://steemit.com/@steemitboard)! **[Vote for its witness](https://v2.steemconnect.com/sign/account-witness-vote?witness=steemitboard&approve=1)** and **get one more award**! |
| json metadata | {"image":["https://steemitboard.com/img/notify.png"]} |
| Transaction Info | Block #26250770/Trx ad7cf80bb39ebdbc7d9e87f40a70878b2356425d |
View Raw JSON Data
{
"trx_id": "ad7cf80bb39ebdbc7d9e87f40a70878b2356425d",
"block": 26250770,
"trx_in_block": 47,
"op_in_trx": 0,
"virtual_op": 0,
"timestamp": "2018-09-25T10:01:06",
"op": [
"comment",
{
"parent_author": "proofofresearch",
"parent_permlink": "usdxlm-looks-bearish-short-term-super-bullish-longer-term",
"author": "steemitboard",
"permlink": "steemitboard-notify-proofofresearch-20180925t100108000z",
"title": "",
"body": "Congratulations @proofofresearch! You have completed the following achievement on the Steem blockchain and have been rewarded with new badge(s) :\n\n[](http://steemitboard.com/@proofofresearch) Award for the number of posts published\n\n<sub>_Click on the badge to view your Board of Honor._</sub>\n<sub>_If you no longer want to receive notifications, reply to this comment with the word_ `STOP`</sub>\n\n\n\n> Support [SteemitBoard's project](https://steemit.com/@steemitboard)! **[Vote for its witness](https://v2.steemconnect.com/sign/account-witness-vote?witness=steemitboard&approve=1)** and **get one more award**!",
"json_metadata": "{\"image\":[\"https://steemitboard.com/img/notify.png\"]}"
}
]
}jcharlesupvoted (100.00%) @proofofresearch / usdxlm-looks-bearish-short-term-super-bullish-longer-term2018/09/25 09:45:27
jcharlesupvoted (100.00%) @proofofresearch / usdxlm-looks-bearish-short-term-super-bullish-longer-term
2018/09/25 09:45:27
| voter | jcharles |
| author | proofofresearch |
| permlink | usdxlm-looks-bearish-short-term-super-bullish-longer-term |
| weight | 10000 (100.00%) |
| Transaction Info | Block #26250457/Trx be8079c12df4aef886bdf4edfd798ab4339ce2a4 |
View Raw JSON Data
{
  "trx_id": "be8079c12df4aef886bdf4edfd798ab4339ce2a4",
  "block": 26250457,
  "trx_in_block": 25,
  "op_in_trx": 0,
  "virtual_op": 0,
  "timestamp": "2018-09-25T09:45:27",
  "op": [
    "vote",
    {
      "voter": "jcharles",
      "author": "proofofresearch",
      "permlink": "usdxlm-looks-bearish-short-term-super-bullish-longer-term",
      "weight": 10000
    }
  ]
}proofofresearchpublished a new post: usdxlm-looks-bearish-short-term-super-bullish-longer-term2018/09/25 09:45:00
proofofresearchpublished a new post: usdxlm-looks-bearish-short-term-super-bullish-longer-term
2018/09/25 09:45:00
| parent author | |
| parent permlink | bitcoin |
| author | proofofresearch |
| permlink | usdxlm-looks-bearish-short-term-super-bullish-longer-term |
| title | $XLM Looks Bearish Short-Term; Super Bullish Longer-Term |
| body | # $XLM Looks Bearish Short-Term; Super Bullish Longer-Term  As many may have noticed, the price of $XLM soared over the last few days. **_Fortunately, this was an event that was accurately predicted by the Zero_n0ncense brand (among dozens of others over the last few weeks and months):_** # Stellar Lumens Price Analysis  [https://www.tradingview.com/x/UzQnMejN/](https://www.tradingview.com/x/UzQnMejN/) In the picture above, you can spot the support points that were created by the Moving Fibs (custom) indicator script. **_The three support values that were identified by the moving fibs are:_** #1: 23.4 cents #2: 22.89 cents #3: 21.42 cents  [https://www.tradingview.com/x/w424dA3m/](https://www.tradingview.com/x/w424dA3m/) Above is another look at the major resistance point that the price of $XLM is currently nudging against. Now, when looking at the aforementioned two pictures that have been posted in this article, it stands to reason that one’s reaction would be: > “There’s good reason to be bullish on $XLM! It appears as though its primed for a bounce!” However, this may not be the case for a few reasons. # The Daily Chart Has Yet to Feel the “Pain” What this subtitle means (in a nutshell), is that most of the indicators on the daily chart for $XLM are still reading grossly overbought conditions. ## Ichimoku (Daily) For the Ichimoku truthers that still believe that the Ichimoku settings are ‘inaccurate’ for cryptocurrency, just know that you are **_dead wrong_**. We would link the article here, but that is currently only available to subscribers as well as those that have bought our TA bundle. [Don’t fret though, because that isn’t needed to get the maximum value possible out of this price analysis]  [https://www.tradingview.com/x/sNNp55kd/](https://www.tradingview.com/x/sNNp55kd/) **_In the chart above, there are a few things that are worthy of note:_**  [https://www.tradingview.com/x/6GbGynjV/](https://www.tradingview.com/x/6GbGynjV/) 1. The price has nearly broken south of both the conversion & base lines (bearish). 2. Bottom of the cloud is hanging at 22.7 cents and it appears as though the price is definitely headed to that point (at least) based on its current direction. 3. As you can see here, the price failed to break outside of the cloud for the Ichimoku. ## Exponential Moving Averages  [https://www.tradingview.com/x/aiyzHoU1/](https://www.tradingview.com/x/aiyzHoU1/) We’ve noted this in countless price analysis studies in the past, but the EMA-50 tends to be one of the more reliable points of support and resistance; this is especially true when looking at the daily chart resolution. Currently, as delineated by the chart posted above, we can see that the point of support for the EMA-50 is at .2259 cents. Should the price break below there, it could be bad news for bulls (**_hardy har, not the bad news bears this time_**). ## EMA Mean Reversion (Custom Indicator)  [https://www.tradingview.com/x/wRcDH6mS/](https://www.tradingview.com/x/wRcDH6mS/) **_As the chart above states:_** The area within the box is showing us that the vallues of the EMA indicators used in the mean regression were converging before there was a reversal in price. Therefore, traders should be on the lookout for an expansion at this point because that would signal a strengthening in the negative trend. ## EMA Mean Reversion Used in Favor of the MACD This was used in favor of the traditional MACD (Moving Average Convergence Divergence) indicator because the custom mean reversion indicator that we created is designed to be more reactive to the price than the MACD. Currently, the MACD is showing us no viable signals. # Potential Completion of the Super Long Bull Pennant That’s Been Forming on $XLM **_For those that are not aware of what a bull pennant is, allow us to show you below:_**    You more than likely get the gist of how a pennant works by now from the above pictures. **_Basically it is:_** 1. A chart formation that is in the shape of a pennant. 2. It occurs over a decent amount of time (usually a few weeks, but could be longer). 3. It is typically a **_continuation pattern_** (if it completes). So, it can either be bullish or bearish contingent upon the prior price direction. **_Now, take a look at a scrolled out view of the Stellar price chart:_**  [https://www.tradingview.com/x/EfWgy0Pg/](https://www.tradingview.com/x/EfWgy0Pg/) From the picture above, there should be a few things that are now apparently obvious: 1. There is a massive bull pennant on the daily (and weekly) chart for $XLM. 2. Given the fact that the bull pennant is so massive, the potential gains that could be amassed from this trade are absolutely ridiculous (in the long-term). 3. It appears that there will be no breakout yet at this point in time because the price failed to break north of the diagonal downtrend resistance (series of lower highs that we saw above). Thus, the price is more than likely headed down to test the series of higher lows. Here’s a better, up-close view of what’s going on and why we’re bearish in the **_short-term_**:  [https://www.tradingview.com/x/OlNFcKoJ/](https://www.tradingview.com/x/OlNFcKoJ/)  [https://www.tradingview.com/x/sbqQ5fKU/](https://www.tradingview.com/x/sbqQ5fKU/) The above picture summarizes what we predict will more than likely occur with the price action. # Conclusion This price analysis epitomizes what our beliefs are in terms of $XLM’s price action in the near and distant futures. **_We believe that in the short term:_** $XLM will exhibit bearish price action. We don’t expect that the price will exceed the previous highs that it was at. **_We believe that in the long-term:_** $XLM will prove to break out of the pennant that is is currently in a northward direction, proving to be one of the more promising options. |
| json metadata | {"tags":["bitcoin","crypto","cryptocurrency","priceanalysis","technicalanalysis"],"image":["https://cdn-images-1.medium.com/max/1250/1*pxI6EkujXHTEIeFnjiu2dw.gif","https://cdn-images-1.medium.com/max/1563/1*oCa5Gq4M4l-en_lmaveqJg.png","https://cdn-images-1.medium.com/max/1563/1*U88Ip6VRtb1Q6w1OBq70GA.png","https://cdn-images-1.medium.com/max/1563/1*9l7rK_1yR5NRjPKElQf6SQ.png","https://cdn-images-1.medium.com/max/1563/1*yTuOSoeJJcbyWWAfGIbsYw.png","https://cdn-images-1.medium.com/max/1563/1*mL_vzjYMSgiC50mgskJOgw.png","https://cdn-images-1.medium.com/max/1563/1*uIVsQmyI2DjlR5X6pTmDeA.png","https://cdn-images-1.medium.com/max/1250/0*PDLDy2qhyjT9-tt0.jpg","https://cdn-images-1.medium.com/max/1250/0*0vtc9SYOuLa4uFfy.png","https://cdn-images-1.medium.com/max/1250/0*3qhWJErT4cs-YTyJ.png","https://cdn-images-1.medium.com/max/1563/1*A4bDxDMFVGRXFV3JsSZZRA.png","https://cdn-images-1.medium.com/max/1563/1*Opxspm3Z8Dx3Rr9BkqNWYA.png","https://cdn-images-1.medium.com/max/1563/1*16llyo8arQkeA3oG40kqZQ.png"],"links":["https://www.tradingview.com/x/UzQnMejN/","https://www.tradingview.com/x/w424dA3m/","https://www.tradingview.com/x/sNNp55kd/","https://www.tradingview.com/x/6GbGynjV/","https://www.tradingview.com/x/aiyzHoU1/","https://www.tradingview.com/x/wRcDH6mS/","https://www.tradingview.com/x/EfWgy0Pg/","https://www.tradingview.com/x/OlNFcKoJ/","https://www.tradingview.com/x/sbqQ5fKU/"],"app":"steemit/0.1","format":"markdown"} |
| Transaction Info | Block #26250448/Trx 78bd5253684e016f36c28f764a1d67aadc2b9b1b |
View Raw JSON Data
{
"trx_id": "78bd5253684e016f36c28f764a1d67aadc2b9b1b",
"block": 26250448,
"trx_in_block": 37,
"op_in_trx": 0,
"virtual_op": 0,
"timestamp": "2018-09-25T09:45:00",
"op": [
"comment",
{
"parent_author": "",
"parent_permlink": "bitcoin",
"author": "proofofresearch",
"permlink": "usdxlm-looks-bearish-short-term-super-bullish-longer-term",
"title": "$XLM Looks Bearish Short-Term; Super Bullish Longer-Term",
"body": "# $XLM Looks Bearish Short-Term; Super Bullish Longer-Term\n\n\n\nAs many may have noticed, the price of $XLM soared over the last few days.\n\n**_Fortunately, this was an event that was accurately predicted by the Zero_n0ncense brand (among dozens of others over the last few weeks and months):_**\n\n# Stellar Lumens Price Analysis\n\n\n\n[https://www.tradingview.com/x/UzQnMejN/](https://www.tradingview.com/x/UzQnMejN/)\n\nIn the picture above, you can spot the support points that were created by the Moving Fibs (custom) indicator script.\n\n**_The three support values that were identified by the moving fibs are:_**\n\n#1: 23.4 cents\n\n#2: 22.89 cents\n\n#3: 21.42 cents\n\n\n\n[https://www.tradingview.com/x/w424dA3m/](https://www.tradingview.com/x/w424dA3m/)\n\nAbove is another look at the major resistance point that the price of $XLM is currently nudging against.\n\nNow, when looking at the aforementioned two pictures that have been posted in this article, it stands to reason that one’s reaction would be:\n\n> “There’s good reason to be bullish on $XLM! It appears as though its primed for a bounce!”\n\nHowever, this may not be the case for a few reasons.\n\n# The Daily Chart Has Yet to Feel the “Pain”\n\nWhat this subtitle means (in a nutshell), is that most of the indicators on the daily chart for $XLM are still reading grossly overbought conditions.\n\n## Ichimoku (Daily)\n\nFor the Ichimoku truthers that still believe that the Ichimoku settings are ‘inaccurate’ for cryptocurrency, just know that you are **_dead wrong_**.\n\nWe would link the article here, but that is currently only available to subscribers as well as those that have bought our TA bundle.\n\n[Don’t fret though, because that isn’t needed to get the maximum value possible out of this price analysis]\n\n\n\n[https://www.tradingview.com/x/sNNp55kd/](https://www.tradingview.com/x/sNNp55kd/)\n\n**_In the chart above, there are a few things that are worthy of note:_**\n\n\n\n[https://www.tradingview.com/x/6GbGynjV/](https://www.tradingview.com/x/6GbGynjV/)\n\n1. The price has nearly broken south of both the conversion & base lines (bearish).\n2. Bottom of the cloud is hanging at 22.7 cents and it appears as though the price is definitely headed to that point (at least) based on its current direction.\n3. As you can see here, the price failed to break outside of the cloud for the Ichimoku.\n\n## Exponential Moving Averages\n\n\n\n[https://www.tradingview.com/x/aiyzHoU1/](https://www.tradingview.com/x/aiyzHoU1/)\n\nWe’ve noted this in countless price analysis studies in the past, but the EMA-50 tends to be one of the more reliable points of support and resistance; this is especially true when looking at the daily chart resolution.\n\nCurrently, as delineated by the chart posted above, we can see that the point of support for the EMA-50 is at .2259 cents.\n\nShould the price break below there, it could be bad news for bulls (**_hardy har, not the bad news bears this time_**).\n\n## EMA Mean Reversion (Custom Indicator)\n\n\n\n[https://www.tradingview.com/x/wRcDH6mS/](https://www.tradingview.com/x/wRcDH6mS/)\n\n**_As the chart above states:_**\n\nThe area within the box is showing us that the vallues of the EMA indicators used in the mean regression were converging before there was a reversal in price.\n\nTherefore, traders should be on the lookout for an expansion at this point because that would signal a strengthening in the negative trend.\n\n## EMA Mean Reversion Used in Favor of the MACD\n\nThis was used in favor of the traditional MACD (Moving Average Convergence Divergence) indicator because the custom mean reversion indicator that we created is designed to be more reactive to the price than the MACD.\n\nCurrently, the MACD is showing us no viable signals.\n\n# Potential Completion of the Super Long Bull Pennant That’s Been Forming on $XLM\n\n**_For those that are not aware of what a bull pennant is, allow us to show you below:_**\n\n\n\n\n\n\n\nYou more than likely get the gist of how a pennant works by now from the above pictures.\n\n**_Basically it is:_**\n\n1. A chart formation that is in the shape of a pennant.\n2. It occurs over a decent amount of time (usually a few weeks, but could be longer).\n3. It is typically a **_continuation pattern_** (if it completes). So, it can either be bullish or bearish contingent upon the prior price direction.\n\n**_Now, take a look at a scrolled out view of the Stellar price chart:_**\n\n\n\n[https://www.tradingview.com/x/EfWgy0Pg/](https://www.tradingview.com/x/EfWgy0Pg/)\n\nFrom the picture above, there should be a few things that are now apparently obvious:\n\n1. There is a massive bull pennant on the daily (and weekly) chart for $XLM.\n2. Given the fact that the bull pennant is so massive, the potential gains that could be amassed from this trade are absolutely ridiculous (in the long-term).\n3. It appears that there will be no breakout yet at this point in time because the price failed to break north of the diagonal downtrend resistance (series of lower highs that we saw above). Thus, the price is more than likely headed down to test the series of higher lows.\n\nHere’s a better, up-close view of what’s going on and why we’re bearish in the **_short-term_**:\n\n\n\n[https://www.tradingview.com/x/OlNFcKoJ/](https://www.tradingview.com/x/OlNFcKoJ/)\n\n\n\n[https://www.tradingview.com/x/sbqQ5fKU/](https://www.tradingview.com/x/sbqQ5fKU/)\n\nThe above picture summarizes what we predict will more than likely occur with the price action.\n\n# Conclusion\n\nThis price analysis epitomizes what our beliefs are in terms of $XLM’s price action in the near and distant futures.\n\n**_We believe that in the short term:_**\n\n$XLM will exhibit bearish price action. We don’t expect that the price will exceed the previous highs that it was at.\n\n**_We believe that in the long-term:_**\n\n$XLM will prove to break out of the pennant that is is currently in a northward direction, proving to be one of the more promising options.",
"json_metadata": "{\"tags\":[\"bitcoin\",\"crypto\",\"cryptocurrency\",\"priceanalysis\",\"technicalanalysis\"],\"image\":[\"https://cdn-images-1.medium.com/max/1250/1*pxI6EkujXHTEIeFnjiu2dw.gif\",\"https://cdn-images-1.medium.com/max/1563/1*oCa5Gq4M4l-en_lmaveqJg.png\",\"https://cdn-images-1.medium.com/max/1563/1*U88Ip6VRtb1Q6w1OBq70GA.png\",\"https://cdn-images-1.medium.com/max/1563/1*9l7rK_1yR5NRjPKElQf6SQ.png\",\"https://cdn-images-1.medium.com/max/1563/1*yTuOSoeJJcbyWWAfGIbsYw.png\",\"https://cdn-images-1.medium.com/max/1563/1*mL_vzjYMSgiC50mgskJOgw.png\",\"https://cdn-images-1.medium.com/max/1563/1*uIVsQmyI2DjlR5X6pTmDeA.png\",\"https://cdn-images-1.medium.com/max/1250/0*PDLDy2qhyjT9-tt0.jpg\",\"https://cdn-images-1.medium.com/max/1250/0*0vtc9SYOuLa4uFfy.png\",\"https://cdn-images-1.medium.com/max/1250/0*3qhWJErT4cs-YTyJ.png\",\"https://cdn-images-1.medium.com/max/1563/1*A4bDxDMFVGRXFV3JsSZZRA.png\",\"https://cdn-images-1.medium.com/max/1563/1*Opxspm3Z8Dx3Rr9BkqNWYA.png\",\"https://cdn-images-1.medium.com/max/1563/1*16llyo8arQkeA3oG40kqZQ.png\"],\"links\":[\"https://www.tradingview.com/x/UzQnMejN/\",\"https://www.tradingview.com/x/w424dA3m/\",\"https://www.tradingview.com/x/sNNp55kd/\",\"https://www.tradingview.com/x/6GbGynjV/\",\"https://www.tradingview.com/x/aiyzHoU1/\",\"https://www.tradingview.com/x/wRcDH6mS/\",\"https://www.tradingview.com/x/EfWgy0Pg/\",\"https://www.tradingview.com/x/OlNFcKoJ/\",\"https://www.tradingview.com/x/sbqQ5fKU/\"],\"app\":\"steemit/0.1\",\"format\":\"markdown\"}"
}
]
}2018/09/25 07:52:48
2018/09/25 07:52:48
| voter | mrakodrap |
| author | proofofresearch |
| permlink | vitalik-buterin-s-new-scaling-suggestion-warrants-more-credit-than-its-received |
| weight | 1000 (10.00%) |
| Transaction Info | Block #26248205/Trx 9b3009ccf5e1e97d78423b60eef3a1cfac4c716f |
View Raw JSON Data
{
  "trx_id": "9b3009ccf5e1e97d78423b60eef3a1cfac4c716f",
  "block": 26248205,
  "trx_in_block": 4,
  "op_in_trx": 0,
  "virtual_op": 0,
  "timestamp": "2018-09-25T07:52:48",
  "op": [
    "vote",
    {
      "voter": "mrakodrap",
      "author": "proofofresearch",
      "permlink": "vitalik-buterin-s-new-scaling-suggestion-warrants-more-credit-than-its-received",
      "weight": 1000
    }
  ]
}2018/09/25 07:51:51
2018/09/25 07:51:51
| voter | restbot |
| author | proofofresearch |
| permlink | vitalik-buterin-s-new-scaling-suggestion-warrants-more-credit-than-its-received |
| weight | 1000 (10.00%) |
| Transaction Info | Block #26248186/Trx c6c19075696f1d6a677167beafc5e63fd9d40bf7 |
View Raw JSON Data
{
  "trx_id": "c6c19075696f1d6a677167beafc5e63fd9d40bf7",
  "block": 26248186,
  "trx_in_block": 31,
  "op_in_trx": 0,
  "virtual_op": 0,
  "timestamp": "2018-09-25T07:51:51",
  "op": [
    "vote",
    {
      "voter": "restbot",
      "author": "proofofresearch",
      "permlink": "vitalik-buterin-s-new-scaling-suggestion-warrants-more-credit-than-its-received",
      "weight": 1000
    }
  ]
}2018/09/25 07:41:54
2018/09/25 07:41:54
| voter | hr1 |
| author | proofofresearch |
| permlink | how-to-gain-value-from-my-price-analysis-articles-monero-example |
| weight | 2 (0.02%) |
| Transaction Info | Block #26247987/Trx 743ff09d0b326da20e261eee4efce99034e4185e |
View Raw JSON Data
{
  "trx_id": "743ff09d0b326da20e261eee4efce99034e4185e",
  "block": 26247987,
  "trx_in_block": 1,
  "op_in_trx": 0,
  "virtual_op": 0,
  "timestamp": "2018-09-25T07:41:54",
  "op": [
    "vote",
    {
      "voter": "hr1",
      "author": "proofofresearch",
      "permlink": "how-to-gain-value-from-my-price-analysis-articles-monero-example",
      "weight": 2
    }
  ]
}2018/09/25 07:32:03
2018/09/25 07:32:03
| voter | magpielover |
| author | proofofresearch |
| permlink | vitalik-buterin-s-new-scaling-suggestion-warrants-more-credit-than-its-received |
| weight | 10000 (100.00%) |
| Transaction Info | Block #26247790/Trx 8fa8fb5534a76fe3126c23bc10833e17ea23ad8d |
View Raw JSON Data
{
  "trx_id": "8fa8fb5534a76fe3126c23bc10833e17ea23ad8d",
  "block": 26247790,
  "trx_in_block": 12,
  "op_in_trx": 0,
  "virtual_op": 0,
  "timestamp": "2018-09-25T07:32:03",
  "op": [
    "vote",
    {
      "voter": "magpielover",
      "author": "proofofresearch",
      "permlink": "vitalik-buterin-s-new-scaling-suggestion-warrants-more-credit-than-its-received",
      "weight": 10000
    }
  ]
}proofofresearchpublished a new post: how-to-gain-value-from-my-price-analysis-articles-monero-example2018/09/25 07:12:00
proofofresearchpublished a new post: how-to-gain-value-from-my-price-analysis-articles-monero-example
2018/09/25 07:12:00
| parent author | |
| parent permlink | bitcoin |
| author | proofofresearch |
| permlink | how-to-gain-value-from-my-price-analysis-articles-monero-example |
| title | How to Gain Value From my Price Analysis Articles (Monero Example) |
| body | # How to Gain Value From my Price Analysis Articles (Monero Example)  # Introduction This Monero price analysis is a really good example of why I think the price analysis articles that I put up are worth reading: [https://www.tradingview.com/chart/XMRUSD/xeuy8OUz-Monero-Price-Analysis-Feast-or-Famine-Version/](https://tradingview.com/chart/XMRUSD/xeuy8OUz-Monero-Price-Analysis-Feast-or-Famine-Version) This article isn’t just about being right, it’s about strategizing your entries and exits when you take positions in coins. # “What Do You Mean?” I’ll explain. 1. In the article, I showed the trendline that you see in the default picture for the post. 2. My default position on here was that you should not enter in a position just yet and that this was a trade that needed to be monitored. There are some trades that are like that. Sometimes it’s best to wait for some more price action to play out in a trade before pulling the trigger on it. This can save you a lot in terms of avoiding unnecessary losses or buying a bag that ties up your funds for a longer period of time than what you want. 3. The strategy for the Monero price analysis was to **wait until the price broke below the trendline. If that did happen, you begin to take out a mean short. Of course, you have to plot for yourself, when you should exit the short (I’m not that clairvoyant). 4. I also recommended that you place a long position if the price exceeded $108 (to be super safe about it), because I knew that the price busting past that point would mean that there were probably a decent amount of gains to still be had. 5. I pointed out the uptrend in the RSI (higher lows), to show that there was an overall bias toward bullishness in the not-so-distant future. However, I was also careful to mention that this chart is on the 2H time frame, so the ‘not-so-distant future’ did not mean in a week or two. I believe that this was also included in there. For all of the reasons that were stated above, I did not advocate for a certain position to be taken on this coin, but rather for you to wait and play it out whether it broke above or below. # Trading on Trendlines I’m never really a fan of trading directly on a trendline unless there are some other super taletell signs like what we saw with Bitcoin when it had an exhausted RSI and the price was nudging against the resistance point for a while. [https://www.tradingview.com/x/YyUuDXjC](https://tradingview.com/x/YyUuDXjC) Looking at this photo, you could tell that the price of Bitcoin was going to turn down because the RSI was beginning to wane as the price continuously traded against the $7.5k resistance, unsuccessfully breaking it. Another major clue was not wicks breaking up to the north. # Bitcoin Example 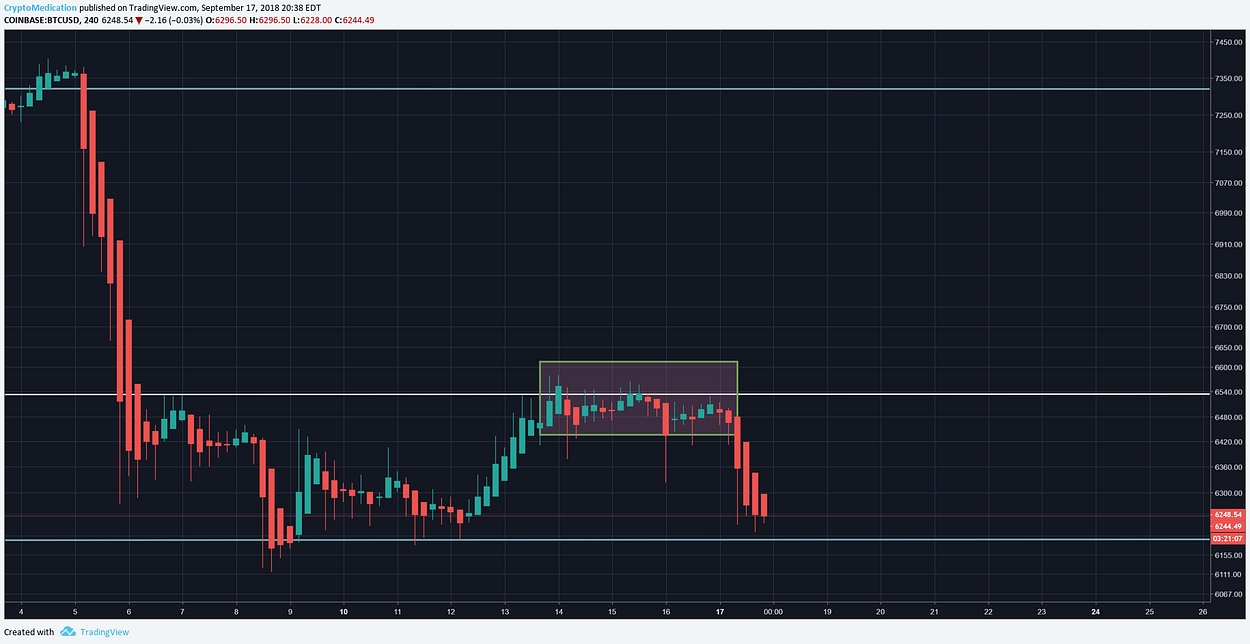 Whenever you see something like this on a chart and you’re wondering to yourself, > Will the price break upward or downward? A telltale sign can be found in the wick formations. As you can see in the picture, there were barely any wicks that really broke above that $6.5k point. However, there were a lot of long wicks sticking out of the bottom. That shows bear pressure. This + exhausted RSI on the lower TFs is what caused me to say the price is going down . I predicted that it would most likely just hit the $6.2k point because the RSI on the daily chart wasn’t grossly overbought or anything. It’s been making its way with some good momentum if you check it out (RSI(14)). However, the lower TFs (H4 and below), were overbought. So, it seemed like the price needed to ‘cool off’ for a bit before making its way back up. Even despite being right on that call, I probably would have said that a responsible trader shouldn’t have taken a position on that play unless you’re naturally that aggressive. The reason why I say this is because $6.5k-$6.2k = $300; $300/$6.5k = +4.6%. So, the maximum upside of (my predicted) move (before it happened) was +4.6%. Given Bitcoin’s volatility and semi-unpredictability to move upward at random and in one fell swoop / volatile move, there’s a chance that placing a tight S/L won’t be sufficient because the price will move up too quickly and you’ll just simply be stuck with a $6.5k bag if the price were to raise suddenly (hypothetically). # Conclusion I’m just a risk averse individual, and that’s the type of trading that I advocate — especially in these volatile markets. Protect yourself, hedge yourself, and be humble about the gains you’re trying to get in this market and the market will treat you well. |
| json metadata | {"tags":["bitcoin","crypto","cryptocurrency","priceanalysis","technicalanalysis"],"image":["https://cdn-images-1.medium.com/max/1250/1*Zssm1PmIxEEKUnLe0ud0ig.gif","https://cdn-images-1.medium.com/max/1250/0*AFdjE28ao-xtoYxQ"],"links":["https://tradingview.com/chart/XMRUSD/xeuy8OUz-Monero-Price-Analysis-Feast-or-Famine-Version","https://tradingview.com/x/YyUuDXjC"],"app":"steemit/0.1","format":"markdown"} |
| Transaction Info | Block #26247389/Trx d0cc235d10b3ad74c08541cef71c8284c5c217bc |
View Raw JSON Data
{
"trx_id": "d0cc235d10b3ad74c08541cef71c8284c5c217bc",
"block": 26247389,
"trx_in_block": 61,
"op_in_trx": 0,
"virtual_op": 0,
"timestamp": "2018-09-25T07:12:00",
"op": [
"comment",
{
"parent_author": "",
"parent_permlink": "bitcoin",
"author": "proofofresearch",
"permlink": "how-to-gain-value-from-my-price-analysis-articles-monero-example",
"title": "How to Gain Value From my Price Analysis Articles (Monero Example)",
"body": "# How to Gain Value From my Price Analysis Articles (Monero Example)\n\n\n\n# Introduction\n\nThis Monero price analysis is a really good example of why I think the price analysis articles that I put up are worth reading:\n\n[https://www.tradingview.com/chart/XMRUSD/xeuy8OUz-Monero-Price-Analysis-Feast-or-Famine-Version/](https://tradingview.com/chart/XMRUSD/xeuy8OUz-Monero-Price-Analysis-Feast-or-Famine-Version)\n\nThis article isn’t just about being right, it’s about strategizing your entries and exits when you take positions in coins.\n\n# “What Do You Mean?”\n\nI’ll explain.\n\n1. In the article, I showed the trendline that you see in the default picture for the post.\n\n2. My default position on here was that you should not enter in a position just yet and that this was a trade that needed to be monitored. There are some trades that are like that. Sometimes it’s best to wait for some more price action to play out in a trade before pulling the trigger on it. This can save you a lot in terms of avoiding unnecessary losses or buying a bag that ties up your funds for a longer period of time than what you want.\n\n3. The strategy for the Monero price analysis was to **wait until the price broke below the trendline. If that did happen, you begin to take out a mean short. Of course, you have to plot for yourself, when you should exit the short (I’m not that clairvoyant).\n\n4. I also recommended that you place a long position if the price exceeded $108 (to be super safe about it), because I knew that the price busting past that point would mean that there were probably a decent amount of gains to still be had.\n\n5. I pointed out the uptrend in the RSI (higher lows), to show that there was an overall bias toward bullishness in the not-so-distant future. However, I was also careful to mention that this chart is on the 2H time frame, so the ‘not-so-distant future’ did not mean in a week or two. I believe that this was also included in there.\n\nFor all of the reasons that were stated above, I did not advocate for a certain position to be taken on this coin, but rather for you to wait and play it out whether it broke above or below.\n\n# Trading on Trendlines\n\nI’m never really a fan of trading directly on a trendline unless there are some other super taletell signs like what we saw with Bitcoin when it had an exhausted RSI and the price was nudging against the resistance point for a while.\n\n[https://www.tradingview.com/x/YyUuDXjC](https://tradingview.com/x/YyUuDXjC)\n\nLooking at this photo, you could tell that the price of Bitcoin was going to turn down because the RSI was beginning to wane as the price continuously traded against the $7.5k resistance, unsuccessfully breaking it.\n\nAnother major clue was not wicks breaking up to the north.\n\n# Bitcoin Example\n\n\n\nWhenever you see something like this on a chart and you’re wondering to yourself,\n\n> Will the price break upward or downward?\n\nA telltale sign can be found in the wick formations.\n\nAs you can see in the picture, there were barely any wicks that really broke above that $6.5k point.\n\nHowever, there were a lot of long wicks sticking out of the bottom. That shows bear pressure.\n\nThis + exhausted RSI on the lower TFs is what caused me to say the price is going down .\n\nI predicted that it would most likely just hit the $6.2k point because the RSI on the daily chart wasn’t grossly overbought or anything. It’s been making its way with some good momentum if you check it out (RSI(14)).\n\nHowever, the lower TFs (H4 and below), were overbought. So, it seemed like the price needed to ‘cool off’ for a bit before making its way back up.\n\nEven despite being right on that call, I probably would have said that a responsible trader shouldn’t have taken a position on that play unless you’re naturally that aggressive.\n\nThe reason why I say this is because $6.5k-$6.2k = $300; $300/$6.5k = +4.6%.\n\nSo, the maximum upside of (my predicted) move (before it happened) was +4.6%. Given Bitcoin’s volatility and semi-unpredictability to move upward at random and in one fell swoop / volatile move, there’s a chance that placing a tight S/L won’t be sufficient because the price will move up too quickly and you’ll just simply be stuck with a $6.5k bag if the price were to raise suddenly (hypothetically).\n\n# Conclusion\n\nI’m just a risk averse individual, and that’s the type of trading that I advocate — especially in these volatile markets.\n\nProtect yourself, hedge yourself, and be humble about the gains you’re trying to get in this market and the market will treat you well.",
"json_metadata": "{\"tags\":[\"bitcoin\",\"crypto\",\"cryptocurrency\",\"priceanalysis\",\"technicalanalysis\"],\"image\":[\"https://cdn-images-1.medium.com/max/1250/1*Zssm1PmIxEEKUnLe0ud0ig.gif\",\"https://cdn-images-1.medium.com/max/1250/0*AFdjE28ao-xtoYxQ\"],\"links\":[\"https://tradingview.com/chart/XMRUSD/xeuy8OUz-Monero-Price-Analysis-Feast-or-Famine-Version\",\"https://tradingview.com/x/YyUuDXjC\"],\"app\":\"steemit/0.1\",\"format\":\"markdown\"}"
}
]
}allazsent 0.001 SBD to @proofofresearch- "Promote your post. Your post will be min 10 resteemed with over 13000 followers , min 25 Upvote Different account. Your post will be more popular and you will find new friends. Send 0.5 SBD or STEE..."2018/09/25 07:04:45
allazsent 0.001 SBD to @proofofresearch- "Promote your post. Your post will be min 10 resteemed with over 13000 followers , min 25 Upvote Different account. Your post will be more popular and you will find new friends. Send 0.5 SBD or STEE..."
2018/09/25 07:04:45
| from | allaz |
| to | proofofresearch |
| amount | 0.001 SBD |
| memo | Promote your post. Your post will be min 10 resteemed with over 13000 followers , min 25 Upvote Different account. Your post will be more popular and you will find new friends. Send 0.5 SBD or STEEM to @allaz ( URL as memo ) Service Active |
| Transaction Info | Block #26247244/Trx 652094013d270ea4a486a0a6b94f3b635ae302dd |
View Raw JSON Data
{
  "trx_id": "652094013d270ea4a486a0a6b94f3b635ae302dd",
  "block": 26247244,
  "trx_in_block": 13,
  "op_in_trx": 0,
  "virtual_op": 0,
  "timestamp": "2018-09-25T07:04:45",
  "op": [
    "transfer",
    {
      "from": "allaz",
      "to": "proofofresearch",
      "amount": "0.001 SBD",
      "memo": "Promote your post. Your post will be min 10  resteemed with over 13000  followers , min 25  Upvote Different account. Your post will be more popular and you will find new friends. Send 0.5 SBD or STEEM to @allaz ( URL as memo ) Service Active"
    }
  ]
}2018/09/25 06:59:39
2018/09/25 06:59:39
| parent author | |
| parent permlink | bitcoin |
| author | proofofresearch |
| permlink | vitalik-buterin-s-new-scaling-suggestion-warrants-more-credit-than-its-received |
| title | Vitalik Buterin’s New Scaling Suggestion Warrants More Credit Than its Received |
| body | # Vitalik Buterin’s New Scaling Suggestion Warrants More Credit Than its Received  # Introduction For those that don’t know, there was news that dropped recently about a suggestion that Vitalik was considering entertaining in the near future. **_The article can be found here:_** [**Vitalik: Ethereum (ETH) Can Scale to 500 tps Using ZCash's ZK-SNARKs - Ethereum World News** _The ability for the Ethereum (ETH) network to scale and provide a greater throughput than the current 15 - 25…_ethereumworldnews.com](https://ethereumworldnews.com/vitalik-ethereum-eth-can-scale-to-500-tps-using-zcashs-zk-snarks "https://ethereumworldnews.com/vitalik-ethereum-eth-can-scale-to-500-tps-using-zcashs-zk-snarks")[](https://ethereumworldnews.com/vitalik-ethereum-eth-can-scale-to-500-tps-using-zcashs-zk-snarks) # Perhaps This Isn’t Such a Bad Idea This + sharding is something that would actually help blockchains scale in a decentralized manner. It’s still hard to do when we’re talking about actually conferring value (financial; monetary/fiduciary TX) on a blockchain. # Potential Complications Given the size of the blockchain, sharding would be necessitated to some extent (it seems). But what makes that a little bit more difficult on blockchain is the fact that that its not structured like a regular database. So, ‘sharding’ the data is much easier said than done. It also has broad implications for the settlement of TX that still are yet to be addressed. In theory, its plausible. Zero knowledge proofs are the final step to the equation though in making that happen. You need some sort of way to lower the load/per node on the network so that sharding the data isn’t a complex thing. The implementation of those two solutions poses a light at the end of the tunnel for blockchain scalability. Not sure if there’s enough time for Ethereum to implement this suggestion, but at least Vitalik is finally thinking. If you feel like being a super nerd today, check out this GitHub page. Really informative and really helps with the understanding of P2P, decentralized technology that runs entirely on its on using the concept of sharding. [https://xorro-p2p.github.io/](https://xorro-p2p.github.io/) Now, this is with a regular database, so its not blockchain — but it at least presents a model for how this could be accomplished # What Makes Scaling a Blockchain so Difficult 1) Blockchains can’t be queried in the same way that a database can. 2) The propagation of blocks is going to take ‘X’ amount of time no matter what, and it will always be a barrier to scaling. Sharding is a bit more complex in a blockchain setup because of #1. Technically, nodes would need to have access to all transactions all the time (remember DLT; distributed ledger technology). **_So, the only way around that would be…_** 3) ZK proofs. If you can prove the validity of the TX, then downloading the entire blockchain is no longer a necessary aspect of running it. However, blocks must be stored in some fashion, or at least accessible, demonstrable or proven. If not, then it no longer becomes a historical ledger of TX. Now, that’s not a problem if that’s what a network is going for — but if you value those records being kept and would like to refer to them later (i.e., if there is some sort of dispute between a buyer and a vendor), then this is a hell of a compromise to make. Which brings everything back to square one, once more. |
| json metadata | {"tags":["bitcoin","crypto","cryptocurrency","priceanalysis","technicalanalysis"],"image":["https://cdn-images-1.medium.com/max/1250/1*UQ6T9OjOTaZgffPXGGVchg.png"],"links":["https://ethereumworldnews.com/vitalik-ethereum-eth-can-scale-to-500-tps-using-zcashs-zk-snarks","https://xorro-p2p.github.io/"],"app":"steemit/0.1","format":"markdown"} |
| Transaction Info | Block #26247142/Trx 6d815b079f2a5568ea0fd4ca8495f6f44755b915 |
View Raw JSON Data
{
"trx_id": "6d815b079f2a5568ea0fd4ca8495f6f44755b915",
"block": 26247142,
"trx_in_block": 44,
"op_in_trx": 0,
"virtual_op": 0,
"timestamp": "2018-09-25T06:59:39",
"op": [
"comment",
{
"parent_author": "",
"parent_permlink": "bitcoin",
"author": "proofofresearch",
"permlink": "vitalik-buterin-s-new-scaling-suggestion-warrants-more-credit-than-its-received",
"title": "Vitalik Buterin’s New Scaling Suggestion Warrants More Credit Than its Received",
"body": "# Vitalik Buterin’s New Scaling Suggestion Warrants More Credit Than its Received\n\n\n\n# Introduction\n\nFor those that don’t know, there was news that dropped recently about a suggestion that Vitalik was considering entertaining in the near future.\n\n**_The article can be found here:_**\n\n[**Vitalik: Ethereum (ETH) Can Scale to 500 tps Using ZCash's ZK-SNARKs - Ethereum World News** \n_The ability for the Ethereum (ETH) network to scale and provide a greater throughput than the current 15 - 25…_ethereumworldnews.com](https://ethereumworldnews.com/vitalik-ethereum-eth-can-scale-to-500-tps-using-zcashs-zk-snarks \"https://ethereumworldnews.com/vitalik-ethereum-eth-can-scale-to-500-tps-using-zcashs-zk-snarks\")[](https://ethereumworldnews.com/vitalik-ethereum-eth-can-scale-to-500-tps-using-zcashs-zk-snarks)\n\n# Perhaps This Isn’t Such a Bad Idea\n\nThis + sharding is something that would actually help blockchains scale in a decentralized manner.\n\nIt’s still hard to do when we’re talking about actually conferring value (financial; monetary/fiduciary TX) on a blockchain.\n\n# Potential Complications\n\nGiven the size of the blockchain, sharding would be necessitated to some extent (it seems). But what makes that a little bit more difficult on blockchain is the fact that that its not structured like a regular database. So, ‘sharding’ the data is much easier said than done.\n\nIt also has broad implications for the settlement of TX that still are yet to be addressed. In theory, its plausible. Zero knowledge proofs are the final step to the equation though in making that happen. You need some sort of way to lower the load/per node on the network so that sharding the data isn’t a complex thing.\n\nThe implementation of those two solutions poses a light at the end of the tunnel for blockchain scalability. Not sure if there’s enough time for Ethereum to implement this suggestion, but at least Vitalik is finally thinking.\n\nIf you feel like being a super nerd today, check out this GitHub page. Really informative and really helps with the understanding of P2P, decentralized technology that runs entirely on its on using the concept of sharding.\n\n[https://xorro-p2p.github.io/](https://xorro-p2p.github.io/)\n\nNow, this is with a regular database, so its not blockchain — but it at least presents a model for how this could be accomplished\n\n# What Makes Scaling a Blockchain so Difficult\n\n1) Blockchains can’t be queried in the same way that a database can.\n\n2) The propagation of blocks is going to take ‘X’ amount of time no matter what, and it will always be a barrier to scaling. Sharding is a bit more complex in a blockchain setup because of #1. Technically, nodes would need to have access to all transactions all the time (remember DLT; distributed ledger technology).\n\n**_So, the only way around that would be…_**\n\n3) ZK proofs. If you can prove the validity of the TX, then downloading the entire blockchain is no longer a necessary aspect of running it. However, blocks must be stored in some fashion, or at least accessible, demonstrable or proven. If not, then it no longer becomes a historical ledger of TX. Now, that’s not a problem if that’s what a network is going for — but if you value those records being kept and would like to refer to them later (i.e., if there is some sort of dispute between a buyer and a vendor), then this is a hell of a compromise to make.\n\nWhich brings everything back to square one, once more.",
"json_metadata": "{\"tags\":[\"bitcoin\",\"crypto\",\"cryptocurrency\",\"priceanalysis\",\"technicalanalysis\"],\"image\":[\"https://cdn-images-1.medium.com/max/1250/1*UQ6T9OjOTaZgffPXGGVchg.png\"],\"links\":[\"https://ethereumworldnews.com/vitalik-ethereum-eth-can-scale-to-500-tps-using-zcashs-zk-snarks\",\"https://xorro-p2p.github.io/\"],\"app\":\"steemit/0.1\",\"format\":\"markdown\"}"
}
]
}proofofresearchreceived 0.033 STEEM, 0.041 SP author reward for @proofofresearch / bitcoin-price-analysis-re-test-before-move-up2018/09/25 06:55:36
proofofresearchreceived 0.033 STEEM, 0.041 SP author reward for @proofofresearch / bitcoin-price-analysis-re-test-before-move-up
2018/09/25 06:55:36
| author | proofofresearch |
| permlink | bitcoin-price-analysis-re-test-before-move-up |
| sbd payout | 0.000 SBD |
| steem payout | 0.033 STEEM |
| vesting payout | 66.686663 VESTS |
| Transaction Info | Block #26247060/Virtual Operation #4 |
View Raw JSON Data
{
  "trx_id": "0000000000000000000000000000000000000000",
  "block": 26247060,
  "trx_in_block": 4294967295,
  "op_in_trx": 0,
  "virtual_op": 4,
  "timestamp": "2018-09-25T06:55:36",
  "op": [
    "author_reward",
    {
      "author": "proofofresearch",
      "permlink": "bitcoin-price-analysis-re-test-before-move-up",
      "sbd_payout": "0.000 SBD",
      "steem_payout": "0.033 STEEM",
      "vesting_payout": "66.686663 VESTS"
    }
  ]
}proofofresearchpublished a new post: the-ever-so-volatile-ripple-usdxrp-is-starting-to-look-bearish-again2018/09/25 06:24:18
proofofresearchpublished a new post: the-ever-so-volatile-ripple-usdxrp-is-starting-to-look-bearish-again
2018/09/25 06:24:18
| parent author | |
| parent permlink | bitcoin |
| author | proofofresearch |
| permlink | the-ever-so-volatile-ripple-usdxrp-is-starting-to-look-bearish-again |
| title | The Ever So Volatile Ripple $XRP is Starting to Look Bearish Again |
| body | # The Ever So Volatile Ripple $XRP is Starting to Look Bearish Again  Given the wild and astronomic price increase for the $XRP token over the last few days, it seems more appropriate now more than it ever has been to cover its future price action. # Ripple Price Analysis  [https://www.tradingview.com/x/zZVTWnYH/](https://www.tradingview.com/x/zZVTWnYH/) In the picture above, the lower support point was drawn days before based on $XRP’s prior price action on higher time frames when it was initially bursting through the seams. **_Here is a transcription of the tweet that was posted attesting to this:_** From what can be seen in the initial chart that was posted above, it appears as though the price is headed back to a re-test of 43 cents. This should come of no surprise after witnessing the bump and run pattern in its full fruition during the meteoric price rise of $XRP. Below is a readjusted version of $XRP.  [https://www.tradingview.com/x/IxSsa2D9/](https://www.tradingview.com/x/IxSsa2D9/) ### Zero_n0ncense Moving Fibs (Custom Indicator)  [https://www.tradingview.com/x/qZDXG8Qm/](https://www.tradingview.com/x/qZDXG8Qm/) The moving fibs that you see here dictate that $XRP is also trading against a marked support point in that arena as well. Please make sure to keep in mind that this is the H2 time frame as well.  [https://www.tradingview.com/x/lh285tKb/](https://www.tradingview.com/x/lh285tKb/) The logical assumption is that the price will continue to ascend from the price point that it is at currently.  [https://www.tradingview.com/x/jQLk9D3g/](https://www.tradingview.com/x/jQLk9D3g/) In the picture above, we can see that all of our oscillators are indicating oversold at this point on the H2. Another positive note for $XRP bulls is the fact that the price has successfully bounced off of the EMA-100 on the H2.  [https://www.tradingview.com/x/lQvFCCCk/](https://www.tradingview.com/x/lQvFCCCk/) Now, let’s check out the higher time frames to see how $XRP is behaving there as well. # $XRP Daily Time Frame  [https://www.tradingview.com/x/ZjUx8YVJ/](https://www.tradingview.com/x/ZjUx8YVJ/) The above chart shows some notes about the current price action of $XRP. # Relative Strength Index (14)  [https://www.tradingview.com/x/7uKp1Qp9/](https://www.tradingview.com/x/7uKp1Qp9/) The RSI(14) was grossly overbought recently. So, there’s not much room for a continuation in the price action at this point. Typically, catalysts such as the one (whatever it was) that sent the price of $XRP flying through the roof die almost as quick as they came and they do not revive themselves unless there is something fundamentally different with the coin itself. Therefore, $XRP is in **serious danger of correcting substantially further than what it has already.** While the lower time frames were ambivalent, and potentially even signaled that there would be a slight ‘bounce’ — Chances are that the price of $XRP will be stifled by the already exhausted run and the fact that new buyers will not see as much of a potential ROI as there once was now that the price is already substantially overextended from where it was previously. # Conclusion There is no R/R that the author advocates specifically at this point. |
| json metadata | {"tags":["bitcoin","crypto","cryptocurrency","priceanalysis","technicalanalysis"],"image":["https://cdn-images-1.medium.com/max/1250/0*gbDRm91I81fJd54y.jpg","https://cdn-images-1.medium.com/max/1563/1*Ol4sh06B28PDb4c_IrnNiQ.png","https://cdn-images-1.medium.com/max/1563/1*RbXYE9E74Ofe9TdHRA-eog.png","https://cdn-images-1.medium.com/max/1563/1*1OAIzAr-u8bDDrNoIsYMVA.png","https://cdn-images-1.medium.com/max/1563/1*nS8g1f9WmoRM0_rAU2kRqA.png","https://cdn-images-1.medium.com/max/1563/1*Bz8J4FUUnFppOq8Qw4M8LQ.png","https://cdn-images-1.medium.com/max/1563/1*yTjPRnN-rvCgGPe_SvsiKw.png","https://cdn-images-1.medium.com/max/1563/1*bdzjBFVQSN_RTk8LNfjZZA.png","https://cdn-images-1.medium.com/max/1563/1*ostWxo-0FNjJBdE76N58_Q.png"],"links":["https://www.tradingview.com/x/zZVTWnYH/","https://www.tradingview.com/x/IxSsa2D9/","https://www.tradingview.com/x/qZDXG8Qm/","https://www.tradingview.com/x/lh285tKb/","https://www.tradingview.com/x/jQLk9D3g/","https://www.tradingview.com/x/lQvFCCCk/","https://www.tradingview.com/x/ZjUx8YVJ/","https://www.tradingview.com/x/7uKp1Qp9/"],"app":"steemit/0.1","format":"markdown"} |
| Transaction Info | Block #26246436/Trx 883900ee39149a906c6fdccea61a6ba1133d5805 |
View Raw JSON Data
{
"trx_id": "883900ee39149a906c6fdccea61a6ba1133d5805",
"block": 26246436,
"trx_in_block": 1,
"op_in_trx": 0,
"virtual_op": 0,
"timestamp": "2018-09-25T06:24:18",
"op": [
"comment",
{
"parent_author": "",
"parent_permlink": "bitcoin",
"author": "proofofresearch",
"permlink": "the-ever-so-volatile-ripple-usdxrp-is-starting-to-look-bearish-again",
"title": "The Ever So Volatile Ripple $XRP is Starting to Look Bearish Again",
"body": "# The Ever So Volatile Ripple $XRP is Starting to Look Bearish Again\n\n\n\nGiven the wild and astronomic price increase for the $XRP token over the last few days, it seems more appropriate now more than it ever has been to cover its future price action.\n\n# Ripple Price Analysis\n\n\n\n[https://www.tradingview.com/x/zZVTWnYH/](https://www.tradingview.com/x/zZVTWnYH/)\n\nIn the picture above, the lower support point was drawn days before based on $XRP’s prior price action on higher time frames when it was initially bursting through the seams.\n\n**_Here is a transcription of the tweet that was posted attesting to this:_**\n\nFrom what can be seen in the initial chart that was posted above, it appears as though the price is headed back to a re-test of 43 cents.\n\nThis should come of no surprise after witnessing the bump and run pattern in its full fruition during the meteoric price rise of $XRP.\n\nBelow is a readjusted version of $XRP.\n\n\n\n[https://www.tradingview.com/x/IxSsa2D9/](https://www.tradingview.com/x/IxSsa2D9/)\n\n### Zero_n0ncense Moving Fibs (Custom Indicator)\n\n\n\n[https://www.tradingview.com/x/qZDXG8Qm/](https://www.tradingview.com/x/qZDXG8Qm/)\n\nThe moving fibs that you see here dictate that $XRP is also trading against a marked support point in that arena as well.\n\nPlease make sure to keep in mind that this is the H2 time frame as well.\n\n\n\n[https://www.tradingview.com/x/lh285tKb/](https://www.tradingview.com/x/lh285tKb/)\n\nThe logical assumption is that the price will continue to ascend from the price point that it is at currently.\n\n\n\n[https://www.tradingview.com/x/jQLk9D3g/](https://www.tradingview.com/x/jQLk9D3g/)\n\nIn the picture above, we can see that all of our oscillators are indicating oversold at this point on the H2.\n\nAnother positive note for $XRP bulls is the fact that the price has successfully bounced off of the EMA-100 on the H2.\n\n\n\n[https://www.tradingview.com/x/lQvFCCCk/](https://www.tradingview.com/x/lQvFCCCk/)\n\nNow, let’s check out the higher time frames to see how $XRP is behaving there as well.\n\n# $XRP Daily Time Frame\n\n\n\n[https://www.tradingview.com/x/ZjUx8YVJ/](https://www.tradingview.com/x/ZjUx8YVJ/)\n\nThe above chart shows some notes about the current price action of $XRP.\n\n# Relative Strength Index (14)\n\n\n\n[https://www.tradingview.com/x/7uKp1Qp9/](https://www.tradingview.com/x/7uKp1Qp9/)\n\nThe RSI(14) was grossly overbought recently. So, there’s not much room for a continuation in the price action at this point.\n\nTypically, catalysts such as the one (whatever it was) that sent the price of $XRP flying through the roof die almost as quick as they came and they do not revive themselves unless there is something fundamentally different with the coin itself.\n\nTherefore, $XRP is in **serious danger of correcting substantially further than what it has already.**\n\nWhile the lower time frames were ambivalent, and potentially even signaled that there would be a slight ‘bounce’ — Chances are that the price of $XRP will be stifled by the already exhausted run and the fact that new buyers will not see as much of a potential ROI as there once was now that the price is already substantially overextended from where it was previously.\n\n# Conclusion\n\nThere is no R/R that the author advocates specifically at this point.",
"json_metadata": "{\"tags\":[\"bitcoin\",\"crypto\",\"cryptocurrency\",\"priceanalysis\",\"technicalanalysis\"],\"image\":[\"https://cdn-images-1.medium.com/max/1250/0*gbDRm91I81fJd54y.jpg\",\"https://cdn-images-1.medium.com/max/1563/1*Ol4sh06B28PDb4c_IrnNiQ.png\",\"https://cdn-images-1.medium.com/max/1563/1*RbXYE9E74Ofe9TdHRA-eog.png\",\"https://cdn-images-1.medium.com/max/1563/1*1OAIzAr-u8bDDrNoIsYMVA.png\",\"https://cdn-images-1.medium.com/max/1563/1*nS8g1f9WmoRM0_rAU2kRqA.png\",\"https://cdn-images-1.medium.com/max/1563/1*Bz8J4FUUnFppOq8Qw4M8LQ.png\",\"https://cdn-images-1.medium.com/max/1563/1*yTjPRnN-rvCgGPe_SvsiKw.png\",\"https://cdn-images-1.medium.com/max/1563/1*bdzjBFVQSN_RTk8LNfjZZA.png\",\"https://cdn-images-1.medium.com/max/1563/1*ostWxo-0FNjJBdE76N58_Q.png\"],\"links\":[\"https://www.tradingview.com/x/zZVTWnYH/\",\"https://www.tradingview.com/x/IxSsa2D9/\",\"https://www.tradingview.com/x/qZDXG8Qm/\",\"https://www.tradingview.com/x/lh285tKb/\",\"https://www.tradingview.com/x/jQLk9D3g/\",\"https://www.tradingview.com/x/lQvFCCCk/\",\"https://www.tradingview.com/x/ZjUx8YVJ/\",\"https://www.tradingview.com/x/7uKp1Qp9/\"],\"app\":\"steemit/0.1\",\"format\":\"markdown\"}"
}
]
}smartcoinsupvoted (10.00%) @proofofresearch / ethereum-price-analysis2018/09/24 23:09:45
smartcoinsupvoted (10.00%) @proofofresearch / ethereum-price-analysis
2018/09/24 23:09:45
| voter | smartcoins |
| author | proofofresearch |
| permlink | ethereum-price-analysis |
| weight | 1000 (10.00%) |
| Transaction Info | Block #26237754/Trx 6fd8af69564ed9720698447cb5ea08b4543ada3b |
View Raw JSON Data
{
  "trx_id": "6fd8af69564ed9720698447cb5ea08b4543ada3b",
  "block": 26237754,
  "trx_in_block": 24,
  "op_in_trx": 0,
  "virtual_op": 0,
  "timestamp": "2018-09-24T23:09:45",
  "op": [
    "vote",
    {
      "voter": "smartcoins",
      "author": "proofofresearch",
      "permlink": "ethereum-price-analysis",
      "weight": 1000
    }
  ]
}2018/09/24 22:08:45
2018/09/24 22:08:45
| parent author | proofofresearch |
| parent permlink | ethereum-price-analysis |
| author | introduce.bot |
| permlink | introduce-bot-re-proofofresearchethereum-price-analysis |
| title | |
| body | @proofofresearch, I gave you a vote!<br>If you follow me, I will also follow you in return! |
| json metadata | |
| Transaction Info | Block #26236536/Trx d079f3ae03b25c1b8c2ef1a49b2736f463620c3c |
View Raw JSON Data
{
  "trx_id": "d079f3ae03b25c1b8c2ef1a49b2736f463620c3c",
  "block": 26236536,
  "trx_in_block": 21,
  "op_in_trx": 0,
  "virtual_op": 0,
  "timestamp": "2018-09-24T22:08:45",
  "op": [
    "comment",
    {
      "parent_author": "proofofresearch",
      "parent_permlink": "ethereum-price-analysis",
      "author": "introduce.bot",
      "permlink": "introduce-bot-re-proofofresearchethereum-price-analysis",
      "title": "",
      "body": " @proofofresearch, I gave you a vote!<br>If you follow me, I will also follow you in return!",
      "json_metadata": ""
    }
  ]
}introduce.botupvoted (1.00%) @proofofresearch / ethereum-price-analysis2018/09/24 22:08:42
introduce.botupvoted (1.00%) @proofofresearch / ethereum-price-analysis
2018/09/24 22:08:42
| voter | introduce.bot |
| author | proofofresearch |
| permlink | ethereum-price-analysis |
| weight | 100 (1.00%) |
| Transaction Info | Block #26236535/Trx 7343c6898b7cbd054ea7f8e7723ef10c2df45d06 |
View Raw JSON Data
{
  "trx_id": "7343c6898b7cbd054ea7f8e7723ef10c2df45d06",
  "block": 26236535,
  "trx_in_block": 44,
  "op_in_trx": 0,
  "virtual_op": 0,
  "timestamp": "2018-09-24T22:08:42",
  "op": [
    "vote",
    {
      "voter": "introduce.bot",
      "author": "proofofresearch",
      "permlink": "ethereum-price-analysis",
      "weight": 100
    }
  ]
}proofofresearchpublished a new post: ethereum-price-analysis2018/09/24 21:53:39
proofofresearchpublished a new post: ethereum-price-analysis
2018/09/24 21:53:39
| parent author | |
| parent permlink | bitcoin |
| author | proofofresearch |
| permlink | ethereum-price-analysis |
| title | Ethereum Price Analysis |
| body |  As one of the more volatile members of the T10 cryptocurrencies, Ethereum is something that mandates special attention for traders that dare to venture into the land of the ‘unknown’. # Ethereum Price Analysis  [https://www.tradingview.com/x/K1JOfwwg/](https://www.tradingview.com/x/K1JOfwwg/) The picture above shows Ethereum on the H2 chart (H2 = 2-Hour Time Chart). As you can see above, the translucent boxes show that the uptrend line that has formed itself is well tested at this point, with several rises after the re-tests. At this point, after four tests of the line, we can consider this to be a reliable point of support for the price. Thus, since the price is currently trading against this line at this point, it is reasonable to expect that there could be a potential price gain in the immediate future (immediate since its the H2 timeframe). # Relative Strength Index(14) [H2 Time Frame]  [https://www.tradingview.com/x/Szqex3ga/](https://www.tradingview.com/x/Szqex3ga/) The RSI on the H2 time frame shows the RSI speeding toward the oversold point. Normally, in a bear market this would be something that would be of no greater consequence for us. However, since the overall trend on the higher time frames dictates that the positive momentum is still in full swing, this is a condition that we **_could be justified_** in seeing as **_temporary_**.  [https://www.tradingview.com/x/M44vU8pb/](https://www.tradingview.com/x/M44vU8pb/) Above, is a picture of the RSI(14) on the daily chart. As one can observe in the picture above, the RSI is still increasing at a steady pace with a marked trend. Therefore, the data that we observe on the RSI(14) for the H2, in the author’s opinion, indicates a period of consolidation rather than the beginning of a downtrend. In order to confirm, let’s take a look at a few other indicators. # EMA Mean Regression This is a custom indicator that we have yet to use in the bear market, but one that would be useful in this scenario.  [https://www.tradingview.com/x/LJEHUKmC/](https://www.tradingview.com/x/LJEHUKmC/) This indicator is useful in the lower time frames because it does a few things: 1. Gives us a multitude of buy and sell signals. 2. Helps us to anticipate when there may be a potential uptick in the price. Based on what we can see above in the H2 time frame, it appears that an impending uptick in the price could be around the corner. One of the basic principles of EMA indicators is that the closer they become to one another, the more likely it is that they will **_cross in the near future_**, which would signal a reversal in the price movement. Currently, that principle is espoused in the indicator above through the **_narrowing_** or **_thinning of the mean reversion ribbon_**.  [https://www.tradingview.com/x/Gb8jirK0/](https://www.tradingview.com/x/Gb8jirK0/) This is exemplified in the pic**_t_**ure above via the translucent green box for those that were not able to identify it earlier. The ribbon itself signals a resistance and support point contingent upon whether the price is above or below. At this point, the price is below the EMA mean reve**r**sion, which makes it a point of resistance. As we can see on the chart above, the overhead resistance is hanging at $237. Therefore, as a starter, the price should at least break through $237 before we really begin to become bullish on the price action again in the short-term. ## Exponential Moving Average  [https://www.tradingview.com/x/av29ShZ0/](https://www.tradingview.com/x/av29ShZ0/) The EMA-26 is also hanging at the $237 price mark as well. # Conclusion Based on what was shown above as well as in other indicators, there is probably more consolidation that is due on the Ethereum chart. Advocating a long position at this point is not something that can be done definitively at this point if one wanted to maximize their R/R. However, the convergence of the EMA indicators as shown by the EMA mean regression (custom indicator) above yields credence to the idea that there **_may be a reversal in the price in the near future_**. ## Targets  [https://www.tradingview.com/x/PwfmVVif/](https://www.tradingview.com/x/PwfmVVif/) As you can see in the above picture, the price did ascend past the resistance point that it was nudging against (marked by the translucent green triangles). After the price surpassed that point, it then re-tested (the phase that it is in currently). The maximum overhead resistance, according to the Fib levels, is marked at $275. |
| json metadata | {"tags":["bitcoin","crypto","cryptocurrency","priceanalysis","technicalanalysis"],"image":["https://cdn-images-1.medium.com/max/1100/1*OVdh9UvPcsAVWJ_m6CUB4A.gif","https://cdn-images-1.medium.com/max/1375/1*4S5WItMvYs_A7FIQyzZdmw.png","https://cdn-images-1.medium.com/max/1375/1*KmyyQoe9YsnqPnlYV86CiQ.png","https://cdn-images-1.medium.com/max/1375/1*IPr26RKeR4Ve4L3hIxtpZw.png","https://cdn-images-1.medium.com/max/1375/1*0D-X05ZwCAjT41xifhw3lA.png","https://cdn-images-1.medium.com/max/1375/1*sbu7sW_NbIktuyu52OjpVw.png","https://cdn-images-1.medium.com/max/1375/1*BWravgvdAke96fwIQVm6uA.png","https://cdn-images-1.medium.com/max/1375/1*25tmBjPvq36X7DLeYwRE_g.png"],"links":["https://www.tradingview.com/x/K1JOfwwg/","https://www.tradingview.com/x/Szqex3ga/","https://www.tradingview.com/x/M44vU8pb/","https://www.tradingview.com/x/LJEHUKmC/","https://www.tradingview.com/x/Gb8jirK0/","https://www.tradingview.com/x/av29ShZ0/","https://www.tradingview.com/x/PwfmVVif/"],"app":"steemit/0.1","format":"markdown"} |
| Transaction Info | Block #26236234/Trx 863e5821fe26a97edfc01371ea21b39acc0d56da |
View Raw JSON Data
{
"trx_id": "863e5821fe26a97edfc01371ea21b39acc0d56da",
"block": 26236234,
"trx_in_block": 52,
"op_in_trx": 0,
"virtual_op": 0,
"timestamp": "2018-09-24T21:53:39",
"op": [
"comment",
{
"parent_author": "",
"parent_permlink": "bitcoin",
"author": "proofofresearch",
"permlink": "ethereum-price-analysis",
"title": "Ethereum Price Analysis",
"body": "\n\nAs one of the more volatile members of the T10 cryptocurrencies, Ethereum is something that mandates special attention for traders that dare to venture into the land of the ‘unknown’.\n\n# Ethereum Price Analysis\n\n\n\n[https://www.tradingview.com/x/K1JOfwwg/](https://www.tradingview.com/x/K1JOfwwg/)\n\nThe picture above shows Ethereum on the H2 chart (H2 = 2-Hour Time Chart).\n\nAs you can see above, the translucent boxes show that the uptrend line that has formed itself is well tested at this point, with several rises after the re-tests.\n\nAt this point, after four tests of the line, we can consider this to be a reliable point of support for the price.\n\nThus, since the price is currently trading against this line at this point, it is reasonable to expect that there could be a potential price gain in the immediate future (immediate since its the H2 timeframe).\n\n# Relative Strength Index(14) [H2 Time Frame]\n\n\n\n[https://www.tradingview.com/x/Szqex3ga/](https://www.tradingview.com/x/Szqex3ga/)\n\nThe RSI on the H2 time frame shows the RSI speeding toward the oversold point. Normally, in a bear market this would be something that would be of no greater consequence for us.\n\nHowever, since the overall trend on the higher time frames dictates that the positive momentum is still in full swing, this is a condition that we **_could be justified_** in seeing as **_temporary_**.\n\n\n\n[https://www.tradingview.com/x/M44vU8pb/](https://www.tradingview.com/x/M44vU8pb/)\n\nAbove, is a picture of the RSI(14) on the daily chart.\n\nAs one can observe in the picture above, the RSI is still increasing at a steady pace with a marked trend.\n\nTherefore, the data that we observe on the RSI(14) for the H2, in the author’s opinion, indicates a period of consolidation rather than the beginning of a downtrend.\n\nIn order to confirm, let’s take a look at a few other indicators.\n\n# EMA Mean Regression\n\nThis is a custom indicator that we have yet to use in the bear market, but one that would be useful in this scenario.\n\n\n\n[https://www.tradingview.com/x/LJEHUKmC/](https://www.tradingview.com/x/LJEHUKmC/)\n\nThis indicator is useful in the lower time frames because it does a few things:\n\n1. Gives us a multitude of buy and sell signals.\n2. Helps us to anticipate when there may be a potential uptick in the price.\n\nBased on what we can see above in the H2 time frame, it appears that an impending uptick in the price could be around the corner.\n\nOne of the basic principles of EMA indicators is that the closer they become to one another, the more likely it is that they will **_cross in the near future_**, which would signal a reversal in the price movement.\n\nCurrently, that principle is espoused in the indicator above through the **_narrowing_** or **_thinning of the mean reversion ribbon_**.\n\n\n\n[https://www.tradingview.com/x/Gb8jirK0/](https://www.tradingview.com/x/Gb8jirK0/)\n\nThis is exemplified in the pic**_t_**ure above via the translucent green box for those that were not able to identify it earlier.\n\nThe ribbon itself signals a resistance and support point contingent upon whether the price is above or below.\n\nAt this point, the price is below the EMA mean reve**r**sion, which makes it a point of resistance.\n\nAs we can see on the chart above, the overhead resistance is hanging at $237.\n\nTherefore, as a starter, the price should at least break through $237 before we really begin to become bullish on the price action again in the short-term.\n\n## Exponential Moving Average\n\n\n\n[https://www.tradingview.com/x/av29ShZ0/](https://www.tradingview.com/x/av29ShZ0/)\n\nThe EMA-26 is also hanging at the $237 price mark as well.\n\n# Conclusion\n\nBased on what was shown above as well as in other indicators, there is probably more consolidation that is due on the Ethereum chart.\n\nAdvocating a long position at this point is not something that can be done definitively at this point if one wanted to maximize their R/R.\n\nHowever, the convergence of the EMA indicators as shown by the EMA mean regression (custom indicator) above yields credence to the idea that there **_may be a reversal in the price in the near future_**.\n\n## Targets\n\n\n\n[https://www.tradingview.com/x/PwfmVVif/](https://www.tradingview.com/x/PwfmVVif/)\n\nAs you can see in the above picture, the price did ascend past the resistance point that it was nudging against (marked by the translucent green triangles). After the price surpassed that point, it then re-tested (the phase that it is in currently).\n\nThe maximum overhead resistance, according to the Fib levels, is marked at $275.",
"json_metadata": "{\"tags\":[\"bitcoin\",\"crypto\",\"cryptocurrency\",\"priceanalysis\",\"technicalanalysis\"],\"image\":[\"https://cdn-images-1.medium.com/max/1100/1*OVdh9UvPcsAVWJ_m6CUB4A.gif\",\"https://cdn-images-1.medium.com/max/1375/1*4S5WItMvYs_A7FIQyzZdmw.png\",\"https://cdn-images-1.medium.com/max/1375/1*KmyyQoe9YsnqPnlYV86CiQ.png\",\"https://cdn-images-1.medium.com/max/1375/1*IPr26RKeR4Ve4L3hIxtpZw.png\",\"https://cdn-images-1.medium.com/max/1375/1*0D-X05ZwCAjT41xifhw3lA.png\",\"https://cdn-images-1.medium.com/max/1375/1*sbu7sW_NbIktuyu52OjpVw.png\",\"https://cdn-images-1.medium.com/max/1375/1*BWravgvdAke96fwIQVm6uA.png\",\"https://cdn-images-1.medium.com/max/1375/1*25tmBjPvq36X7DLeYwRE_g.png\"],\"links\":[\"https://www.tradingview.com/x/K1JOfwwg/\",\"https://www.tradingview.com/x/Szqex3ga/\",\"https://www.tradingview.com/x/M44vU8pb/\",\"https://www.tradingview.com/x/LJEHUKmC/\",\"https://www.tradingview.com/x/Gb8jirK0/\",\"https://www.tradingview.com/x/av29ShZ0/\",\"https://www.tradingview.com/x/PwfmVVif/\"],\"app\":\"steemit/0.1\",\"format\":\"markdown\"}"
}
]
}2018/09/24 03:48:21
2018/09/24 03:48:21
| voter | wilkynson |
| author | proofofresearch |
| permlink | bitcoin-price-analysis-9-23-2018-potential-re-test-before-advance |
| weight | 5000 (50.00%) |
| Transaction Info | Block #26214559/Trx cbe7182eae9a3f18dc528ffed4a893bc19bd1d9d |
View Raw JSON Data
{
  "trx_id": "cbe7182eae9a3f18dc528ffed4a893bc19bd1d9d",
  "block": 26214559,
  "trx_in_block": 11,
  "op_in_trx": 0,
  "virtual_op": 0,
  "timestamp": "2018-09-24T03:48:21",
  "op": [
    "vote",
    {
      "voter": "wilkynson",
      "author": "proofofresearch",
      "permlink": "bitcoin-price-analysis-9-23-2018-potential-re-test-before-advance",
      "weight": 5000
    }
  ]
}2018/09/24 03:48:18
2018/09/24 03:48:18
| voter | hijosdelhombre |
| author | proofofresearch |
| permlink | bitcoin-price-analysis-9-23-2018-potential-re-test-before-advance |
| weight | 10000 (100.00%) |
| Transaction Info | Block #26214558/Trx 239364f4bd6a1ed9c2c0935ff3af51224fdc530b |
View Raw JSON Data
{
  "trx_id": "239364f4bd6a1ed9c2c0935ff3af51224fdc530b",
  "block": 26214558,
  "trx_in_block": 22,
  "op_in_trx": 0,
  "virtual_op": 0,
  "timestamp": "2018-09-24T03:48:18",
  "op": [
    "vote",
    {
      "voter": "hijosdelhombre",
      "author": "proofofresearch",
      "permlink": "bitcoin-price-analysis-9-23-2018-potential-re-test-before-advance",
      "weight": 10000
    }
  ]
}hijosdelhombreupvoted (100.00%) @proofofresearch / analyzing-vitalik-s-crypto-scaling-comments-in-full2018/09/24 03:43:54
hijosdelhombreupvoted (100.00%) @proofofresearch / analyzing-vitalik-s-crypto-scaling-comments-in-full
2018/09/24 03:43:54
| voter | hijosdelhombre |
| author | proofofresearch |
| permlink | analyzing-vitalik-s-crypto-scaling-comments-in-full |
| weight | 10000 (100.00%) |
| Transaction Info | Block #26214470/Trx f159c2df2261ba9e175ca687158c5c025abf13f8 |
View Raw JSON Data
{
  "trx_id": "f159c2df2261ba9e175ca687158c5c025abf13f8",
  "block": 26214470,
  "trx_in_block": 16,
  "op_in_trx": 0,
  "virtual_op": 0,
  "timestamp": "2018-09-24T03:43:54",
  "op": [
    "vote",
    {
      "voter": "hijosdelhombre",
      "author": "proofofresearch",
      "permlink": "analyzing-vitalik-s-crypto-scaling-comments-in-full",
      "weight": 10000
    }
  ]
}2018/09/23 14:15:15
2018/09/23 14:15:15
| voter | cryptomazin |
| author | proofofresearch |
| permlink | bitcoin-price-analysis-9-23-2018-potential-re-test-before-advance |
| weight | 10000 (100.00%) |
| Transaction Info | Block #26198299/Trx fade29db082d2da4f676e6cd0bf71f85ab1deea5 |
View Raw JSON Data
{
  "trx_id": "fade29db082d2da4f676e6cd0bf71f85ab1deea5",
  "block": 26198299,
  "trx_in_block": 26,
  "op_in_trx": 0,
  "virtual_op": 0,
  "timestamp": "2018-09-23T14:15:15",
  "op": [
    "vote",
    {
      "voter": "cryptomazin",
      "author": "proofofresearch",
      "permlink": "bitcoin-price-analysis-9-23-2018-potential-re-test-before-advance",
      "weight": 10000
    }
  ]
}proofofresearchpublished a new post: bitcoin-price-analysis-9-23-2018-potential-re-test-before-advance2018/09/23 06:28:39
proofofresearchpublished a new post: bitcoin-price-analysis-9-23-2018-potential-re-test-before-advance
2018/09/23 06:28:39
| parent author | |
| parent permlink | bitcoin |
| author | proofofresearch |
| permlink | bitcoin-price-analysis-9-23-2018-potential-re-test-before-advance |
| title | Bitcoin Price Analysis (9–23–2018) Potential Re-Test Before Advance |
| body | # Bitcoin Price Analysis (9–23–2018) Potential Re-Test Before Advance  This Bitcoin Price Analysis will feature a few revelations that were not contained in the prior versions. Please note that this is not financial advice, nor should it be construed as such. These are merely ideas. For more information like this, please join the Telegram [t.me/MerkleTrader](http://t.me/MerkleTrader) # Bitcoin Price Analysis  [https://www.tradingview.com/x/pjQmUeYg/](https://www.tradingview.com/x/pjQmUeYg/) From the first picture, it should be immediately apparent that there is a Double-Bottom Chart Pattern Formation that has formulated on Bitcoin on the 1D chart. This is symbolized by the light blue line drawing the a ‘W’ figure through the price movement on the chart above.  Source: [http://stockcharts.com/school/doku.php?id=chart_school:chart_analysis:chart_patterns:double_bottom_reversal](http://stockcharts.com/school/doku.php?id=chart_school:chart_analysis:chart_patterns:double_bottom_reversal) As noted in the photo above, this is a reversal pattern — which means that there must have been a prior downtrend. On the daily, this is shown to some extent via the decline in price movement from September 5th to the completion of the pattern. However, this can also be seen in the expeditious decline in price since May 5th to this current point as well.  [https://www.tradingview.com/x/aA7ppqvz/](https://www.tradingview.com/x/aA7ppqvz/)  [https://www.tradingview.com/x/eGxz6uMf/](https://www.tradingview.com/x/eGxz6uMf/) # Estimated Price Target From the Double-Bottom Formation  [https://www.tradingview.com/x/6QLQYcSD/](https://www.tradingview.com/x/6QLQYcSD/) The estimated target from the chart pattern formation is approximately $6.9k. This falls in line (to some extent) with where the overhead trendline (spanning from May 5th, 2018) is currently located.  [https://www.tradingview.com/x/fyofPX03/](https://www.tradingview.com/x/fyofPX03/) As one can see in the photo above, the trendline stemming from the price decline that started on July 28th is also telling us that $6.9k is a ‘bounce’ point. # Taking a Quick Look at Volume  [https://www.tradingview.com/x/J92pOnkX/](https://www.tradingview.com/x/J92pOnkX/) As can be seen in the screenshot above, the volume truly isn’t doing us any favors in deciphering whether there is a general decline in the positive price volume or not. Since this is the daily, we would more than likely need to wait a few more days before being able to make a definitive assumption about the volume trend during this slight uptick period. However, by the time a real pattern manifests itself in the volume bars at the bottom of the chart, the future price action probably will have already played itself out. Therefore, we won’t put too much stock on waiting for more volume metrics at this point. # Possible Upside of $7.1k  [https://www.tradingview.com/x/BbY2yVlN/](https://www.tradingview.com/x/BbY2yVlN/) So, if you scroll your chart back, you should be able to draw two trendlines. 1. The first trendline should be like the one that we discussed above. That one is a **_potential trendline_**, because it has only been tested twice. 2. The second trendline is one spanning back to May 5th, 2018. While it isn’t displayed in the picture above, that trendline is substantially more valid because we can identify three different times (over a decent span of time), when the trendline was hit.  [https://www.tradingview.com/x/fPQPoQb2/](https://www.tradingview.com/x/fPQPoQb2/) Due to this fact, $7.1k-$7.2k **_cannot be ruled out_**. A break above both trendlines would signify major bullish price action, and further sustained gains on the price for Bitcoin is something that should be expected at that point. However, for now, it is more prudent to focus on the aforementioned targets of $6.9k and $7.1k as the maximum upsides. # Relative Strength Index (14) [On the Daily]  [https://www.tradingview.com/x/5ygRMXpM/](https://www.tradingview.com/x/5ygRMXpM/)  [https://www.tradingview.com/x/iNODsJ8k/](https://www.tradingview.com/x/iNODsJ8k/) Based on the RSI(14) [Ignore the coloring; This is a custom indicator and the colors do not affect the actual wavelength of the RSI itself], we can see a noticeable ‘undercurrent’ where there have been consecutive higher lows. That’s always a bullish sign. We can’t call it positive divergence though, because the lows on the chart have also been higher. Given this fact, the RSI(14) is something that we should look to in order to anticipate if there will be lower lows in the price in the future. This is because, a lower low on the RSI could be accompanied by yet another higher low on the actual chart. If this were the case, then the lower low on the RSI chart would be a strong indicator that the price action for Bitcoin was beginning to fade and that a short position/consolidation of profits should be strongly considered. However, at this point, neither recourse seems necessary. # Anticipating a Re-Test of $6.5k In order to appropriately anticipate a re-test of the $6.5k point, Bitcoin must be examined on the lower time frames. This is because this move would more than likely be something that occurs in the near-term (next few hours/day or two), and therefore, the appropriate signals notifying us that such an event is occurring probably wouldn’t show up on the daily charts. To start off with, we’ll go ahead and check out the H4 chart.  [https://www.tradingview.com/x/YIxsrGGF/](https://www.tradingview.com/x/YIxsrGGF/) Based on the chart above, we can see that the RSI(14) has already hit the overbought point and appears to be continuing its path toward overbought territory after a slight drawback (which occurred due to the consolidation that you can see on the chart above). From what the above indicators are displaying as well as the price action, it stands to reason that there will be a brief consolidation in price coming soon. More than likely, it will be to $6.5k as we surmised earlier in the article. This re-test is needed for the bulls to ‘recharge’ before making their final (potentially) trounce toward the $6.8k-$7.1k legion. If not, then it should be expected that the price will continually ascend until it is eventually pushed back down. This would make a $6.8k/$6.9k threshold a lot more plausible than $7.1k or higher, but $6.5k should be considered the first stop down in any situation. # Conclusion Currently, the price action for Bitcoin appears to be pretty healthy. However: 1. If someone is specifically looking to make **_very short-term profits_**, then now is probably not the best time to place a long position. A short position could also be somewhat risky since the price will more than likely have fluctuated by the time you’re reading this portion of the article (currently, its trading at $6720). 2. Overall, on the daily (looking at the bigger picture), things appear to be safe for the time being. There are no major indicators that there is huge bearish sentiment that will swoop in. As always, of course, it is prudent to watch out for any and all news that comes across the circuits. One never knows what may happen and none of us possess a crystal ball. Something fairly earth shattering would result in a major price drop or price gain that would invalidate everything stated. As always, remain careful trading! |
| json metadata | {"tags":["bitcoin","crypto","cryptocurrency","priceanalysis","technicalanalysis"],"image":["https://cdn-images-1.medium.com/max/880/0*K39qPE_K8loTo0AP.gif","https://cdn-images-1.medium.com/max/1100/1*Qld5v6_31QiSfE_r8kb0Bg.png","https://cdn-images-1.medium.com/max/880/0*hPzBKEggECZH25xZ.png","https://cdn-images-1.medium.com/max/1100/1*8Icuo5Txotaq-S7EkkOLaQ.png","https://cdn-images-1.medium.com/max/1100/1*6fkVwlXjmKXBntNbY3zG0w.png","https://cdn-images-1.medium.com/max/1100/1*dw0__vDwc4_SB_phE5t47A.png","https://cdn-images-1.medium.com/max/1100/1*D44vlTHB5ZWExCXDgwzJZw.png","https://cdn-images-1.medium.com/max/1100/1*1wj2iH2vJvvJ3feuxHuL1A.png","https://cdn-images-1.medium.com/max/1100/1*cuvNS1ak0C-IpMGagE4L-w.png","https://cdn-images-1.medium.com/max/1100/1*bD5rCP4lXHHv4P-KemJ-bw.png","https://cdn-images-1.medium.com/max/1100/1*i3-Bcb2qPP8x9LrkXbb_Xw.png","https://cdn-images-1.medium.com/max/1100/1*9Ab163JNBaGIv5ghdR9tzg.png","https://cdn-images-1.medium.com/max/1100/1*ySpIPQF_IUh08Xnra41zpw.png"],"links":["http://t.me/MerkleTrader","https://www.tradingview.com/x/pjQmUeYg/","http://stockcharts.com/school/doku.php?id=chart_school:chart_analysis:chart_patterns:double_bottom_reversal","https://www.tradingview.com/x/aA7ppqvz/","https://www.tradingview.com/x/eGxz6uMf/","https://www.tradingview.com/x/6QLQYcSD/","https://www.tradingview.com/x/fyofPX03/","https://www.tradingview.com/x/J92pOnkX/","https://www.tradingview.com/x/BbY2yVlN/","https://www.tradingview.com/x/fPQPoQb2/","https://www.tradingview.com/x/5ygRMXpM/","https://www.tradingview.com/x/iNODsJ8k/","https://www.tradingview.com/x/YIxsrGGF/"],"app":"steemit/0.1","format":"markdown"} |
| Transaction Info | Block #26188973/Trx 8804b28ced6842aa7a427713f0e2e61bf7b5829d |
View Raw JSON Data
{
"trx_id": "8804b28ced6842aa7a427713f0e2e61bf7b5829d",
"block": 26188973,
"trx_in_block": 6,
"op_in_trx": 0,
"virtual_op": 0,
"timestamp": "2018-09-23T06:28:39",
"op": [
"comment",
{
"parent_author": "",
"parent_permlink": "bitcoin",
"author": "proofofresearch",
"permlink": "bitcoin-price-analysis-9-23-2018-potential-re-test-before-advance",
"title": "Bitcoin Price Analysis (9–23–2018) Potential Re-Test Before Advance",
"body": "# Bitcoin Price Analysis (9–23–2018) Potential Re-Test Before Advance\n\n\n\nThis Bitcoin Price Analysis will feature a few revelations that were not contained in the prior versions.\n\nPlease note that this is not financial advice, nor should it be construed as such. These are merely ideas.\n\nFor more information like this, please join the Telegram [t.me/MerkleTrader](http://t.me/MerkleTrader)\n\n# Bitcoin Price Analysis\n\n\n\n[https://www.tradingview.com/x/pjQmUeYg/](https://www.tradingview.com/x/pjQmUeYg/)\n\nFrom the first picture, it should be immediately apparent that there is a Double-Bottom Chart Pattern Formation that has formulated on Bitcoin on the 1D chart.\n\nThis is symbolized by the light blue line drawing the a ‘W’ figure through the price movement on the chart above.\n\n\n\nSource: [http://stockcharts.com/school/doku.php?id=chart_school:chart_analysis:chart_patterns:double_bottom_reversal](http://stockcharts.com/school/doku.php?id=chart_school:chart_analysis:chart_patterns:double_bottom_reversal)\n\nAs noted in the photo above, this is a reversal pattern — which means that there must have been a prior downtrend.\n\nOn the daily, this is shown to some extent via the decline in price movement from September 5th to the completion of the pattern.\n\nHowever, this can also be seen in the expeditious decline in price since May 5th to this current point as well.\n\n\n\n[https://www.tradingview.com/x/aA7ppqvz/](https://www.tradingview.com/x/aA7ppqvz/)\n\n\n\n[https://www.tradingview.com/x/eGxz6uMf/](https://www.tradingview.com/x/eGxz6uMf/)\n\n# Estimated Price Target From the Double-Bottom Formation\n\n\n\n[https://www.tradingview.com/x/6QLQYcSD/](https://www.tradingview.com/x/6QLQYcSD/)\n\nThe estimated target from the chart pattern formation is approximately $6.9k.\n\nThis falls in line (to some extent) with where the overhead trendline (spanning from May 5th, 2018) is currently located.\n\n\n\n[https://www.tradingview.com/x/fyofPX03/](https://www.tradingview.com/x/fyofPX03/)\n\nAs one can see in the photo above, the trendline stemming from the price decline that started on July 28th is also telling us that $6.9k is a ‘bounce’ point.\n\n# Taking a Quick Look at Volume\n\n\n\n[https://www.tradingview.com/x/J92pOnkX/](https://www.tradingview.com/x/J92pOnkX/)\n\nAs can be seen in the screenshot above, the volume truly isn’t doing us any favors in deciphering whether there is a general decline in the positive price volume or not.\n\nSince this is the daily, we would more than likely need to wait a few more days before being able to make a definitive assumption about the volume trend during this slight uptick period.\n\nHowever, by the time a real pattern manifests itself in the volume bars at the bottom of the chart, the future price action probably will have already played itself out. Therefore, we won’t put too much stock on waiting for more volume metrics at this point.\n\n# Possible Upside of $7.1k\n\n\n\n[https://www.tradingview.com/x/BbY2yVlN/](https://www.tradingview.com/x/BbY2yVlN/)\n\nSo, if you scroll your chart back, you should be able to draw two trendlines.\n\n1. The first trendline should be like the one that we discussed above. That one is a **_potential trendline_**, because it has only been tested twice.\n2. The second trendline is one spanning back to May 5th, 2018. While it isn’t displayed in the picture above, that trendline is substantially more valid because we can identify three different times (over a decent span of time), when the trendline was hit.\n\n\n\n[https://www.tradingview.com/x/fPQPoQb2/](https://www.tradingview.com/x/fPQPoQb2/)\n\nDue to this fact, $7.1k-$7.2k **_cannot be ruled out_**.\n\nA break above both trendlines would signify major bullish price action, and further sustained gains on the price for Bitcoin is something that should be expected at that point.\n\nHowever, for now, it is more prudent to focus on the aforementioned targets of $6.9k and $7.1k as the maximum upsides.\n\n# Relative Strength Index (14) [On the Daily]\n\n\n\n[https://www.tradingview.com/x/5ygRMXpM/](https://www.tradingview.com/x/5ygRMXpM/)\n\n\n\n[https://www.tradingview.com/x/iNODsJ8k/](https://www.tradingview.com/x/iNODsJ8k/)\n\nBased on the RSI(14) [Ignore the coloring; This is a custom indicator and the colors do not affect the actual wavelength of the RSI itself], we can see a noticeable ‘undercurrent’ where there have been consecutive higher lows. \nThat’s always a bullish sign.\n\nWe can’t call it positive divergence though, because the lows on the chart have also been higher.\n\nGiven this fact, the RSI(14) is something that we should look to in order to anticipate if there will be lower lows in the price in the future. This is because, a lower low on the RSI could be accompanied by yet another higher low on the actual chart.\n\nIf this were the case, then the lower low on the RSI chart would be a strong indicator that the price action for Bitcoin was beginning to fade and that a short position/consolidation of profits should be strongly considered.\n\nHowever, at this point, neither recourse seems necessary.\n\n# Anticipating a Re-Test of $6.5k\n\nIn order to appropriately anticipate a re-test of the $6.5k point, Bitcoin must be examined on the lower time frames.\n\nThis is because this move would more than likely be something that occurs in the near-term (next few hours/day or two), and therefore, the appropriate signals notifying us that such an event is occurring probably wouldn’t show up on the daily charts.\n\nTo start off with, we’ll go ahead and check out the H4 chart.\n\n\n\n[https://www.tradingview.com/x/YIxsrGGF/](https://www.tradingview.com/x/YIxsrGGF/)\n\nBased on the chart above, we can see that the RSI(14) has already hit the overbought point and appears to be continuing its path toward overbought territory after a slight drawback (which occurred due to the consolidation that you can see on the chart above).\n\nFrom what the above indicators are displaying as well as the price action, it stands to reason that there will be a brief consolidation in price coming soon. More than likely, it will be to $6.5k as we surmised earlier in the article.\n\nThis re-test is needed for the bulls to ‘recharge’ before making their final (potentially) trounce toward the $6.8k-$7.1k legion.\n\nIf not, then it should be expected that the price will continually ascend until it is eventually pushed back down.\n\nThis would make a $6.8k/$6.9k threshold a lot more plausible than $7.1k or higher, but $6.5k should be considered the first stop down in any situation.\n\n# Conclusion\n\nCurrently, the price action for Bitcoin appears to be pretty healthy.\n\nHowever:\n\n1. If someone is specifically looking to make **_very short-term profits_**, then now is probably not the best time to place a long position. A short position could also be somewhat risky since the price will more than likely have fluctuated by the time you’re reading this portion of the article (currently, its trading at $6720).\n2. Overall, on the daily (looking at the bigger picture), things appear to be safe for the time being. There are no major indicators that there is huge bearish sentiment that will swoop in.\n\nAs always, of course, it is prudent to watch out for any and all news that comes across the circuits. One never knows what may happen and none of us possess a crystal ball. Something fairly earth shattering would result in a major price drop or price gain that would invalidate everything stated.\n\nAs always, remain careful trading!",
"json_metadata": "{\"tags\":[\"bitcoin\",\"crypto\",\"cryptocurrency\",\"priceanalysis\",\"technicalanalysis\"],\"image\":[\"https://cdn-images-1.medium.com/max/880/0*K39qPE_K8loTo0AP.gif\",\"https://cdn-images-1.medium.com/max/1100/1*Qld5v6_31QiSfE_r8kb0Bg.png\",\"https://cdn-images-1.medium.com/max/880/0*hPzBKEggECZH25xZ.png\",\"https://cdn-images-1.medium.com/max/1100/1*8Icuo5Txotaq-S7EkkOLaQ.png\",\"https://cdn-images-1.medium.com/max/1100/1*6fkVwlXjmKXBntNbY3zG0w.png\",\"https://cdn-images-1.medium.com/max/1100/1*dw0__vDwc4_SB_phE5t47A.png\",\"https://cdn-images-1.medium.com/max/1100/1*D44vlTHB5ZWExCXDgwzJZw.png\",\"https://cdn-images-1.medium.com/max/1100/1*1wj2iH2vJvvJ3feuxHuL1A.png\",\"https://cdn-images-1.medium.com/max/1100/1*cuvNS1ak0C-IpMGagE4L-w.png\",\"https://cdn-images-1.medium.com/max/1100/1*bD5rCP4lXHHv4P-KemJ-bw.png\",\"https://cdn-images-1.medium.com/max/1100/1*i3-Bcb2qPP8x9LrkXbb_Xw.png\",\"https://cdn-images-1.medium.com/max/1100/1*9Ab163JNBaGIv5ghdR9tzg.png\",\"https://cdn-images-1.medium.com/max/1100/1*ySpIPQF_IUh08Xnra41zpw.png\"],\"links\":[\"http://t.me/MerkleTrader\",\"https://www.tradingview.com/x/pjQmUeYg/\",\"http://stockcharts.com/school/doku.php?id=chart_school:chart_analysis:chart_patterns:double_bottom_reversal\",\"https://www.tradingview.com/x/aA7ppqvz/\",\"https://www.tradingview.com/x/eGxz6uMf/\",\"https://www.tradingview.com/x/6QLQYcSD/\",\"https://www.tradingview.com/x/fyofPX03/\",\"https://www.tradingview.com/x/J92pOnkX/\",\"https://www.tradingview.com/x/BbY2yVlN/\",\"https://www.tradingview.com/x/fPQPoQb2/\",\"https://www.tradingview.com/x/5ygRMXpM/\",\"https://www.tradingview.com/x/iNODsJ8k/\",\"https://www.tradingview.com/x/YIxsrGGF/\"],\"app\":\"steemit/0.1\",\"format\":\"markdown\"}"
}
]
}2018/09/20 06:29:45
2018/09/20 06:29:45
| parent author | proofofresearch |
| parent permlink | bitcoin-price-analysis-re-test-before-move-up |
| author | renat |
| permlink | re-proofofresearch-bitcoin-price-analysis-re-test-before-move-up-20180920t062946968z |
| title | |
| body | @proofofresearch |
| json metadata | {"tags":["bitcoin"],"users":["proofofresearch"],"app":"steemit/0.1"} |
| Transaction Info | Block #26102695/Trx be63a53e4323e0ea58e8b60730f92962cc481172 |
View Raw JSON Data
{
  "trx_id": "be63a53e4323e0ea58e8b60730f92962cc481172",
  "block": 26102695,
  "trx_in_block": 29,
  "op_in_trx": 0,
  "virtual_op": 0,
  "timestamp": "2018-09-20T06:29:45",
  "op": [
    "comment",
    {
      "parent_author": "proofofresearch",
      "parent_permlink": "bitcoin-price-analysis-re-test-before-move-up",
      "author": "renat",
      "permlink": "re-proofofresearch-bitcoin-price-analysis-re-test-before-move-up-20180920t062946968z",
      "title": "",
      "body": "@proofofresearch",
      "json_metadata": "{\"tags\":[\"bitcoin\"],\"users\":[\"proofofresearch\"],\"app\":\"steemit/0.1\"}"
    }
  ]
}cryptomazinupvoted (100.00%) @proofofresearch / bitcoin-denial-of-service-vulnerability-found-in-the-code2018/09/19 11:12:48
cryptomazinupvoted (100.00%) @proofofresearch / bitcoin-denial-of-service-vulnerability-found-in-the-code
2018/09/19 11:12:48
| voter | cryptomazin |
| author | proofofresearch |
| permlink | bitcoin-denial-of-service-vulnerability-found-in-the-code |
| weight | 10000 (100.00%) |
| Transaction Info | Block #26079559/Trx 282116dfce4cc9ac660a91da0b3d001b196a6886 |
View Raw JSON Data
{
  "trx_id": "282116dfce4cc9ac660a91da0b3d001b196a6886",
  "block": 26079559,
  "trx_in_block": 26,
  "op_in_trx": 0,
  "virtual_op": 0,
  "timestamp": "2018-09-19T11:12:48",
  "op": [
    "vote",
    {
      "voter": "cryptomazin",
      "author": "proofofresearch",
      "permlink": "bitcoin-denial-of-service-vulnerability-found-in-the-code",
      "weight": 10000
    }
  ]
}sensationupvoted (100.00%) @proofofresearch / bitcoin-denial-of-service-vulnerability-found-in-the-code2018/09/19 05:54:27
sensationupvoted (100.00%) @proofofresearch / bitcoin-denial-of-service-vulnerability-found-in-the-code
2018/09/19 05:54:27
| voter | sensation |
| author | proofofresearch |
| permlink | bitcoin-denial-of-service-vulnerability-found-in-the-code |
| weight | 10000 (100.00%) |
| Transaction Info | Block #26073194/Trx e7a1744d3e90cca4b4a55e177b710489b99c5dc6 |
View Raw JSON Data
{
  "trx_id": "e7a1744d3e90cca4b4a55e177b710489b99c5dc6",
  "block": 26073194,
  "trx_in_block": 14,
  "op_in_trx": 0,
  "virtual_op": 0,
  "timestamp": "2018-09-19T05:54:27",
  "op": [
    "vote",
    {
      "voter": "sensation",
      "author": "proofofresearch",
      "permlink": "bitcoin-denial-of-service-vulnerability-found-in-the-code",
      "weight": 10000
    }
  ]
}2018/09/19 04:35:51
2018/09/19 04:35:51
| voter | rich.art.deluxe |
| author | proofofresearch |
| permlink | bitcoin-denial-of-service-vulnerability-found-in-the-code |
| weight | 10000 (100.00%) |
| Transaction Info | Block #26071624/Trx 5131ba0e8f20570754b3e04bb952cf1a86319998 |
View Raw JSON Data
{
  "trx_id": "5131ba0e8f20570754b3e04bb952cf1a86319998",
  "block": 26071624,
  "trx_in_block": 8,
  "op_in_trx": 0,
  "virtual_op": 0,
  "timestamp": "2018-09-19T04:35:51",
  "op": [
    "vote",
    {
      "voter": "rich.art.deluxe",
      "author": "proofofresearch",
      "permlink": "bitcoin-denial-of-service-vulnerability-found-in-the-code",
      "weight": 10000
    }
  ]
}2018/09/19 04:32:15
2018/09/19 04:32:15
| voter | largeadultson |
| author | proofofresearch |
| permlink | bitcoin-denial-of-service-vulnerability-found-in-the-code |
| weight | 1000 (10.00%) |
| Transaction Info | Block #26071552/Trx bea441388b468d77ed4a41ceaa2bf5201e3e3c44 |
View Raw JSON Data
{
  "trx_id": "bea441388b468d77ed4a41ceaa2bf5201e3e3c44",
  "block": 26071552,
  "trx_in_block": 3,
  "op_in_trx": 0,
  "virtual_op": 0,
  "timestamp": "2018-09-19T04:32:15",
  "op": [
    "vote",
    {
      "voter": "largeadultson",
      "author": "proofofresearch",
      "permlink": "bitcoin-denial-of-service-vulnerability-found-in-the-code",
      "weight": 1000
    }
  ]
}proofofresearchpublished a new post: bitcoin-denial-of-service-vulnerability-found-in-the-code2018/09/19 04:25:21
proofofresearchpublished a new post: bitcoin-denial-of-service-vulnerability-found-in-the-code
2018/09/19 04:25:21
| parent author | |
| parent permlink | bitcoin |
| author | proofofresearch |
| permlink | bitcoin-denial-of-service-vulnerability-found-in-the-code |
| title | Bitcoin Denial of Service Vulnerability Found in the Code |
| body | # Bitcoin Denial of Service Vulnerability Found in the Code  # Introduction Today, on September, 18th, 2018, there was a ‘vulnerability’ in the Bitcoin client (specifically versions 0.14.0 and 0.16.2) that were identified by an anonymous reporter via [Bitcoin Core’s main repository.](https://github.com/bitcoin/bitcoin/pull/14247) There has [since been a fix](https://github.com/bitcoin/bitcoin/blob/master/doc/release-notes/release-notes-0.16.3.md#denial-of-service-vulnerability) that was released formally by [Pierre Rochard,](https://twitter.com/pierre_rochard) a developer (?) on the Core team. According to the documentation of the fix, posted in the GitHub cited above, > “A denial-of-service vulnerability (CVE-2018–17144) exploitable by miners has been discovered in Bitcoin Core versions 0.14.0 up to 0.16.2. It is recommended to upgrade any of the vulnerable versions to 0.16.3 as soon as possible.” # Description of the Issue The issue, which was exposed to a greater audience via a Reddit post, appears be borne from a flaw in the compilation of transaction data on the protocol. Specifically, [this mailchimp newsletter,](https://mailchi.mp/cc96f82565eb/bitcoin-optech-newsletter-13?e=cbe2b70569) referenced in the Pierre Rochard pull request, covers the issue in greater depth. **_In the newsletter, it states:_** > “ **Upgrade to Bitcoin Core 0.16.3 to fix denial-of-service vulnerability:** a bug introduced in Bitcoin Core 0.14.0 and affecting all subsequent versions through to 0.16.2 will cause Bitcoin Core to crash when attempting to validate a block containing a transaction that attempts to spend the same input twice. Such blocks would be invalid and so can only be created by miners willing to lose the allowed income from having created a block (at least 12.5 XBT or $80,000 USD).” Herein lies the vulnerability, as described above. While it may seem insignificant at face value, it could actually cause considerable issues on the network. Before explaining some of the issues that it could cause, its best to first make sure that we’re caught up to speed on what a Denial of Service attack is and what it means in the context of blockchain, specifically Bitcoin. # What is a Denial of Service Attack? According to us-cert.gov, > “ A denial-of-service (DoS) attack occurs when legitimate users are unable to access information systems, devices, or other network resources due to the actions of a malicious cyber threat actor. Services affected may include email, websites, online accounts (e.g., banking), or other services that rely on the affected computer or network. A denial-of-service is accomplished by flooding the targeted host or network with traffic until the target cannot respond or simply crashes, preventing access for legitimate users. DoS attacks can cost an organization both time and money while their resources and services are inaccessible.” What’s stated above is a bit of a mouthful, but it does accurately describe what a Denial of Service tends to be. Now, in the context of blockchain, since it is a decentralized protocol, a denial of service attack is not the exact equivalent in this case (typically, it renders a network inaccessible), but the fundamental principle is the same. # One of Satoshi’s Main Concerns was Preventing DoS Attacks on Bitcoin In order to assess the impact of a DoS attack on Bitcoin, we need not look any further than at the forum posts [posted by Satoshi Nakamoto himself.](https://bitcointalk.org/index.php?topic=788.msg8804#msg8804) [**_Where is the separate discussion devoted to possible Bitcoin weaknesses._** Where is the separate discussion devoted to possible Bitcoin weaknesses.bitcointalk.org](https://bitcointalk.org/index.php?topic=788.msg8804#msg8804 "https://bitcointalk.org/index.php?topic=788.msg8804#msg8804")[](https://bitcointalk.org/index.php?topic=788.msg8804#msg8804) In the conversation cited above, Satoshi admitted that he/she/they were musing the possibility of adding a PoW operation to transactions in order to ensure their validity and prevent a DoS attack via a flood of inaccurate transactions. The greater alternative that was decided upon by Satoshi was to just create a fee market while giving miners the option to only mine transactions that contained the greatest fees. The logic behind this decision was that, if the mempool became clogged with illicit/fraudulent transactions, then users would be able to ‘bid’ with other users to have their transactions mined by applying a fee to the network (which miners would receive for successfully mining a block that included said transactions). By doing so, Satoshi reasoned that this would undermine a DoS attack by simply allowing the legitimate actors (on the user-facing end) to get their transactions confirmed without delay by simply offering a higher fee to the miners for mining their transaction. In such a situation, an attacker would need to outbid the majority of legitimate actors on the protocol in order to ensure that they accomplished their mission, because their transactions would be reviewed first before the others, thus creating a lull in the chain. ## Assessing Satoshi’s Fee Model Method for Preventing DoS Attacks While Satoshi’s method of preventing DoS attacks is not bullet proof and there were tertiary consequences to its implementation that were not felt until years later (i.e., the 1 MB block limit being hit, resulting in an excess amount of TXs in the mempool, which spiked the fee rate on the protocol exponentially), it still proves to be the most effective and least invasive means of preventing a DoS attack. And, the core philosophy (pun intended), mirrors Satoshi’s to the extent that security has been considered paramount to the efficiency of the chain itself. **_Here are some of the implementations of DoS-prevention measures on Bitcoin:_**   Source: [https://en.bitcoin.it/wiki/Weaknesses#Denial_of_Service_.28DoS.29_attacks](https://en.bitcoin.it/wiki/Weaknesses#Denial_of_Service_.28DoS.29_attacks) # Potential Threats in the [Patched] DoS Susceptibility in Older Bitcoin Client Versions (0.16.2 & 0.14) Based on what we know, the obvious threat comes from the fact that invalid transactions being mined would result in the failure of nodes on the above listed clients. This means that the attack vector inherent in this incident would stem from a miner mining an invalid block purposefully, which would be a waste of the resources that are necessary to fulfill the Proof of Work as well as the forfeited block reward (12.5 BTC at the time of writing). However, they would succeed in knocking out a number of nodes on the network, which could then open the network up to more nefarious attacks. A full node is not necessary for mining, but it is rare that any mining operations would be running on the protocol without one, since it is helpful to know when a block has been propagated to the network. It is also not entirely uncommon that an incorrect block could be propagated to the network. # Conclusion After review of the issue and the subsequent fix, it appears that the issue itself is under control. As to how the issue itself manifested in the code of Bitcoin Core is a question that remains unanswered at this point in time, but the important thing for Bitcoin users is that it has been fixed. Again, more information can be found in the links posted throughout this piece. |
| json metadata | {"tags":["bitcoin","crypto","cryptocurrency","priceanalysis","technicalanalysis"],"image":["https://cdn-images-1.medium.com/max/1100/1*6UljVewFLVW2_z4nGdM9cg.gif","https://cdn-images-1.medium.com/max/1375/1*dkMwx5wQ_CtgCoIQCRW3uw.png","https://cdn-images-1.medium.com/max/1375/1*YudHeX83Bozq5Jjt6N9MoA.png"],"links":["https://github.com/bitcoin/bitcoin/pull/14247","https://github.com/bitcoin/bitcoin/blob/master/doc/release-notes/release-notes-0.16.3.md#denial-of-service-vulnerability","https://twitter.com/pierre_rochard","https://mailchi.mp/cc96f82565eb/bitcoin-optech-newsletter-13?e=cbe2b70569","https://bitcointalk.org/index.php?topic=788.msg8804#msg8804","https://en.bitcoin.it/wiki/Weaknesses#Denial_of_Service_.28DoS.29_attacks"],"app":"steemit/0.1","format":"markdown"} |
| Transaction Info | Block #26071414/Trx c572fe507154ac2c697e05183fd47877f8631eaf |
View Raw JSON Data
{
"trx_id": "c572fe507154ac2c697e05183fd47877f8631eaf",
"block": 26071414,
"trx_in_block": 12,
"op_in_trx": 0,
"virtual_op": 0,
"timestamp": "2018-09-19T04:25:21",
"op": [
"comment",
{
"parent_author": "",
"parent_permlink": "bitcoin",
"author": "proofofresearch",
"permlink": "bitcoin-denial-of-service-vulnerability-found-in-the-code",
"title": "Bitcoin Denial of Service Vulnerability Found in the Code",
"body": "# Bitcoin Denial of Service Vulnerability Found in the Code\n\n\n\n# Introduction\n\nToday, on September, 18th, 2018, there was a ‘vulnerability’ in the Bitcoin client (specifically versions 0.14.0 and 0.16.2) that were identified by an anonymous reporter via [Bitcoin Core’s main repository.](https://github.com/bitcoin/bitcoin/pull/14247)\n\nThere has [since been a fix](https://github.com/bitcoin/bitcoin/blob/master/doc/release-notes/release-notes-0.16.3.md#denial-of-service-vulnerability) that was released formally by [Pierre Rochard,](https://twitter.com/pierre_rochard) a developer (?) on the Core team.\n\nAccording to the documentation of the fix, posted in the GitHub cited above,\n\n> “A denial-of-service vulnerability (CVE-2018–17144) exploitable by miners has been discovered in Bitcoin Core versions 0.14.0 up to 0.16.2. It is recommended to upgrade any of the vulnerable versions to 0.16.3 as soon as possible.”\n\n# Description of the Issue\n\nThe issue, which was exposed to a greater audience via a Reddit post, appears be borne from a flaw in the compilation of transaction data on the protocol.\n\nSpecifically, [this mailchimp newsletter,](https://mailchi.mp/cc96f82565eb/bitcoin-optech-newsletter-13?e=cbe2b70569) referenced in the Pierre Rochard pull request, covers the issue in greater depth.\n\n**_In the newsletter, it states:_**\n\n> “ **Upgrade to Bitcoin Core 0.16.3 to fix denial-of-service vulnerability:** a bug introduced in Bitcoin Core 0.14.0 and affecting all subsequent versions through to 0.16.2 will cause Bitcoin Core to crash when attempting to validate a block containing a transaction that attempts to spend the same input twice. Such blocks would be invalid and so can only be created by miners willing to lose the allowed income from having created a block (at least 12.5 XBT or $80,000 USD).”\n\nHerein lies the vulnerability, as described above.\n\nWhile it may seem insignificant at face value, it could actually cause considerable issues on the network.\n\nBefore explaining some of the issues that it could cause, its best to first make sure that we’re caught up to speed on what a Denial of Service attack is and what it means in the context of blockchain, specifically Bitcoin.\n\n# What is a Denial of Service Attack?\n\nAccording to us-cert.gov,\n\n> “ A denial-of-service (DoS) attack occurs when legitimate users are unable to access information systems, devices, or other network resources due to the actions of a malicious cyber threat actor. Services affected may include email, websites, online accounts (e.g., banking), or other services that rely on the affected computer or network. A denial-of-service is accomplished by flooding the targeted host or network with traffic until the target cannot respond or simply crashes, preventing access for legitimate users. DoS attacks can cost an organization both time and money while their resources and services are inaccessible.”\n\nWhat’s stated above is a bit of a mouthful, but it does accurately describe what a Denial of Service tends to be.\n\nNow, in the context of blockchain, since it is a decentralized protocol, a denial of service attack is not the exact equivalent in this case (typically, it renders a network inaccessible), but the fundamental principle is the same.\n\n# One of Satoshi’s Main Concerns was Preventing DoS Attacks on Bitcoin\n\nIn order to assess the impact of a DoS attack on Bitcoin, we need not look any further than at the forum posts [posted by Satoshi Nakamoto himself.](https://bitcointalk.org/index.php?topic=788.msg8804#msg8804)\n\n[**_Where is the separate discussion devoted to possible Bitcoin weaknesses._** \nWhere is the separate discussion devoted to possible Bitcoin weaknesses.bitcointalk.org](https://bitcointalk.org/index.php?topic=788.msg8804#msg8804 \"https://bitcointalk.org/index.php?topic=788.msg8804#msg8804\")[](https://bitcointalk.org/index.php?topic=788.msg8804#msg8804)\n\nIn the conversation cited above, Satoshi admitted that he/she/they were musing the possibility of adding a PoW operation to transactions in order to ensure their validity and prevent a DoS attack via a flood of inaccurate transactions.\n\nThe greater alternative that was decided upon by Satoshi was to just create a fee market while giving miners the option to only mine transactions that contained the greatest fees.\n\nThe logic behind this decision was that, if the mempool became clogged with illicit/fraudulent transactions, then users would be able to ‘bid’ with other users to have their transactions mined by applying a fee to the network (which miners would receive for successfully mining a block that included said transactions).\n\nBy doing so, Satoshi reasoned that this would undermine a DoS attack by simply allowing the legitimate actors (on the user-facing end) to get their transactions confirmed without delay by simply offering a higher fee to the miners for mining their transaction. In such a situation, an attacker would need to outbid the majority of legitimate actors on the protocol in order to ensure that they accomplished their mission, because their transactions would be reviewed first before the others, thus creating a lull in the chain.\n\n## Assessing Satoshi’s Fee Model Method for Preventing DoS Attacks\n\nWhile Satoshi’s method of preventing DoS attacks is not bullet proof and there were tertiary consequences to its implementation that were not felt until years later (i.e., the 1 MB block limit being hit, resulting in an excess amount of TXs in the mempool, which spiked the fee rate on the protocol exponentially), it still proves to be the most effective and least invasive means of preventing a DoS attack. And, the core philosophy (pun intended), mirrors Satoshi’s to the extent that security has been considered paramount to the efficiency of the chain itself.\n\n**_Here are some of the implementations of DoS-prevention measures on Bitcoin:_**\n\n\n\n\n\nSource: [https://en.bitcoin.it/wiki/Weaknesses#Denial_of_Service_.28DoS.29_attacks](https://en.bitcoin.it/wiki/Weaknesses#Denial_of_Service_.28DoS.29_attacks)\n\n# Potential Threats in the [Patched] DoS Susceptibility in Older Bitcoin Client Versions (0.16.2 & 0.14)\n\nBased on what we know, the obvious threat comes from the fact that invalid transactions being mined would result in the failure of nodes on the above listed clients.\n\nThis means that the attack vector inherent in this incident would stem from a miner mining an invalid block purposefully, which would be a waste of the resources that are necessary to fulfill the Proof of Work as well as the forfeited block reward (12.5 BTC at the time of writing). However, they would succeed in knocking out a number of nodes on the network, which could then open the network up to more nefarious attacks.\n\nA full node is not necessary for mining, but it is rare that any mining operations would be running on the protocol without one, since it is helpful to know when a block has been propagated to the network. It is also not entirely uncommon that an incorrect block could be propagated to the network.\n\n# Conclusion\n\nAfter review of the issue and the subsequent fix, it appears that the issue itself is under control.\n\nAs to how the issue itself manifested in the code of Bitcoin Core is a question that remains unanswered at this point in time, but the important thing for Bitcoin users is that it has been fixed.\n\nAgain, more information can be found in the links posted throughout this piece.",
"json_metadata": "{\"tags\":[\"bitcoin\",\"crypto\",\"cryptocurrency\",\"priceanalysis\",\"technicalanalysis\"],\"image\":[\"https://cdn-images-1.medium.com/max/1100/1*6UljVewFLVW2_z4nGdM9cg.gif\",\"https://cdn-images-1.medium.com/max/1375/1*dkMwx5wQ_CtgCoIQCRW3uw.png\",\"https://cdn-images-1.medium.com/max/1375/1*YudHeX83Bozq5Jjt6N9MoA.png\"],\"links\":[\"https://github.com/bitcoin/bitcoin/pull/14247\",\"https://github.com/bitcoin/bitcoin/blob/master/doc/release-notes/release-notes-0.16.3.md#denial-of-service-vulnerability\",\"https://twitter.com/pierre_rochard\",\"https://mailchi.mp/cc96f82565eb/bitcoin-optech-newsletter-13?e=cbe2b70569\",\"https://bitcointalk.org/index.php?topic=788.msg8804#msg8804\",\"https://en.bitcoin.it/wiki/Weaknesses#Denial_of_Service_.28DoS.29_attacks\"],\"app\":\"steemit/0.1\",\"format\":\"markdown\"}"
}
]
}proofofresearchpublished a new post: 3ny4w4-monero-price-analysis2018/09/19 01:51:54
proofofresearchpublished a new post: 3ny4w4-monero-price-analysis
2018/09/19 01:51:54
| parent author | |
| parent permlink | bitcoin |
| author | proofofresearch |
| permlink | 3ny4w4-monero-price-analysis |
| title | Monero Price Analysis |
| body | # Monero Price Analysis  # Foreword Given Monero’s bullish price action as of late, it has received a slew of attention around the crypto community for its stellar performance. Therefore, we’re going to go ahead and cover the coin again to see what’s happened since we last took a look at it. The former price analysis on Monero can be found [here](https://medium.com/@proofofresearch/monero-price-analysis-bounce-possible-unfinished-draft-29c8900bae96) and [here.](https://www.tradingview.com/chart/XMRUSD/xeuy8OUz-Monero-Price-Analysis-Feast-or-Famine-Version/) # Monero Price Analysis  [https://www.tradingview.com/x/fqSLKtAt/](https://www.tradingview.com/x/fqSLKtAt/) The chart above displays the XMR/BTC pairing on the H4. The second panel shows the Zero_n0ncense BoP RSI Xtreme (unreleased). This indicator takes the Balance of Power and shifts it to an RSI scale in a smoothed manner while infusing a couple of additional elements to dictate signals of impending reversal. The purpose of this indicator is to allow the trader to anticipate a reversal in the price as early as possible. As we can see in the picture above, the BoP RSI Xtreme was effective in doing just that.  [https://www.tradingview.com/x/OoSE38Sr/](https://www.tradingview.com/x/OoSE38Sr/) From this along with past data, we can validate that this indicator is valid. We’ll keep that in our backpocket when assessing additional XMR charts on different time frames and against the USD/USDT pairing. # Monero On the Daily (XMR / BTC )  [https://www.tradingview.com/x/wSSSx5HM/](https://www.tradingview.com/x/wSSSx5HM/)  [https://www.tradingview.com/x/1nRy2tLP/](https://www.tradingview.com/x/1nRy2tLP/) What should be immediately apparent to those that are looking at the chart for the first time is that the uptrend that’s been in effect since late August has held true. If the price of Monero holds on the daily, then this would be the third time that the uptrend has been tested successfully without a throwback in the price. The transparent green boxes in the picture above symbolize the three times that this uptrend line has been tested. According to modern trading theory, the third time’s the charm (i.e., if a line is tested more than three times, it can be considered ‘valid’; only two times is iffy). # This is Coming Off the Double Bottom On the Daily (Significant)  [https://www.tradingview.com/x/I0deMdvM/](https://www.tradingview.com/x/I0deMdvM/)  [https://www.tradingview.com/x/uQg29FMk/](https://www.tradingview.com/x/uQg29FMk/)  Source: [https://stockcharts.com/school/doku.php?id=chart_school:chart_analysis:chart_patterns:double_bottom_reversal](https://stockcharts.com/school/doku.php?id=chart_school:chart_analysis:chart_patterns:double_bottom_reversal) What’s even more important to remember than the ‘target’ that’s established by the double-bottom pattern is the fact that it most often indicates that there is a trend reversal of some sort that has occurred. Reversal does not mean trend break. Thus, a trend reversal from a downtrend = uptrend. And indeed, the uptrend did begin on the second dip of the ‘W’. # Looking at the Potential Future Price Action For Monero  [https://www.tradingview.com/x/67jnn1hI/](https://www.tradingview.com/x/67jnn1hI/) So, the takeaway here is that the price is pretty firmly nestled with the uptrend serving as a reliable support (at this point) on the daily with an additional support point that exists right below the current price. # Exponential Moving Averages  [https://www.tradingview.com/x/vXEct0nE/](https://www.tradingview.com/x/vXEct0nE/) On the chart above, we can see the EMA-100 (blue line) and the EMA-200 (purple line). The current value of both exponential moving averages are marked with a dotted dash line. From our studies in EMAs, we know that when the price is above the EMA, it serves as support, when it is below, the EMAs serve as resistance points. Thus, the two EMAs that you can see above are resistance points. **_EMA-100 (daily)_**= .017899 **_EMA-200 (daily)_**= .019673  [https://www.tradingview.com/x/i7vcbThC/](https://www.tradingview.com/x/i7vcbThC/) Here is the takeaway from the three EMA indicators that you see in the chart above: 1. EMA 12 > EMA 26 > EMA 50 = positive; Shows there’s been some subtantive bullish momentum. 2. For Heikin Ashi, the EMA-12 appears to be holding. If it continues to hold, then breaking through the overhead support points that have been established by the EMA-100 and EMA-200 should not be difficult. **_The support points (per EMA) on the chart are as follows:_** EMA-50 = .016823 EMA-26 = .016890 EMA-12 = .017365 The price, at the time of writing is sitting at .017667 To reiterate, the EMA-50 tends to be the most reliable (in crypto at least), when it comes to ‘standing its ground’ as a resistance/support point. This bodes well for Monero bulls. Relative Strength Index (14)  [https://www.tradingview.com/x/Hc5Nz55F/](https://www.tradingview.com/x/Hc5Nz55F/) In the above picture, you’ll spot the RSI(14) for the daily chart. The reason why there are green and red colors are because this is a specialized RSI by the author of the article (like the other one), that is designed to render buy and sell signals. The indicator is currently unreleased (will be avaialable soon). As we can see on the chart above, the RSI(14) has shown stepped improvement and is not currently overbought on the daily. The trendline is placed in the photo to help illustrate the trend of the RSI in general. # Moving Average Convergence Divergence (MACD)  [https://www.tradingview.com/x/mV5FyDxR/](https://www.tradingview.com/x/mV5FyDxR/) While it seems like investors should be wary of the MACD indicator’s reading above (especially since it looks like it just flashed a preliminary sell signal), it should also be noted that there was not a cross in the MACD (that’s the sell/buy signal confirmation). Thus, the trend (uptrend) is still technically confirmed on the daily. The MACD mostly reflects the price action anyway, from the author’s standpoint. The MACD would more than likely signal a sell if there were sideways movement for another day or so, which would be indicative of a technical ‘break’ uptrend that the price is trading against, which would mean that the support point we plotted that’s directly below where the price is now would become the next target. # Conclusion In Conclusion, there are a fair amount of reasons for why one should be very bullish for Monero currently. 1. We’re reviewing the XMR / BTC pairing and not the XMR /USD(T) pairing. This is important because our earlier prediction with Bitcoin anticipated another rise on the price of Bitcoin. Therefore, the price of Monero (USD-wise), may accelerate even further. This opens up the trading strategy of investing in a long position on Monero to enhance one’s fiat profit gains, then consolidating the gains by exiting the position then entering a position in Bitcoin after its next consolidation phase or until another coin is found that shows prolonged appreciation against the price of Bitcoin. 2. The majority of the signals and patterns that we identified on the chart appear to be largely bullish in nature. This is yet another good sign. 3. The sentiment toward Monero has been positive in general. This is something that’s underrated and often overlooked, but it can become a great catalyst for the price action of certain assets/currencies. ## **_R/R Recommendation:_** (Please note, this isn’t financial advice; any trades that you make are your own responsibility)  [https://www.tradingview.com/x/WlLdpaPB/](https://www.tradingview.com/x/WlLdpaPB/) As always, safe trading! For more awesome articles like this, make sure to check out the official blog at blog.zerononcense.com Also, make sure to check out the Telegram as well — t.me/MerkleTrader Reddit = u/randomshortdude Twitter = twitter.com/proofofresearch TradingView = Cryptomedication |
| json metadata | {"tags":["bitcoin","crypto","cryptocurrency","priceanalysis","technicalanalysis"],"image":["https://cdn-images-1.medium.com/max/1500/0*aHRwV-hNXxnsu-Dp.jpg","https://cdn-images-1.medium.com/max/1875/1*TMpxg5VJjeHlMH2k1O3Iig.png","https://cdn-images-1.medium.com/max/1875/1*SX1jc1O_Y-C_n-z4lp6Vlw.png","https://cdn-images-1.medium.com/max/1875/1*1PmKgUDf_Je37uBy60a3XA.png","https://cdn-images-1.medium.com/max/1875/1*ZqhbVB0MgNtfuWKAi6e5Gw.png","https://cdn-images-1.medium.com/max/1875/1*aMPF-eWGQpKgWHCoSNrDaA.png","https://cdn-images-1.medium.com/max/1875/1*s7st04Yz6Qwtyiz4te_E9w.png","https://cdn-images-1.medium.com/max/1875/1*bzKlRLIPxcsIBMW3JrSHCw.png","https://cdn-images-1.medium.com/max/1875/1*b9LKBD_XZ8kj0lqmndmc2w.png","https://cdn-images-1.medium.com/max/1875/1*njj85aBs6qeA8_KSqHlcUQ.png","https://cdn-images-1.medium.com/max/1875/1*PYwkYKRgf-JRMAW40TmQJA.png","https://cdn-images-1.medium.com/max/1875/1*tPGzAW7ostpLa6Ulrdw2nA.png","https://cdn-images-1.medium.com/max/1875/1*W98pLIac_q5uF5do_l_z7Q.png","https://cdn-images-1.medium.com/max/1875/1*qUL7OyebIuv7kZ6YRzTEzw.png"],"links":["https://medium.com/@proofofresearch/monero-price-analysis-bounce-possible-unfinished-draft-29c8900bae96","https://www.tradingview.com/chart/XMRUSD/xeuy8OUz-Monero-Price-Analysis-Feast-or-Famine-Version/","https://www.tradingview.com/x/fqSLKtAt/","https://www.tradingview.com/x/OoSE38Sr/","https://www.tradingview.com/x/wSSSx5HM/","https://www.tradingview.com/x/1nRy2tLP/","https://www.tradingview.com/x/I0deMdvM/","https://www.tradingview.com/x/uQg29FMk/","https://stockcharts.com/school/doku.php?id=chart_school:chart_analysis:chart_patterns:double_bottom_reversal","https://www.tradingview.com/x/67jnn1hI/","https://www.tradingview.com/x/vXEct0nE/","https://www.tradingview.com/x/i7vcbThC/","https://www.tradingview.com/x/Hc5Nz55F/","https://www.tradingview.com/x/mV5FyDxR/","https://www.tradingview.com/x/WlLdpaPB/"],"app":"steemit/0.1","format":"markdown"} |
| Transaction Info | Block #26068349/Trx 4c89026dad50f055e833c2667c1a294771d6e7df |
View Raw JSON Data
{
"trx_id": "4c89026dad50f055e833c2667c1a294771d6e7df",
"block": 26068349,
"trx_in_block": 25,
"op_in_trx": 0,
"virtual_op": 0,
"timestamp": "2018-09-19T01:51:54",
"op": [
"comment",
{
"parent_author": "",
"parent_permlink": "bitcoin",
"author": "proofofresearch",
"permlink": "3ny4w4-monero-price-analysis",
"title": "Monero Price Analysis",
"body": "# Monero Price Analysis\n\n \n\n\n\n# Foreword\n\nGiven Monero’s bullish price action as of late, it has received a slew of attention around the crypto community for its stellar performance.\n\nTherefore, we’re going to go ahead and cover the coin again to see what’s happened since we last took a look at it.\n\nThe former price analysis on Monero can be found [here](https://medium.com/@proofofresearch/monero-price-analysis-bounce-possible-unfinished-draft-29c8900bae96) and [here.](https://www.tradingview.com/chart/XMRUSD/xeuy8OUz-Monero-Price-Analysis-Feast-or-Famine-Version/)\n\n# Monero Price Analysis\n\n\n\n[https://www.tradingview.com/x/fqSLKtAt/](https://www.tradingview.com/x/fqSLKtAt/)\n\nThe chart above displays the XMR/BTC pairing on the H4.\n\nThe second panel shows the Zero_n0ncense BoP RSI Xtreme (unreleased). This indicator takes the Balance of Power and shifts it to an RSI scale in a smoothed manner while infusing a couple of additional elements to dictate signals of impending reversal.\n\nThe purpose of this indicator is to allow the trader to anticipate a reversal in the price as early as possible.\n\nAs we can see in the picture above, the BoP RSI Xtreme was effective in doing just that.\n\n\n\n[https://www.tradingview.com/x/OoSE38Sr/](https://www.tradingview.com/x/OoSE38Sr/)\n\nFrom this along with past data, we can validate that this indicator is valid. We’ll keep that in our backpocket when assessing additional XMR charts on different time frames and against the USD/USDT pairing.\n\n# Monero On the Daily (XMR / BTC )\n\n\n\n[https://www.tradingview.com/x/wSSSx5HM/](https://www.tradingview.com/x/wSSSx5HM/)\n\n\n\n[https://www.tradingview.com/x/1nRy2tLP/](https://www.tradingview.com/x/1nRy2tLP/)\n\nWhat should be immediately apparent to those that are looking at the chart for the first time is that the uptrend that’s been in effect since late August has held true.\n\nIf the price of Monero holds on the daily, then this would be the third time that the uptrend has been tested successfully without a throwback in the price.\n\nThe transparent green boxes in the picture above symbolize the three times that this uptrend line has been tested. According to modern trading theory, the third time’s the charm (i.e., if a line is tested more than three times, it can be considered ‘valid’; only two times is iffy).\n\n# This is Coming Off the Double Bottom On the Daily (Significant)\n\n\n\n[https://www.tradingview.com/x/I0deMdvM/](https://www.tradingview.com/x/I0deMdvM/)\n\n\n\n[https://www.tradingview.com/x/uQg29FMk/](https://www.tradingview.com/x/uQg29FMk/)\n\n\n\nSource: [https://stockcharts.com/school/doku.php?id=chart_school:chart_analysis:chart_patterns:double_bottom_reversal](https://stockcharts.com/school/doku.php?id=chart_school:chart_analysis:chart_patterns:double_bottom_reversal)\n\n \n\nWhat’s even more important to remember than the ‘target’ that’s established by the double-bottom pattern is the fact that it most often indicates that there is a trend reversal of some sort that has occurred.\n\nReversal does not mean trend break. Thus, a trend reversal from a downtrend = uptrend.\n\nAnd indeed, the uptrend did begin on the second dip of the ‘W’.\n\n# Looking at the Potential Future Price Action For Monero\n\n\n\n[https://www.tradingview.com/x/67jnn1hI/](https://www.tradingview.com/x/67jnn1hI/)\n\nSo, the takeaway here is that the price is pretty firmly nestled with the uptrend serving as a reliable support (at this point) on the daily with an additional support point that exists right below the current price.\n\n# Exponential Moving Averages\n\n\n\n[https://www.tradingview.com/x/vXEct0nE/](https://www.tradingview.com/x/vXEct0nE/)\n\nOn the chart above, we can see the EMA-100 (blue line) and the EMA-200 (purple line).\n\nThe current value of both exponential moving averages are marked with a dotted dash line.\n\nFrom our studies in EMAs, we know that when the price is above the EMA, it serves as support, when it is below, the EMAs serve as resistance points.\n\nThus, the two EMAs that you can see above are resistance points.\n\n**_EMA-100 (daily)_**= .017899\n\n**_EMA-200 (daily)_**= .019673\n\n\n\n[https://www.tradingview.com/x/i7vcbThC/](https://www.tradingview.com/x/i7vcbThC/)\n\nHere is the takeaway from the three EMA indicators that you see in the chart above:\n\n1. EMA 12 > EMA 26 > EMA 50 = positive; Shows there’s been some subtantive bullish momentum.\n2. For Heikin Ashi, the EMA-12 appears to be holding. If it continues to hold, then breaking through the overhead support points that have been established by the EMA-100 and EMA-200 should not be difficult.\n\n**_The support points (per EMA) on the chart are as follows:_**\n\nEMA-50 = .016823\n\nEMA-26 = .016890\n\nEMA-12 = .017365\n\nThe price, at the time of writing is sitting at .017667\n\nTo reiterate, the EMA-50 tends to be the most reliable (in crypto at least), when it comes to ‘standing its ground’ as a resistance/support point. This bodes well for Monero bulls.\n\nRelative Strength Index (14)\n\n\n\n[https://www.tradingview.com/x/Hc5Nz55F/](https://www.tradingview.com/x/Hc5Nz55F/)\n\nIn the above picture, you’ll spot the RSI(14) for the daily chart. The reason why there are green and red colors are because this is a specialized RSI by the author of the article (like the other one), that is designed to render buy and sell signals.\n\nThe indicator is currently unreleased (will be avaialable soon).\n\nAs we can see on the chart above, the RSI(14) has shown stepped improvement and is not currently overbought on the daily. The trendline is placed in the photo to help illustrate the trend of the RSI in general.\n\n# Moving Average Convergence Divergence (MACD)\n\n\n\n[https://www.tradingview.com/x/mV5FyDxR/](https://www.tradingview.com/x/mV5FyDxR/)\n\nWhile it seems like investors should be wary of the MACD indicator’s reading above (especially since it looks like it just flashed a preliminary sell signal), it should also be noted that there was not a cross in the MACD (that’s the sell/buy signal confirmation). Thus, the trend (uptrend) is still technically confirmed on the daily.\n\nThe MACD mostly reflects the price action anyway, from the author’s standpoint. The MACD would more than likely signal a sell if there were sideways movement for another day or so, which would be indicative of a technical ‘break’ uptrend that the price is trading against, which would mean that the support point we plotted that’s directly below where the price is now would become the next target.\n\n# Conclusion\n\nIn Conclusion, there are a fair amount of reasons for why one should be very bullish for Monero currently.\n\n1. We’re reviewing the XMR / BTC pairing and not the XMR /USD(T) pairing. This is important because our earlier prediction with Bitcoin anticipated another rise on the price of Bitcoin. Therefore, the price of Monero (USD-wise), may accelerate even further. This opens up the trading strategy of investing in a long position on Monero to enhance one’s fiat profit gains, then consolidating the gains by exiting the position then entering a position in Bitcoin after its next consolidation phase or until another coin is found that shows prolonged appreciation against the price of Bitcoin.\n2. The majority of the signals and patterns that we identified on the chart appear to be largely bullish in nature. This is yet another good sign.\n3. The sentiment toward Monero has been positive in general. This is something that’s underrated and often overlooked, but it can become a great catalyst for the price action of certain assets/currencies.\n\n## **_R/R Recommendation:_**\n\n(Please note, this isn’t financial advice; any trades that you make are your own responsibility)\n\n\n\n[https://www.tradingview.com/x/WlLdpaPB/](https://www.tradingview.com/x/WlLdpaPB/)\n\nAs always, safe trading!\n\nFor more awesome articles like this, make sure to check out the official blog at blog.zerononcense.com\n\nAlso, make sure to check out the Telegram as well — t.me/MerkleTrader\n\nReddit = u/randomshortdude\n\nTwitter = twitter.com/proofofresearch\n\nTradingView = Cryptomedication",
"json_metadata": "{\"tags\":[\"bitcoin\",\"crypto\",\"cryptocurrency\",\"priceanalysis\",\"technicalanalysis\"],\"image\":[\"https://cdn-images-1.medium.com/max/1500/0*aHRwV-hNXxnsu-Dp.jpg\",\"https://cdn-images-1.medium.com/max/1875/1*TMpxg5VJjeHlMH2k1O3Iig.png\",\"https://cdn-images-1.medium.com/max/1875/1*SX1jc1O_Y-C_n-z4lp6Vlw.png\",\"https://cdn-images-1.medium.com/max/1875/1*1PmKgUDf_Je37uBy60a3XA.png\",\"https://cdn-images-1.medium.com/max/1875/1*ZqhbVB0MgNtfuWKAi6e5Gw.png\",\"https://cdn-images-1.medium.com/max/1875/1*aMPF-eWGQpKgWHCoSNrDaA.png\",\"https://cdn-images-1.medium.com/max/1875/1*s7st04Yz6Qwtyiz4te_E9w.png\",\"https://cdn-images-1.medium.com/max/1875/1*bzKlRLIPxcsIBMW3JrSHCw.png\",\"https://cdn-images-1.medium.com/max/1875/1*b9LKBD_XZ8kj0lqmndmc2w.png\",\"https://cdn-images-1.medium.com/max/1875/1*njj85aBs6qeA8_KSqHlcUQ.png\",\"https://cdn-images-1.medium.com/max/1875/1*PYwkYKRgf-JRMAW40TmQJA.png\",\"https://cdn-images-1.medium.com/max/1875/1*tPGzAW7ostpLa6Ulrdw2nA.png\",\"https://cdn-images-1.medium.com/max/1875/1*W98pLIac_q5uF5do_l_z7Q.png\",\"https://cdn-images-1.medium.com/max/1875/1*qUL7OyebIuv7kZ6YRzTEzw.png\"],\"links\":[\"https://medium.com/@proofofresearch/monero-price-analysis-bounce-possible-unfinished-draft-29c8900bae96\",\"https://www.tradingview.com/chart/XMRUSD/xeuy8OUz-Monero-Price-Analysis-Feast-or-Famine-Version/\",\"https://www.tradingview.com/x/fqSLKtAt/\",\"https://www.tradingview.com/x/OoSE38Sr/\",\"https://www.tradingview.com/x/wSSSx5HM/\",\"https://www.tradingview.com/x/1nRy2tLP/\",\"https://www.tradingview.com/x/I0deMdvM/\",\"https://www.tradingview.com/x/uQg29FMk/\",\"https://stockcharts.com/school/doku.php?id=chart_school:chart_analysis:chart_patterns:double_bottom_reversal\",\"https://www.tradingview.com/x/67jnn1hI/\",\"https://www.tradingview.com/x/vXEct0nE/\",\"https://www.tradingview.com/x/i7vcbThC/\",\"https://www.tradingview.com/x/Hc5Nz55F/\",\"https://www.tradingview.com/x/mV5FyDxR/\",\"https://www.tradingview.com/x/WlLdpaPB/\"],\"app\":\"steemit/0.1\",\"format\":\"markdown\"}"
}
]
}2018/09/18 15:39:27
2018/09/18 15:39:27
| parent author | proofofresearch |
| parent permlink | bitcoin-price-analysis-re-test-before-move-up |
| author | surikowstepanuk |
| permlink | re-proofofresearch-bitcoin-price-analysis-re-test-before-move-up-20180918t153928332z |
| title | |
| body | @proofofresearch, you are interested in reading, maybe you read me too |
| json metadata | {"tags":["bitcoin"],"users":["proofofresearch"],"app":"steemit/0.1"} |
| Transaction Info | Block #26056192/Trx 9957a8456f36673b5cc880c4ebe06aa341a3d0e1 |
View Raw JSON Data
{
  "trx_id": "9957a8456f36673b5cc880c4ebe06aa341a3d0e1",
  "block": 26056192,
  "trx_in_block": 24,
  "op_in_trx": 0,
  "virtual_op": 0,
  "timestamp": "2018-09-18T15:39:27",
  "op": [
    "comment",
    {
      "parent_author": "proofofresearch",
      "parent_permlink": "bitcoin-price-analysis-re-test-before-move-up",
      "author": "surikowstepanuk",
      "permlink": "re-proofofresearch-bitcoin-price-analysis-re-test-before-move-up-20180918t153928332z",
      "title": "",
      "body": "@proofofresearch, you are interested in reading, maybe you read me too",
      "json_metadata": "{\"tags\":[\"bitcoin\"],\"users\":[\"proofofresearch\"],\"app\":\"steemit/0.1\"}"
    }
  ]
}sensationupvoted (100.00%) @proofofresearch / bitcoin-price-analysis-re-test-before-move-up2018/09/18 07:56:00
sensationupvoted (100.00%) @proofofresearch / bitcoin-price-analysis-re-test-before-move-up
2018/09/18 07:56:00
| voter | sensation |
| author | proofofresearch |
| permlink | bitcoin-price-analysis-re-test-before-move-up |
| weight | 10000 (100.00%) |
| Transaction Info | Block #26047089/Trx b2bc1a4277e425feeffd351854b81ebb29970522 |
View Raw JSON Data
{
  "trx_id": "b2bc1a4277e425feeffd351854b81ebb29970522",
  "block": 26047089,
  "trx_in_block": 8,
  "op_in_trx": 0,
  "virtual_op": 0,
  "timestamp": "2018-09-18T07:56:00",
  "op": [
    "vote",
    {
      "voter": "sensation",
      "author": "proofofresearch",
      "permlink": "bitcoin-price-analysis-re-test-before-move-up",
      "weight": 10000
    }
  ]
}moby-dickupvoted (100.00%) @proofofresearch / bitcoin-price-analysis-re-test-before-move-up2018/09/18 07:45:27
moby-dickupvoted (100.00%) @proofofresearch / bitcoin-price-analysis-re-test-before-move-up
2018/09/18 07:45:27
| voter | moby-dick |
| author | proofofresearch |
| permlink | bitcoin-price-analysis-re-test-before-move-up |
| weight | 10000 (100.00%) |
| Transaction Info | Block #26046884/Trx 2b130e3b28edeba0553400570c9b465cf48188cc |
View Raw JSON Data
{
  "trx_id": "2b130e3b28edeba0553400570c9b465cf48188cc",
  "block": 26046884,
  "trx_in_block": 0,
  "op_in_trx": 0,
  "virtual_op": 0,
  "timestamp": "2018-09-18T07:45:27",
  "op": [
    "vote",
    {
      "voter": "moby-dick",
      "author": "proofofresearch",
      "permlink": "bitcoin-price-analysis-re-test-before-move-up",
      "weight": 10000
    }
  ]
}hr1upvoted (0.02%) @proofofresearch / bitcoin-price-analysis-re-test-before-move-up2018/09/18 07:25:27
hr1upvoted (0.02%) @proofofresearch / bitcoin-price-analysis-re-test-before-move-up
2018/09/18 07:25:27
| voter | hr1 |
| author | proofofresearch |
| permlink | bitcoin-price-analysis-re-test-before-move-up |
| weight | 2 (0.02%) |
| Transaction Info | Block #26046496/Trx 3d79f56d2be28c3ed8bdcd11a90cb6fe098cbf85 |
View Raw JSON Data
{
  "trx_id": "3d79f56d2be28c3ed8bdcd11a90cb6fe098cbf85",
  "block": 26046496,
  "trx_in_block": 9,
  "op_in_trx": 0,
  "virtual_op": 0,
  "timestamp": "2018-09-18T07:25:27",
  "op": [
    "vote",
    {
      "voter": "hr1",
      "author": "proofofresearch",
      "permlink": "bitcoin-price-analysis-re-test-before-move-up",
      "weight": 2
    }
  ]
}thanksmiaupvoted (100.00%) @proofofresearch / bitcoin-price-analysis-re-test-before-move-up2018/09/18 07:16:03
thanksmiaupvoted (100.00%) @proofofresearch / bitcoin-price-analysis-re-test-before-move-up
2018/09/18 07:16:03
| voter | thanksmia |
| author | proofofresearch |
| permlink | bitcoin-price-analysis-re-test-before-move-up |
| weight | 10000 (100.00%) |
| Transaction Info | Block #26046314/Trx 8e3d054554f70758f2598ca8840d146a0475b449 |
View Raw JSON Data
{
  "trx_id": "8e3d054554f70758f2598ca8840d146a0475b449",
  "block": 26046314,
  "trx_in_block": 12,
  "op_in_trx": 0,
  "virtual_op": 0,
  "timestamp": "2018-09-18T07:16:03",
  "op": [
    "vote",
    {
      "voter": "thanksmia",
      "author": "proofofresearch",
      "permlink": "bitcoin-price-analysis-re-test-before-move-up",
      "weight": 10000
    }
  ]
}martintrottupvoted (100.00%) @proofofresearch / bitcoin-price-analysis-re-test-before-move-up2018/09/18 06:58:39
martintrottupvoted (100.00%) @proofofresearch / bitcoin-price-analysis-re-test-before-move-up
2018/09/18 06:58:39
| voter | martintrott |
| author | proofofresearch |
| permlink | bitcoin-price-analysis-re-test-before-move-up |
| weight | 10000 (100.00%) |
| Transaction Info | Block #26045975/Trx 0a5f042db6ee900ecf2fce1692b807fa4c059255 |
View Raw JSON Data
{
  "trx_id": "0a5f042db6ee900ecf2fce1692b807fa4c059255",
  "block": 26045975,
  "trx_in_block": 13,
  "op_in_trx": 0,
  "virtual_op": 0,
  "timestamp": "2018-09-18T06:58:39",
  "op": [
    "vote",
    {
      "voter": "martintrott",
      "author": "proofofresearch",
      "permlink": "bitcoin-price-analysis-re-test-before-move-up",
      "weight": 10000
    }
  ]
}proofofresearchpublished a new post: bitcoin-price-analysis-re-test-before-move-up2018/09/18 06:55:36
proofofresearchpublished a new post: bitcoin-price-analysis-re-test-before-move-up
2018/09/18 06:55:36
| parent author | |
| parent permlink | bitcoin |
| author | proofofresearch |
| permlink | bitcoin-price-analysis-re-test-before-move-up |
| title | Bitcoin Price Analysis: Re-Test Before Move Up? |
| body | ### Bitcoin Price Analysis: Re-Test Before Move Up?  # Foreword This is an update on the price of Bitcoin. It seemed like this one was needed after the brief intermission between the last price update and this one. In this piece, we’ll be discussing the potential rise of Bitcoin, its potential cap, as well as the alternative scenarios that may take place in the price action. As always, understand that the information contained in here is strictly theory-based, and the curator of this piece does not advocate for any decisions to be made one way or another. The purpose of this piece is merely to inform you of the possible scenarios that can play out on Bitcoin in order to help stimulate your **_own, independent_** ideas. # Resistance and Support Points  [https://www.tradingview.com/x/YyUuDXjC/](https://www.tradingview.com/x/YyUuDXjC/) In the above picture, the above line going through the transparent box shows how the price was trending against the $6.5k mark for some time. As predicted through the Telegram, the price did eventually decline down to $6.2k (that lower support point). Just for reference, none of the lines that you see in the above picture were drawn after the fact. These lines were drawn on the chart quite some time ago. So, this yields credence to the theory that support and resistance points are pretty reliable indicators of where the price will end up moving to next. ## Another Reason for the $6.2k Drop-Off Point  [https://www.tradingview.com/x/6RoS1GxA/](https://www.tradingview.com/x/6RoS1GxA/) The chart above is a bit less pretty than the last one that we posted of the H4, but this is effective to show some of the other resistance/support points on the chart. What we want to draw the readers’ attention to, however, is the diagonal trendline that the price has been testing numerous times over the past few weeks.  [https://www.tradingview.com/x/nanwhr5z/](https://www.tradingview.com/x/nanwhr5z/) The picture above should give readers a better idea of the diagonal support that we are referring to. This line dates back to June 28th (approximately), and the price has just recently re-tested this support point. As one can observe in the picture above, each re-test of this line has come been associated with a subsequent ‘bounce’ in the price.  [https://www.tradingview.com/x/kDLpAOgd/](https://www.tradingview.com/x/kDLpAOgd/) ## We Cannot Ignore the Lower Highs Occurring Simultaneously As Well While there has been a steady, ascending support line for the price of Bitcoin, there has also bee a steady, descending **_resistance line_** for the price as well.  [https://www.tradingview.com/x/y4aQtEYH/](https://www.tradingview.com/x/y4aQtEYH/) As you can see in the picture above, there has been a substantive pattern of lower highs. The two lines that you see above converge to form what is known as an asymmetrical triangle. # What is an Symmetrical Triangle?   The two pictures above (which are already cited) are symmetrical triangle formations that depict two different potential outcomes. These represent the only two possible outcomes because of the nature of the pattern. As you can see in the above graphs that we populated in this article, the pattern of higher lows and lower highs cannot continue forever. At some point there must be a higher high or a lower low. This is simple mathematics based on the shape of triangles in general (more akin to an equilateral). Also, a higher high or a lower low would effectively represent a break in the trendlines; both of which are very well-tested at this point in time. # Shorter-Term Look  [https://www.tradingview.com/x/mU6i3jHC/](https://www.tradingview.com/x/mU6i3jHC/) Common sense and logic + the symmetrical triangle pattern dictates that the price would bounce toward the upper regions if it fails to break below the trend line created by the higher lows. This may be corroborated by the reverse bump and run that appears to be developing on the protocol currently.  [https://www.tradingview.com/x/6OuUrEYt/](https://www.tradingview.com/x/6OuUrEYt/) The above chart is on the H4. The formation of an even steeper angle of a downward trend that is below the main downtrend (the larger line), is akin to that of a bump and run. Except, in this case, that would precipitate a fairly massive gain, rather than a massive decrease. **_Below is a picture of the conventional bump and run pattern:_**  [https://stockcharts.com/school/doku.php?id=chart_school:chart_analysis:chart_patterns:bump_and_run_reversal_reversal](https://stockcharts.com/school/doku.php?id=chart_school:chart_analysis:chart_patterns:bump_and_run_reversal_reversal) What is seen above is a conventional bump and run pattern that is followed with a steep drop. However, this can also **_occur in reverse as well._** This is sometimes also known as the inverted BARR. Below are some common examples of this chart pattern coming to fruition.  Source: [http://thepatternsite.com/barrb.html](http://thepatternsite.com/barrb.html)  Thus, there is a latent possibility that this occurs with the price action in its current iteration. Let’s take a look at where the optimal point to place a long position would be.  [https://www.tradingview.com/x/c0fIrSjW/](https://www.tradingview.com/x/c0fIrSjW/) The crosshair-like illustration on the chart above marks a point where a ‘long’ position on Bitcoin would probably be a bit ‘safer’ in comparison to placing one now. The price of the yellow crosshair mark on the chart is $6.32k (approximately). A break above this point would send the price at least toward the $6.5k resistance once again. # Looking at the Indicators For Potential Reversals (H4) To be clear, the H4 is showing a downtrend. Thus, when we discuss ‘reversals’, we are talking about the chances that the price will subsequently reverse course and begin moving upward. # ZeroNoncense Balance of Power RSI  [https://www.tradingview.com/x/8yH6EwqU/](https://www.tradingview.com/x/8yH6EwqU/) The above picture shows a custom indicator that we built. This indicator, in the simplest terms, takes the Balance of Power and tracks its RSI (momentum. When the line turns red, that means that the price has reached an ‘extreme’ in sentiment. If the line is in the ‘overbought’ area when the red line appears, that means that there is a ‘dangerous’ amount of buy sentiment and that an impending reversal could be in the works. When the line is in the ‘oversold’ area when it begins turning red, that means that the sell volume is higher than originally anticipated as well. Thus, this indicator bears good news for those that are Bitcoin bulls. # Relative Strength Index (14) [H4]  [https://www.tradingview.com/x/8rYZpDEQ/](https://www.tradingview.com/x/8rYZpDEQ/) In the picture above, the second panel displays a custom indicator built by Zero_n0ncense. The indicator reflects the same reading as the regular RSI(14). However, the only major difference is that the colors represent ‘buy’ and ‘sell’ signals. Green = Buy Signal Red = Sell Signal Getting back to the RSI, we can see that it is currently in the oversold portion for the H4. There was also a line drawn across the top of a portion of the RSI to show that, at one point in time (during the consolidation), there was a significant amount of negative divergence that would’ve tipped investors to the fact that they needed to get out or short (at least in the short-term). However, the RSI is now in the oversold range. But that does not mean that the downtrend that was established by the previous RSI woes cannot come to effect now. This will not be prohibitive in the price’s attempt to climb back up in value. # Conclusion In the author’s opinion, placing a bet on a long position at this point wouldn’t be the worst move in the world. Please note, this isn’t financial advice. **_The reasons for saying this point looks like a nice long position are:_** 1. It appears that the price has finally hit a ‘bottom’ of some sort. This was also a bottom that was anticipated. 2. The ‘cool down’ period for the RSI looks lik eit has or will subside at some point. 3. The pattern that Bitcoin is in mandates that the price continue upward from where it is as well. Ultimately, there is no guarantee that the theory presented in this article plays out — but only time will tell. |
| json metadata | {"tags":["bitcoin","crypto","cryptocurrency","priceanalysis","technicalanalysis"],"image":["https://cdn-images-1.medium.com/max/1250/1*xztHEY6v5NGDSqTBSYMtXA.gif","https://cdn-images-1.medium.com/max/1563/1*focnRc_MkF-GT0wvrZBfMA.png","https://cdn-images-1.medium.com/max/1563/1*r6sitM5MfAn8SzHpDtpGXg.png","https://cdn-images-1.medium.com/max/1563/1*Yib2KttRzyd6tRHEdO-nxg.png","https://cdn-images-1.medium.com/max/1563/1*gTyecpNZdcGpvYdp5rfxzQ.png","https://cdn-images-1.medium.com/max/1563/1*WJCZtc4VCJgzTNQGDSXugw.png","https://cdn-images-1.medium.com/max/1250/0*nA6Egrf4bzx-g7fS.png","https://cdn-images-1.medium.com/max/1250/0*RaFjef-dHG_HRYpt.gif","https://cdn-images-1.medium.com/max/1563/1*SX0x3ZGOgW0zg2sq5bvBiQ.png","https://cdn-images-1.medium.com/max/1563/1*Mxvolai47M_9BidCFzSqmQ.png","https://cdn-images-1.medium.com/max/1563/1*xB9PhoydgY2AZlW74SCwFw.png","https://cdn-images-1.medium.com/max/1563/1*dtS6ztUlMnVb9qr8YqbCaQ.png","https://cdn-images-1.medium.com/max/1250/0*Xmzc68balhCJtIPE.png","https://cdn-images-1.medium.com/max/1563/1*WfYDYUQOR22yYjf1Tp2SSw.png","https://cdn-images-1.medium.com/max/1563/1*of5zaw9kOjy-iBJnfQ_BSA.png","https://cdn-images-1.medium.com/max/1563/1*7B3e5aVIWEhocEcJwZCfYQ.png"],"links":["https://www.tradingview.com/x/YyUuDXjC/","https://www.tradingview.com/x/6RoS1GxA/","https://www.tradingview.com/x/nanwhr5z/","https://www.tradingview.com/x/kDLpAOgd/","https://www.tradingview.com/x/y4aQtEYH/","https://www.tradingview.com/x/mU6i3jHC/","https://www.tradingview.com/x/6OuUrEYt/","https://stockcharts.com/school/doku.php?id=chart_school:chart_analysis:chart_patterns:bump_and_run_reversal_reversal","http://thepatternsite.com/barrb.html","https://www.tradingview.com/x/c0fIrSjW/","https://www.tradingview.com/x/8yH6EwqU/","https://www.tradingview.com/x/8rYZpDEQ/"],"app":"steemit/0.1","format":"markdown"} |
| Transaction Info | Block #26045917/Trx 4679a57ad05bd8442eace81a472036d708ed901c |
View Raw JSON Data
{
"trx_id": "4679a57ad05bd8442eace81a472036d708ed901c",
"block": 26045917,
"trx_in_block": 6,
"op_in_trx": 0,
"virtual_op": 0,
"timestamp": "2018-09-18T06:55:36",
"op": [
"comment",
{
"parent_author": "",
"parent_permlink": "bitcoin",
"author": "proofofresearch",
"permlink": "bitcoin-price-analysis-re-test-before-move-up",
"title": "Bitcoin Price Analysis: Re-Test Before Move Up?",
"body": "### Bitcoin Price Analysis: Re-Test Before Move Up?\n\n\n\n# Foreword\n\nThis is an update on the price of Bitcoin. It seemed like this one was needed after the brief intermission between the last price update and this one.\n\nIn this piece, we’ll be discussing the potential rise of Bitcoin, its potential cap, as well as the alternative scenarios that may take place in the price action.\n\nAs always, understand that the information contained in here is strictly theory-based, and the curator of this piece does not advocate for any decisions to be made one way or another. The purpose of this piece is merely to inform you of the possible scenarios that can play out on Bitcoin in order to help stimulate your **_own, independent_** ideas.\n\n# Resistance and Support Points\n\n\n\n[https://www.tradingview.com/x/YyUuDXjC/](https://www.tradingview.com/x/YyUuDXjC/)\n\nIn the above picture, the above line going through the transparent box shows how the price was trending against the $6.5k mark for some time.\n\nAs predicted through the Telegram, the price did eventually decline down to $6.2k (that lower support point).\n\nJust for reference, none of the lines that you see in the above picture were drawn after the fact. These lines were drawn on the chart quite some time ago. So, this yields credence to the theory that support and resistance points are pretty reliable indicators of where the price will end up moving to next.\n\n## Another Reason for the $6.2k Drop-Off Point\n\n\n\n[https://www.tradingview.com/x/6RoS1GxA/](https://www.tradingview.com/x/6RoS1GxA/)\n\nThe chart above is a bit less pretty than the last one that we posted of the H4, but this is effective to show some of the other resistance/support points on the chart.\n\nWhat we want to draw the readers’ attention to, however, is the diagonal trendline that the price has been testing numerous times over the past few weeks.\n\n\n\n[https://www.tradingview.com/x/nanwhr5z/](https://www.tradingview.com/x/nanwhr5z/)\n\nThe picture above should give readers a better idea of the diagonal support that we are referring to.\n\nThis line dates back to June 28th (approximately), and the price has just recently re-tested this support point.\n\nAs one can observe in the picture above, each re-test of this line has come been associated with a subsequent ‘bounce’ in the price.\n\n\n\n[https://www.tradingview.com/x/kDLpAOgd/](https://www.tradingview.com/x/kDLpAOgd/)\n\n## We Cannot Ignore the Lower Highs Occurring Simultaneously As Well\n\nWhile there has been a steady, ascending support line for the price of Bitcoin, there has also bee a steady, descending **_resistance line_** for the price as well.\n\n\n\n[https://www.tradingview.com/x/y4aQtEYH/](https://www.tradingview.com/x/y4aQtEYH/)\n\nAs you can see in the picture above, there has been a substantive pattern of lower highs.\n\nThe two lines that you see above converge to form what is known as an asymmetrical triangle.\n\n# What is an Symmetrical Triangle?\n\n\n\n\n\nThe two pictures above (which are already cited) are symmetrical triangle formations that depict two different potential outcomes.\n\nThese represent the only two possible outcomes because of the nature of the pattern.\n\nAs you can see in the above graphs that we populated in this article, the pattern of higher lows and lower highs cannot continue forever. At some point there must be a higher high or a lower low. This is simple mathematics based on the shape of triangles in general (more akin to an equilateral).\n\nAlso, a higher high or a lower low would effectively represent a break in the trendlines; both of which are very well-tested at this point in time.\n\n# Shorter-Term Look\n\n\n\n[https://www.tradingview.com/x/mU6i3jHC/](https://www.tradingview.com/x/mU6i3jHC/)\n\nCommon sense and logic + the symmetrical triangle pattern dictates that the price would bounce toward the upper regions if it fails to break below the trend line created by the higher lows.\n\nThis may be corroborated by the reverse bump and run that appears to be developing on the protocol currently.\n\n\n\n[https://www.tradingview.com/x/6OuUrEYt/](https://www.tradingview.com/x/6OuUrEYt/)\n\nThe above chart is on the H4. The formation of an even steeper angle of a downward trend that is below the main downtrend (the larger line), is akin to that of a bump and run.\n\nExcept, in this case, that would precipitate a fairly massive gain, rather than a massive decrease.\n\n**_Below is a picture of the conventional bump and run pattern:_**\n\n\n\n[https://stockcharts.com/school/doku.php?id=chart_school:chart_analysis:chart_patterns:bump_and_run_reversal_reversal](https://stockcharts.com/school/doku.php?id=chart_school:chart_analysis:chart_patterns:bump_and_run_reversal_reversal)\n\nWhat is seen above is a conventional bump and run pattern that is followed with a steep drop.\n\nHowever, this can also **_occur in reverse as well._**\n\nThis is sometimes also known as the inverted BARR.\n\nBelow are some common examples of this chart pattern coming to fruition.\n\n\n\nSource: [http://thepatternsite.com/barrb.html](http://thepatternsite.com/barrb.html)\n\n\n\nThus, there is a latent possibility that this occurs with the price action in its current iteration.\n\nLet’s take a look at where the optimal point to place a long position would be.\n\n\n\n[https://www.tradingview.com/x/c0fIrSjW/](https://www.tradingview.com/x/c0fIrSjW/)\n\nThe crosshair-like illustration on the chart above marks a point where a ‘long’ position on Bitcoin would probably be a bit ‘safer’ in comparison to placing one now.\n\nThe price of the yellow crosshair mark on the chart is $6.32k (approximately).\n\nA break above this point would send the price at least toward the $6.5k resistance once again.\n\n# Looking at the Indicators For Potential Reversals (H4)\n\nTo be clear, the H4 is showing a downtrend. Thus, when we discuss ‘reversals’, we are talking about the chances that the price will subsequently reverse course and begin moving upward.\n\n# ZeroNoncense Balance of Power RSI\n\n\n\n[https://www.tradingview.com/x/8yH6EwqU/](https://www.tradingview.com/x/8yH6EwqU/)\n\nThe above picture shows a custom indicator that we built. This indicator, in the simplest terms, takes the Balance of Power and tracks its RSI (momentum.\n\nWhen the line turns red, that means that the price has reached an ‘extreme’ in sentiment.\n\nIf the line is in the ‘overbought’ area when the red line appears, that means that there is a ‘dangerous’ amount of buy sentiment and that an impending reversal could be in the works.\n\nWhen the line is in the ‘oversold’ area when it begins turning red, that means that the sell volume is higher than originally anticipated as well.\n\nThus, this indicator bears good news for those that are Bitcoin bulls.\n\n# Relative Strength Index (14) [H4]\n\n\n\n[https://www.tradingview.com/x/8rYZpDEQ/](https://www.tradingview.com/x/8rYZpDEQ/)\n\nIn the picture above, the second panel displays a custom indicator built by Zero_n0ncense.\n\nThe indicator reflects the same reading as the regular RSI(14). However, the only major difference is that the colors represent ‘buy’ and ‘sell’ signals.\n\nGreen = Buy Signal\n\nRed = Sell Signal\n\nGetting back to the RSI, we can see that it is currently in the oversold portion for the H4. There was also a line drawn across the top of a portion of the RSI to show that, at one point in time (during the consolidation), there was a significant amount of negative divergence that would’ve tipped investors to the fact that they needed to get out or short (at least in the short-term).\n\nHowever, the RSI is now in the oversold range. But that does not mean that the downtrend that was established by the previous RSI woes cannot come to effect now. This will not be prohibitive in the price’s attempt to climb back up in value.\n\n# Conclusion\n\nIn the author’s opinion, placing a bet on a long position at this point wouldn’t be the worst move in the world.\n\nPlease note, this isn’t financial advice.\n\n**_The reasons for saying this point looks like a nice long position are:_**\n\n1. It appears that the price has finally hit a ‘bottom’ of some sort. This was also a bottom that was anticipated.\n2. The ‘cool down’ period for the RSI looks lik eit has or will subside at some point.\n3. The pattern that Bitcoin is in mandates that the price continue upward from where it is as well.\n\nUltimately, there is no guarantee that the theory presented in this article plays out — but only time will tell.",
"json_metadata": "{\"tags\":[\"bitcoin\",\"crypto\",\"cryptocurrency\",\"priceanalysis\",\"technicalanalysis\"],\"image\":[\"https://cdn-images-1.medium.com/max/1250/1*xztHEY6v5NGDSqTBSYMtXA.gif\",\"https://cdn-images-1.medium.com/max/1563/1*focnRc_MkF-GT0wvrZBfMA.png\",\"https://cdn-images-1.medium.com/max/1563/1*r6sitM5MfAn8SzHpDtpGXg.png\",\"https://cdn-images-1.medium.com/max/1563/1*Yib2KttRzyd6tRHEdO-nxg.png\",\"https://cdn-images-1.medium.com/max/1563/1*gTyecpNZdcGpvYdp5rfxzQ.png\",\"https://cdn-images-1.medium.com/max/1563/1*WJCZtc4VCJgzTNQGDSXugw.png\",\"https://cdn-images-1.medium.com/max/1250/0*nA6Egrf4bzx-g7fS.png\",\"https://cdn-images-1.medium.com/max/1250/0*RaFjef-dHG_HRYpt.gif\",\"https://cdn-images-1.medium.com/max/1563/1*SX0x3ZGOgW0zg2sq5bvBiQ.png\",\"https://cdn-images-1.medium.com/max/1563/1*Mxvolai47M_9BidCFzSqmQ.png\",\"https://cdn-images-1.medium.com/max/1563/1*xB9PhoydgY2AZlW74SCwFw.png\",\"https://cdn-images-1.medium.com/max/1563/1*dtS6ztUlMnVb9qr8YqbCaQ.png\",\"https://cdn-images-1.medium.com/max/1250/0*Xmzc68balhCJtIPE.png\",\"https://cdn-images-1.medium.com/max/1563/1*WfYDYUQOR22yYjf1Tp2SSw.png\",\"https://cdn-images-1.medium.com/max/1563/1*of5zaw9kOjy-iBJnfQ_BSA.png\",\"https://cdn-images-1.medium.com/max/1563/1*7B3e5aVIWEhocEcJwZCfYQ.png\"],\"links\":[\"https://www.tradingview.com/x/YyUuDXjC/\",\"https://www.tradingview.com/x/6RoS1GxA/\",\"https://www.tradingview.com/x/nanwhr5z/\",\"https://www.tradingview.com/x/kDLpAOgd/\",\"https://www.tradingview.com/x/y4aQtEYH/\",\"https://www.tradingview.com/x/mU6i3jHC/\",\"https://www.tradingview.com/x/6OuUrEYt/\",\"https://stockcharts.com/school/doku.php?id=chart_school:chart_analysis:chart_patterns:bump_and_run_reversal_reversal\",\"http://thepatternsite.com/barrb.html\",\"https://www.tradingview.com/x/c0fIrSjW/\",\"https://www.tradingview.com/x/8yH6EwqU/\",\"https://www.tradingview.com/x/8rYZpDEQ/\"],\"app\":\"steemit/0.1\",\"format\":\"markdown\"}"
}
]
}proofofresearchreceived 0.030 STEEM, 0.037 SP author reward for @proofofresearch / what-does-ripple-s-general-counsel-leaving-mean-for-ripple2018/09/15 19:45:39
proofofresearchreceived 0.030 STEEM, 0.037 SP author reward for @proofofresearch / what-does-ripple-s-general-counsel-leaving-mean-for-ripple
2018/09/15 19:45:39
| author | proofofresearch |
| permlink | what-does-ripple-s-general-counsel-leaving-mean-for-ripple |
| sbd payout | 0.000 SBD |
| steem payout | 0.030 STEEM |
| vesting payout | 60.653375 VESTS |
| Transaction Info | Block #25990230/Virtual Operation #3 |
View Raw JSON Data
{
  "trx_id": "0000000000000000000000000000000000000000",
  "block": 25990230,
  "trx_in_block": 4294967295,
  "op_in_trx": 0,
  "virtual_op": 3,
  "timestamp": "2018-09-15T19:45:39",
  "op": [
    "author_reward",
    {
      "author": "proofofresearch",
      "permlink": "what-does-ripple-s-general-counsel-leaving-mean-for-ripple",
      "sbd_payout": "0.000 SBD",
      "steem_payout": "0.030 STEEM",
      "vesting_payout": "60.653375 VESTS"
    }
  ]
}mrakodrapupvoted (10.00%) @proofofresearch / usdomg-price-analysis-don-t-get-fooled-edition2018/09/14 12:01:03
mrakodrapupvoted (10.00%) @proofofresearch / usdomg-price-analysis-don-t-get-fooled-edition
2018/09/14 12:01:03
| voter | mrakodrap |
| author | proofofresearch |
| permlink | usdomg-price-analysis-don-t-get-fooled-edition |
| weight | 1000 (10.00%) |
| Transaction Info | Block #25952141/Trx a3d2396f5f3a3db9dcfd0c1ac6c78ee41b1e24fb |
View Raw JSON Data
{
  "trx_id": "a3d2396f5f3a3db9dcfd0c1ac6c78ee41b1e24fb",
  "block": 25952141,
  "trx_in_block": 20,
  "op_in_trx": 0,
  "virtual_op": 0,
  "timestamp": "2018-09-14T12:01:03",
  "op": [
    "vote",
    {
      "voter": "mrakodrap",
      "author": "proofofresearch",
      "permlink": "usdomg-price-analysis-don-t-get-fooled-edition",
      "weight": 1000
    }
  ]
}cryptomazinupvoted (100.00%) @proofofresearch / bitcoin-long-term-price-theory-no-one-considered2018/09/14 11:31:09
cryptomazinupvoted (100.00%) @proofofresearch / bitcoin-long-term-price-theory-no-one-considered
2018/09/14 11:31:09
| voter | cryptomazin |
| author | proofofresearch |
| permlink | bitcoin-long-term-price-theory-no-one-considered |
| weight | 10000 (100.00%) |
| Transaction Info | Block #25951543/Trx 441a21a7d306461331f207c4ece81ac87d015a74 |
View Raw JSON Data
{
  "trx_id": "441a21a7d306461331f207c4ece81ac87d015a74",
  "block": 25951543,
  "trx_in_block": 17,
  "op_in_trx": 0,
  "virtual_op": 0,
  "timestamp": "2018-09-14T11:31:09",
  "op": [
    "vote",
    {
      "voter": "cryptomazin",
      "author": "proofofresearch",
      "permlink": "bitcoin-long-term-price-theory-no-one-considered",
      "weight": 10000
    }
  ]
}proofofresearchpublished a new post: usdomg-price-analysis-don-t-get-fooled-edition2018/09/14 11:05:00
proofofresearchpublished a new post: usdomg-price-analysis-don-t-get-fooled-edition
2018/09/14 11:05:00
| parent author | |
| parent permlink | bitcoin |
| author | proofofresearch |
| permlink | usdomg-price-analysis-don-t-get-fooled-edition |
| title | $OMG Price Analysis: Don’t Get Fooled Edition |
| body | # $OMG Price Analysis: Don’t Get Fooled Edition  The reason why this price analysis is called ‘don’t get fooled’ is because you **could get fooled if you’re not careful.** ## OmiseGo on the H4  [https://www.tradingview.com/x/nIRY8hAW/](https://www.tradingview.com/x/nIRY8hAW/) In the picture above, we can see that there was clearly a defined downtrend line spanning from September 6th to approximately September 13th (the day that just passed); so, not a major point of transgression.  [https://www.tradingview.com/x/kwKgNtlJ/](https://www.tradingview.com/x/kwKgNtlJ/) Now, the price did break above, but it wasn’t as substantial as one would like it to be in order to generate a solid buy signal.  [https://www.tradingview.com/x/MhNhHwpg/](https://www.tradingview.com/x/MhNhHwpg/)  [https://www.tradingview.com/x/8Er062PR/](https://www.tradingview.com/x/8Er062PR/) The two pictures above should make it abundantly clear why traders should already be leery on placing a long position in the coin at this point in time. ## RSI for $OMG on the H4  [https://www.tradingview.com/x/fKnloNlV/](https://www.tradingview.com/x/fKnloNlV/) The RSI for $OMG is looking **_very stagnant at this present moment in time._** Could easily tilt over and provide a lower low than the last one and really just break the phase/trend that it’s in entirely. ## Flat-Top Triangle Formation  [https://www.tradingview.com/x/1LxXhQ0w/](https://www.tradingview.com/x/1LxXhQ0w/) The flat-top triangle pattern formation looks fairly obvious from the H4. However, with the way that $OMG is looking right now, its very plausible, if not likely, that the price teeters over very soon. Sure, there is a chance of a break upward of north, but the author really feels that south is where this is headed. ## Daily Looks VERY Bearish for $OMG  [https://www.tradingview.com/x/vnPObfY1/](https://www.tradingview.com/x/vnPObfY1/) The daily really looks as though the price of $OMG broke through a fairly important support point, started bleeding for a little while and now the price is back to touch that support point before potentially continuing its descent downward. # Conclusion In the absence of any solid evidence to show that there is going to be a major reversal in the price, this looks like a clear abstain in the opinion of the author. |
| json metadata | {"tags":["bitcoin","crypto","cryptocurrency","priceanalysis","technicalanalysis"],"image":["https://cdn-images-1.medium.com/max/1250/0*RWc0tpYpUpF5fAc5.jpg","https://cdn-images-1.medium.com/max/1563/1*mEml8MPvhfIv0DowZq85iA.png","https://cdn-images-1.medium.com/max/1563/1*xsBhX9jEyyFxDUn7SweJrw.png","https://cdn-images-1.medium.com/max/1563/1*PRMmg80DOYSjC_9jEZEDJA.png","https://cdn-images-1.medium.com/max/1563/1*Qw6mHEh3OaqYuwaAgz2nMg.png","https://cdn-images-1.medium.com/max/1563/1*P5M-08ETfAUmnBFiuAPTRw.png","https://cdn-images-1.medium.com/max/1563/1*U_dHeRXcv8IFns52vVR6ZA.png","https://cdn-images-1.medium.com/max/1563/1*f_anfypHjz-WTt8uHIV08g.png"],"links":["https://www.tradingview.com/x/nIRY8hAW/","https://www.tradingview.com/x/kwKgNtlJ/","https://www.tradingview.com/x/MhNhHwpg/","https://www.tradingview.com/x/8Er062PR/","https://www.tradingview.com/x/fKnloNlV/","https://www.tradingview.com/x/1LxXhQ0w/","https://www.tradingview.com/x/vnPObfY1/"],"app":"steemit/0.1","format":"markdown"} |
| Transaction Info | Block #25951020/Trx d24df35d4b8f68787cf9d3de6679b4daf6a8aae7 |
View Raw JSON Data
{
"trx_id": "d24df35d4b8f68787cf9d3de6679b4daf6a8aae7",
"block": 25951020,
"trx_in_block": 1,
"op_in_trx": 0,
"virtual_op": 0,
"timestamp": "2018-09-14T11:05:00",
"op": [
"comment",
{
"parent_author": "",
"parent_permlink": "bitcoin",
"author": "proofofresearch",
"permlink": "usdomg-price-analysis-don-t-get-fooled-edition",
"title": "$OMG Price Analysis: Don’t Get Fooled Edition",
"body": "# $OMG Price Analysis: Don’t Get Fooled Edition\n\n \n\n\n\n \n\nThe reason why this price analysis is called ‘don’t get fooled’ is because you **could get fooled if you’re not careful.**\n\n## OmiseGo on the H4\n\n\n\n[https://www.tradingview.com/x/nIRY8hAW/](https://www.tradingview.com/x/nIRY8hAW/)\n\nIn the picture above, we can see that there was clearly a defined downtrend line spanning from September 6th to approximately September 13th (the day that just passed); so, not a major point of transgression.\n\n\n\n[https://www.tradingview.com/x/kwKgNtlJ/](https://www.tradingview.com/x/kwKgNtlJ/)\n\nNow, the price did break above, but it wasn’t as substantial as one would like it to be in order to generate a solid buy signal.\n\n\n\n[https://www.tradingview.com/x/MhNhHwpg/](https://www.tradingview.com/x/MhNhHwpg/)\n\n\n\n[https://www.tradingview.com/x/8Er062PR/](https://www.tradingview.com/x/8Er062PR/)\n\nThe two pictures above should make it abundantly clear why traders should already be leery on placing a long position in the coin at this point in time.\n\n## RSI for $OMG on the H4\n\n\n\n[https://www.tradingview.com/x/fKnloNlV/](https://www.tradingview.com/x/fKnloNlV/)\n\nThe RSI for $OMG is looking **_very stagnant at this present moment in time._**\n\nCould easily tilt over and provide a lower low than the last one and really just break the phase/trend that it’s in entirely.\n\n## Flat-Top Triangle Formation\n\n\n\n[https://www.tradingview.com/x/1LxXhQ0w/](https://www.tradingview.com/x/1LxXhQ0w/)\n\nThe flat-top triangle pattern formation looks fairly obvious from the H4.\n\nHowever, with the way that $OMG is looking right now, its very plausible, if not likely, that the price teeters over very soon.\n\nSure, there is a chance of a break upward of north, but the author really feels that south is where this is headed.\n\n## Daily Looks VERY Bearish for $OMG\n\n\n\n[https://www.tradingview.com/x/vnPObfY1/](https://www.tradingview.com/x/vnPObfY1/)\n\nThe daily really looks as though the price of $OMG broke through a fairly important support point, started bleeding for a little while and now the price is back to touch that support point before potentially continuing its descent downward.\n\n# Conclusion\n\nIn the absence of any solid evidence to show that there is going to be a major reversal in the price, this looks like a clear abstain in the opinion of the author.",
"json_metadata": "{\"tags\":[\"bitcoin\",\"crypto\",\"cryptocurrency\",\"priceanalysis\",\"technicalanalysis\"],\"image\":[\"https://cdn-images-1.medium.com/max/1250/0*RWc0tpYpUpF5fAc5.jpg\",\"https://cdn-images-1.medium.com/max/1563/1*mEml8MPvhfIv0DowZq85iA.png\",\"https://cdn-images-1.medium.com/max/1563/1*xsBhX9jEyyFxDUn7SweJrw.png\",\"https://cdn-images-1.medium.com/max/1563/1*PRMmg80DOYSjC_9jEZEDJA.png\",\"https://cdn-images-1.medium.com/max/1563/1*Qw6mHEh3OaqYuwaAgz2nMg.png\",\"https://cdn-images-1.medium.com/max/1563/1*P5M-08ETfAUmnBFiuAPTRw.png\",\"https://cdn-images-1.medium.com/max/1563/1*U_dHeRXcv8IFns52vVR6ZA.png\",\"https://cdn-images-1.medium.com/max/1563/1*f_anfypHjz-WTt8uHIV08g.png\"],\"links\":[\"https://www.tradingview.com/x/nIRY8hAW/\",\"https://www.tradingview.com/x/kwKgNtlJ/\",\"https://www.tradingview.com/x/MhNhHwpg/\",\"https://www.tradingview.com/x/8Er062PR/\",\"https://www.tradingview.com/x/fKnloNlV/\",\"https://www.tradingview.com/x/1LxXhQ0w/\",\"https://www.tradingview.com/x/vnPObfY1/\"],\"app\":\"steemit/0.1\",\"format\":\"markdown\"}"
}
]
}sensationupvoted (100.00%) @proofofresearch / bitcoin-long-term-price-theory-no-one-considered2018/09/14 10:53:54
sensationupvoted (100.00%) @proofofresearch / bitcoin-long-term-price-theory-no-one-considered
2018/09/14 10:53:54
| voter | sensation |
| author | proofofresearch |
| permlink | bitcoin-long-term-price-theory-no-one-considered |
| weight | 10000 (100.00%) |
| Transaction Info | Block #25950798/Trx 83f1bf13f3d695e85f82d48712ea2d426438c9f4 |
View Raw JSON Data
{
  "trx_id": "83f1bf13f3d695e85f82d48712ea2d426438c9f4",
  "block": 25950798,
  "trx_in_block": 11,
  "op_in_trx": 0,
  "virtual_op": 0,
  "timestamp": "2018-09-14T10:53:54",
  "op": [
    "vote",
    {
      "voter": "sensation",
      "author": "proofofresearch",
      "permlink": "bitcoin-long-term-price-theory-no-one-considered",
      "weight": 10000
    }
  ]
}2018/09/14 10:03:18
2018/09/14 10:03:18
| parent author | proofofresearch |
| parent permlink | bitcoin-long-term-price-theory-no-one-considered |
| author | dimo-timo |
| permlink | re-proofofresearch-2018914t13315318z |
| title | |
| body | This is gold stuff! Thank you! |
| json metadata | {"tags":["bitcoin","crypto","cryptocurrency","priceanalysis","technicalanalysis"],"app":"esteem/1.6.0","format":"markdown+html","community":"esteem"} |
| Transaction Info | Block #25949787/Trx 135d3da05535bbf079b14f0e94010d2a3b1cb46b |
View Raw JSON Data
{
  "trx_id": "135d3da05535bbf079b14f0e94010d2a3b1cb46b",
  "block": 25949787,
  "trx_in_block": 8,
  "op_in_trx": 0,
  "virtual_op": 0,
  "timestamp": "2018-09-14T10:03:18",
  "op": [
    "comment",
    {
      "parent_author": "proofofresearch",
      "parent_permlink": "bitcoin-long-term-price-theory-no-one-considered",
      "author": "dimo-timo",
      "permlink": "re-proofofresearch-2018914t13315318z",
      "title": "",
      "body": "This is gold stuff! Thank you!",
      "json_metadata": "{\"tags\":[\"bitcoin\",\"crypto\",\"cryptocurrency\",\"priceanalysis\",\"technicalanalysis\"],\"app\":\"esteem/1.6.0\",\"format\":\"markdown+html\",\"community\":\"esteem\"}"
    }
  ]
}proofofresearchpublished a new post: bitcoin-long-term-price-theory-no-one-considered2018/09/14 09:50:18
proofofresearchpublished a new post: bitcoin-long-term-price-theory-no-one-considered
2018/09/14 09:50:18
| parent author | |
| parent permlink | bitcoin |
| author | proofofresearch |
| permlink | bitcoin-long-term-price-theory-no-one-considered |
| title | Bitcoin Long-Term Price Theory No One Considered |
| body | @@ -13165,8 +13165,1153 @@ things. +%0A%0A### Disclaimer%0A%0AThis article is not financial advice. The author is not a financial advisor and this article was not paid for.%0A%0AFor more information like this, join/follow our %5BWebsite%5D(https://zerononcense.com/), %5BTelegram%5D(http://t.me/MerkleTrader), %5BDiscord%5D(https://discord.gg/AYW5zDw), %5BSteemit%5D(https://steemit.com/@proofofresearch), %5BReddit%5D(http://reddit.com/u/randomshortdude), and %5BTwitter%5D(https://twitter.com/ProofofResearch)!%0A%0A### This Analysis Was Also Posted On:%0A%0A**Website** = %5Bhttps://blog.zerononcense.com/2018/09/14/bitcoin-long-term-price-theory-no-one-considered/%5D(https://blog.zerononcense.com/2018/09/14/bitcoin-long-term-price-theory-no-one-considered/)%0A%0A%0A**Medium** = %5Bhttps://medium.com/@proofofresearch/bitcoin-long-term-price-theory-no-one-considered-61deb9a2607c%5D(https://medium.com/@proofofresearch/bitcoin-long-term-price-theory-no-one-considered-61deb9a2607c)%0A%0A**TradingView** = %5Bhttps://www.tradingview.com/chart/BTCUSD/MtsbVZOH-This-Bitcoin-Formation-Predicts-When-the-Bear-Market-Will-End/%5D(https://www.tradingview.com/chart/BTCUSD/MtsbVZOH-This-Bitcoin-Formation-Predicts-When-the-Bear-Market-Wi |
| json metadata | {"tags":["bitcoin","crypto","cryptocurrency","priceanalysis","technicalanalysis"],"image":["https://cdn-images-1.medium.com/max/1200/1*hxyoyzGaUsHs-0GYaxiv0g.gif","https://cdn-images-1.medium.com/max/1200/1*be8jO2BRzJBzRvycPbICeg.gif","https://cdn-images-1.medium.com/max/1200/0*gHVaRro8tGtppFyu.png","https://cdn-images-1.medium.com/max/1200/0*lTyzz8Q68QXAJp7b.jpg","https://cdn-images-1.medium.com/max/1200/0*Ao196f6WdmhUd23C.png","https://cdn-images-1.medium.com/max/1200/0*BbHOE9Jj5PJ4X5_J.png","https://cdn-images-1.medium.com/max/1200/0*JVu0WxaIJxmskKtM.png","https://cdn-images-1.medium.com/max/1500/0*GHt60HGLMyQSA3eY.png","https://cdn-images-1.medium.com/max/1500/1*L2HIQZ_9lmKTRAHZhmia0w.png","https://cdn-images-1.medium.com/max/1200/0*_6MFY4_tyvSGmmob.jpg","https://cdn-images-1.medium.com/max/1200/1*WKUTu33vJGl1bYCVrmFIpA.png","https://cdn-images-1.medium.com/max/1500/1*RgI-9z9AlP2K0eCsfKWoKw.png","https://cdn-images-1.medium.com/max/1500/1*pRNh0NxmIA8PlzzPFRjZkg.png","https://cdn-images-1.medium.com/max/1500/1*bd3q8J1VZG11n0mzehqgzw.png","https://cdn-images-1.medium.com/max/1500/1*MOVqTXg-Cnc3_IWoUF2-bA.png","https://cdn-images-1.medium.com/max/1200/1*10kG05oZZOfQdVXnYBsGrQ.gif","https://cdn-images-1.medium.com/max/1500/1*-oJD2DTpYX3yFEm7bhroDQ.png","https://cdn-images-1.medium.com/max/1500/1*H0GTN1HX9iNcczCK38GRuw.png","https://cdn-images-1.medium.com/max/1500/1*ctP7xyzx8h0_6iVXJjIloQ.png","https://cdn-images-1.medium.com/max/1500/1*t5zEPZ2At3yD2OofNZ4D2w.png","https://cdn-images-1.medium.com/max/1500/1*3Nl5R_ohNDRhJ_zBJhlBcg.png","https://cdn-images-1.medium.com/max/1200/1*TU1H0TawDMl9qbc6OD4iQQ.gif","https://cdn-images-1.medium.com/max/1500/1*ka4AHpW0HUj64BJjfbX1kg.png"],"links":["https://stockcharts.com/school/doku.php?id=chart_school:chart_analysis:chart_patterns:rounding_bottom_reversal","https://www.investopedia.com/university/charts/charts10.asp","https://tradingsim.com/blog/rounding-bottom/","http://thepatternsite.com/roundb.html","https://www.tradingview.com/x/Fs2zTGkU/","https://www.tradingview.com/x/OdAoS0VX/","https://www.tradingview.com/x/nDU5mGPE/","https://www.tradingview.com/x/zyA50yDd/","https://www.tradingview.com/x/x68NyuM0/","https://www.tradingview.com/x/d8YBk0fA/","https://zerononcense.com/","http://t.me/MerkleTrader","https://discord.gg/AYW5zDw","https://steemit.com/@proofofresearch","http://reddit.com/u/randomshortdude","https://twitter.com/ProofofResearch","https://blog.zerononcense.com/2018/09/14/bitcoin-long-term-price-theory-no-one-considered/","https://medium.com/@proofofresearch/bitcoin-long-term-price-theory-no-one-considered-61deb9a2607c","https://www.tradingview.com/chart/BTCUSD/MtsbVZOH-This-Bitcoin-Formation-Predicts-When-the-Bear-Market-Will-End/","https://www.tradingview.com/chart/BTCUSD/MtsbVZOH-This-Bitcoin-Formation-Predicts-When-the-Bear-Market-Wi"],"app":"steemit/0.1","format":"markdown"} |
| Transaction Info | Block #25949527/Trx 3fab06d9c0554fa6687197642715dc2962151b68 |
View Raw JSON Data
{
  "trx_id": "3fab06d9c0554fa6687197642715dc2962151b68",
  "block": 25949527,
  "trx_in_block": 21,
  "op_in_trx": 0,
  "virtual_op": 0,
  "timestamp": "2018-09-14T09:50:18",
  "op": [
    "comment",
    {
      "parent_author": "",
      "parent_permlink": "bitcoin",
      "author": "proofofresearch",
      "permlink": "bitcoin-long-term-price-theory-no-one-considered",
      "title": "Bitcoin Long-Term Price Theory No One Considered",
      "body": "@@ -13165,8 +13165,1153 @@\n  things.\n+%0A%0A### Disclaimer%0A%0AThis article is not financial advice. The author is not a financial advisor and this article was not paid for.%0A%0AFor more information like this, join/follow our  %5BWebsite%5D(https://zerononcense.com/),  %5BTelegram%5D(http://t.me/MerkleTrader),  %5BDiscord%5D(https://discord.gg/AYW5zDw),  %5BSteemit%5D(https://steemit.com/@proofofresearch),  %5BReddit%5D(http://reddit.com/u/randomshortdude), and  %5BTwitter%5D(https://twitter.com/ProofofResearch)!%0A%0A### This Analysis Was Also Posted On:%0A%0A**Website**  =  %5Bhttps://blog.zerononcense.com/2018/09/14/bitcoin-long-term-price-theory-no-one-considered/%5D(https://blog.zerononcense.com/2018/09/14/bitcoin-long-term-price-theory-no-one-considered/)%0A%0A%0A**Medium**  =  %5Bhttps://medium.com/@proofofresearch/bitcoin-long-term-price-theory-no-one-considered-61deb9a2607c%5D(https://medium.com/@proofofresearch/bitcoin-long-term-price-theory-no-one-considered-61deb9a2607c)%0A%0A**TradingView**  =  %5Bhttps://www.tradingview.com/chart/BTCUSD/MtsbVZOH-This-Bitcoin-Formation-Predicts-When-the-Bear-Market-Will-End/%5D(https://www.tradingview.com/chart/BTCUSD/MtsbVZOH-This-Bitcoin-Formation-Predicts-When-the-Bear-Market-Wi\n",
      "json_metadata": "{\"tags\":[\"bitcoin\",\"crypto\",\"cryptocurrency\",\"priceanalysis\",\"technicalanalysis\"],\"image\":[\"https://cdn-images-1.medium.com/max/1200/1*hxyoyzGaUsHs-0GYaxiv0g.gif\",\"https://cdn-images-1.medium.com/max/1200/1*be8jO2BRzJBzRvycPbICeg.gif\",\"https://cdn-images-1.medium.com/max/1200/0*gHVaRro8tGtppFyu.png\",\"https://cdn-images-1.medium.com/max/1200/0*lTyzz8Q68QXAJp7b.jpg\",\"https://cdn-images-1.medium.com/max/1200/0*Ao196f6WdmhUd23C.png\",\"https://cdn-images-1.medium.com/max/1200/0*BbHOE9Jj5PJ4X5_J.png\",\"https://cdn-images-1.medium.com/max/1200/0*JVu0WxaIJxmskKtM.png\",\"https://cdn-images-1.medium.com/max/1500/0*GHt60HGLMyQSA3eY.png\",\"https://cdn-images-1.medium.com/max/1500/1*L2HIQZ_9lmKTRAHZhmia0w.png\",\"https://cdn-images-1.medium.com/max/1200/0*_6MFY4_tyvSGmmob.jpg\",\"https://cdn-images-1.medium.com/max/1200/1*WKUTu33vJGl1bYCVrmFIpA.png\",\"https://cdn-images-1.medium.com/max/1500/1*RgI-9z9AlP2K0eCsfKWoKw.png\",\"https://cdn-images-1.medium.com/max/1500/1*pRNh0NxmIA8PlzzPFRjZkg.png\",\"https://cdn-images-1.medium.com/max/1500/1*bd3q8J1VZG11n0mzehqgzw.png\",\"https://cdn-images-1.medium.com/max/1500/1*MOVqTXg-Cnc3_IWoUF2-bA.png\",\"https://cdn-images-1.medium.com/max/1200/1*10kG05oZZOfQdVXnYBsGrQ.gif\",\"https://cdn-images-1.medium.com/max/1500/1*-oJD2DTpYX3yFEm7bhroDQ.png\",\"https://cdn-images-1.medium.com/max/1500/1*H0GTN1HX9iNcczCK38GRuw.png\",\"https://cdn-images-1.medium.com/max/1500/1*ctP7xyzx8h0_6iVXJjIloQ.png\",\"https://cdn-images-1.medium.com/max/1500/1*t5zEPZ2At3yD2OofNZ4D2w.png\",\"https://cdn-images-1.medium.com/max/1500/1*3Nl5R_ohNDRhJ_zBJhlBcg.png\",\"https://cdn-images-1.medium.com/max/1200/1*TU1H0TawDMl9qbc6OD4iQQ.gif\",\"https://cdn-images-1.medium.com/max/1500/1*ka4AHpW0HUj64BJjfbX1kg.png\"],\"links\":[\"https://stockcharts.com/school/doku.php?id=chart_school:chart_analysis:chart_patterns:rounding_bottom_reversal\",\"https://www.investopedia.com/university/charts/charts10.asp\",\"https://tradingsim.com/blog/rounding-bottom/\",\"http://thepatternsite.com/roundb.html\",\"https://www.tradingview.com/x/Fs2zTGkU/\",\"https://www.tradingview.com/x/OdAoS0VX/\",\"https://www.tradingview.com/x/nDU5mGPE/\",\"https://www.tradingview.com/x/zyA50yDd/\",\"https://www.tradingview.com/x/x68NyuM0/\",\"https://www.tradingview.com/x/d8YBk0fA/\",\"https://zerononcense.com/\",\"http://t.me/MerkleTrader\",\"https://discord.gg/AYW5zDw\",\"https://steemit.com/@proofofresearch\",\"http://reddit.com/u/randomshortdude\",\"https://twitter.com/ProofofResearch\",\"https://blog.zerononcense.com/2018/09/14/bitcoin-long-term-price-theory-no-one-considered/\",\"https://medium.com/@proofofresearch/bitcoin-long-term-price-theory-no-one-considered-61deb9a2607c\",\"https://www.tradingview.com/chart/BTCUSD/MtsbVZOH-This-Bitcoin-Formation-Predicts-When-the-Bear-Market-Will-End/\",\"https://www.tradingview.com/chart/BTCUSD/MtsbVZOH-This-Bitcoin-Formation-Predicts-When-the-Bear-Market-Wi\"],\"app\":\"steemit/0.1\",\"format\":\"markdown\"}"
    }
  ]
}dimo-timoupvoted (100.00%) @proofofresearch / bitcoin-long-term-price-theory-no-one-considered2018/09/14 09:49:51
dimo-timoupvoted (100.00%) @proofofresearch / bitcoin-long-term-price-theory-no-one-considered
2018/09/14 09:49:51
| voter | dimo-timo |
| author | proofofresearch |
| permlink | bitcoin-long-term-price-theory-no-one-considered |
| weight | 10000 (100.00%) |
| Transaction Info | Block #25949518/Trx c4f2f5ce2bf00a023ccfa8488f99daf3d4b7db00 |
View Raw JSON Data
{
  "trx_id": "c4f2f5ce2bf00a023ccfa8488f99daf3d4b7db00",
  "block": 25949518,
  "trx_in_block": 3,
  "op_in_trx": 0,
  "virtual_op": 0,
  "timestamp": "2018-09-14T09:49:51",
  "op": [
    "vote",
    {
      "voter": "dimo-timo",
      "author": "proofofresearch",
      "permlink": "bitcoin-long-term-price-theory-no-one-considered",
      "weight": 10000
    }
  ]
}proofofresearchpublished a new post: bitcoin-long-term-price-theory-no-one-considered2018/09/14 09:41:06
proofofresearchpublished a new post: bitcoin-long-term-price-theory-no-one-considered
2018/09/14 09:41:06
| parent author | |
| parent permlink | bitcoin |
| author | proofofresearch |
| permlink | bitcoin-long-term-price-theory-no-one-considered |
| title | Bitcoin Long-Term Price Theory No One Considered |
| body | ---------- # Bitcoin Long-Term Price Theory No One Considered  Depending on who you ask, there are differing opinions on the future direction of the cryptocurrency market; specifically, Bitcoin. Some folks say that we’re right on the precipice of ending the bear market and going on a bull run for the next few months, the likes of which will bear a close resemblance to what was experienced during the 2017 holiday stretch (October to December). Others predict that Bitcoin’s bear market is just beginning, and that there’s a strong chance there will be several more precipitous declines in the price before it truly hits its ‘bottom’, which will be followed by a lengthy recovery period before any such bull market will be experienced again. And of course, there are the ‘permabears’ that believe that it’s only a matter of time before everyone wakes up and decides that Bitcoin has absolutely no inherent value while there are permabulls on the other side of those permabears that claim that its only a matter of time before every fiat currency eventually goes bust and Bitcoin becomes the only money that’s accepted. While this theory makes no assumptions and, it’s just that, a theory — we’ll stick to the details of the potential implications of this price action. # What is a Rounding Bottom Pattern?  Great question. **_Below, is an illustration:_**  Source: [https://stockcharts.com/school/doku.php?id=chart_school:chart_analysis:chart_patterns:rounding_bottom_reversal](https://stockcharts.com/school/doku.php?id=chart_school:chart_analysis:chart_patterns:rounding_bottom_reversal) Above, you get the general gist of the rounding bottom pattern formation. It pretty much looks like one large cup (keyword: large). Now, almost everything that we know about the rounding bottom chart formation is from observations and notes that have been taken on asset behavior in the traditional stock markets. Unfortunately, due to the brief time span of cryptocurrencies trading with any notable volume of cash, we don’t have a lot of data on how rounding bottom patterns play out in the crypto world. But, we’ll assume for simplicity’s sake, that the pattern should behave the same way in crypto that it would in any other crypto. Now, at this point, you’re probably asking yourself: # What’s So Special About the Rounding Bottom Chart Formation? ## **_A few things:_** 1. If this indeed is the chart formation that Bitcoin is in currently, that means that the end of the bear market is in sight. As for how long it would take for it to be officially ‘over’, is something that we’ll get into a bit later in this article. 2. If this is indeed the chart formation, then we probably have enough data points to realistically predict when the market will recover. 3. If this is the chart formation, then not only are #1 and #2 true, but the ‘worst’ of the bear market (if you’re a bull), is probably over. Now, before we move on to explain why #1, #2, and #3 are true — let’s dig a little deeper into the Rounding Bottom Formation to give you all as readers a better idea of: A) What qualifies a pattern as a Rounding Bottom Formation (No, it’s not as simple as you think it is) B) How one should effectively trade a Rounding Bottom Formation (Once again, no, this is not as simple as you think it is) C) What it really means if there truly is a Rounding Bottom Formation developing on Bitcoin # Understanding the Rounding Bottom Formation Chart Pattern Most individuals are pretty solid visual learners. So before we start really dissecting the Rounding Bottom Formation, we will display a few more photos of rounding bottoms so that you can start to formulate an idea of what they look like and in what scenarios they typically occur in.  Source: [https://www.investopedia.com/university/charts/charts10.asp](https://www.investopedia.com/university/charts/charts10.asp)    You probably get the idea by now. ## Fact #1 — Rounding Bottom Formations Are Always Bullish Because of this fact, you shouldn’t really stress whether you can discern if it’s truly a reversal or a continuation. It makes no difference. In either case, if this pattern formation has manifested and it is valid (not all chart patterns result in ‘completion’), **_one should expect the net result to be a substantial price gain._** ## Fact #2 — Rounding Bottom Formations Take a LONG Time to Manifest The Rounding Bottom Formation is not something that is meant to be identified on a time frame that’s really any lower than the daily. Ideally, you’ll be confirming this with a weekly/4 or 5-day chart. Fortunately for us, [stockcharts](https://stockcharts.com/school/doku.php?id=chart_school:chart_analysis:chart_patterns:rounding_bottom_reversal) has already thoroughly dissected what one should expect in terms of the length of a rounding bottom formation as well as the criteria that one should seek in identifying that a rounding bottom formation is truly forming. In terms of time though, one should expect that this formula will take several months at the very least. Sometimes they took up to two years to complete (in the traditional markets at least). ## Fact #3 — Volume Usually Mimics the Pattern What this means, in a nutshell, is that you should be expecting the volume bars at the bottom of your chart to be forming a cup as well. **_Check out this example below:_**  Source: [https://tradingsim.com/blog/rounding-bottom/](https://tradingsim.com/blog/rounding-bottom/) **_There’s another bended line drawn over the volume as well to illustrate this a bit better:_**  # Thomas Bulkowski’s Characteristics of a Rounding Bottom Formation  Yeah, this is really the best picture we could get of him ^ If you’re not familiar with an individual by the name of Thomas Bulkowski, you should try to change that at some point. While his personal background/details are somewhat blurry, his work in dissecting chart patterns definitely isn’t. In fact, Thomas Bulkowski is what many consider to be an expert. Thomas Bulkowski [owns ‘thepatternsite’,](http://thepatternsite.com/roundb.html) which is what we’ll go to next in order to get a better idea of his hints/tips/tricks on trading the Rounding Bottom Formation Chart Pattern. If you visit, [http://thepatternsite.com/roundb.html](http://thepatternsite.com/roundb.html) , you’ll be taken to the entry for the Rounding Bottom Chart Formation. ## Thomas Bulkowski’s Technical Assessment of the Pattern  With an average rise of 43% (from the top of the cup), and a break even failure rate of only 5%, it should start to become more readily apparent why a positive identification of a Rounding Bottom Chart Pattern Formation on Bitcoin would be significant. ## Thomas Bulkowski’s Rules on the Rounding Bottom Chart Formation     Note how there are different iterations of the Rounding Bottom Chart Formation itself that can sometimes occur. It’s important to be aware that there are some false jumps in the rounding bottom that are going to catch some traders off guard and result in a loss of funds. ---------- # Taking a Look at Bitcoin  Now that we’ve learned everything that we need to know about the Rounding Bottom Chart Formation, let’s see if we can see something similar beginning to develop on the Bitcoin chart. # Daily Resolution  [https://www.tradingview.com/x/Fs2zTGkU/](https://www.tradingview.com/x/Fs2zTGkU/) Now, before you say, “What the hell is this?”, check out the following explanation — What you see on the chart above is something called the ‘Fib wheel’. The Fib Wheel (courtesy of TradingView), was applied on this chart to get a better idea of where we should start the rounding bottom chart formation. **_Why?_** Because of the design of the Fib Wheel itself. It virtually plots out various rounding bottom formation lengths (based on fib levels). These different lengths are designed for products of varying volatility and price fluctuation. ## The Ultimate Theory Everytime the price breaks into another channel, the Rounding Bottom Chart Formation (if it is indeed present), must be considered ‘restarted at that point. _Below are the marked restart points to help you out:_  [https://www.tradingview.com/x/OdAoS0VX/](https://www.tradingview.com/x/OdAoS0VX/) So, only twice thus far — technically. These times are represented by the transparent blue boxes in the photo above. As you can see, the latest blue box can be detected at the start of the .786 ring level of our Fib Wheel. # What the Wheel / Rounding Bottom Formation Predicts  [https://www.tradingview.com/x/nDU5mGPE/](https://www.tradingview.com/x/nDU5mGPE/) Based on the wheel is showing us here, the ‘low’ **_could potentially_** be at $2,921/Bitcoin. This does not mean that it is an iron clad guarantee — the price could ‘dance around’ this $2.9k mark. But, at the very least, assuming that the price remained in this channel without breaking south or north, it will eventually touch down somewhere around $2.9k. The chart shows that this would occur at some point around the beginning of November. While this is not unreasonable by any means, the price is a significant ways away from that point currently:  [https://www.tradingview.com/x/zyA50yDd/](https://www.tradingview.com/x/zyA50yDd/) If the price did touch this point, it would represent a 55.66% loss in price in a little under two months from this present point. However, Bitcoin is no stranger to such drops, and there’s a chance that it could eventually backslide in price again as it tests the top of the rounding formation’s ‘range’ (what would essentially break the pattern altogether).  [https://www.tradingview.com/x/x68NyuM0/](https://www.tradingview.com/x/x68NyuM0/) The two red boxes in the chart above show that the price has been duly rejected twice when it has attempted to break through to the next Fib pattern/layer. Currently, the overhead resistance is at $6.9k. # More Information About Our Daily Resolution Rounding Bottom  So far we know a good amount of inforamtion, but we don’t know everything we **_need to know_**. **_Here’s a list of some important things to remember/consider:_** ## Fact #1 The ‘lip’ of the cup is at $10k. ## Fact #2 The potential bottom is at $3k ## Fact #3 The cup predicts that the lip may be surpassed at any point between April 11th 2019 and June 19th, 2019 ## Fact #4 The rounding bottom formation (as applied in this case), predicts that the ATH may be broken at any point between June 20th, 2019 and August 17th, 2019. **_Here’s an illustration to reflect all of those ideas:_**  [https://www.tradingview.com/x/d8YBk0fA/](https://www.tradingview.com/x/d8YBk0fA/) # Conclusion Whether you believe in the Rounding Bottom Chart Formation is entirely up to you. At this point, it’s not a verified chart pattern. This piece was simply to provoke some thought and cause some individuals to consider alternative scenarios to the ones that they may have in their heads currently. If you notice, this theory dictates a price action that actually matches many of the more popular theories about Bitcoin’s price movement that are out there at this point in time. Thus, it seemed worthwhile to put this theory out there to see if we can actually put a ‘face to the name’, so to speak. As always, good luck trading! This is definitely not financial advice of any sort and you should be making your own decisions about how you’d like to go about things. |
| json metadata | {"tags":["bitcoin","crypto","cryptocurrency","priceanalysis","technicalanalysis"],"image":["https://cdn-images-1.medium.com/max/1200/1*hxyoyzGaUsHs-0GYaxiv0g.gif","https://cdn-images-1.medium.com/max/1200/1*be8jO2BRzJBzRvycPbICeg.gif","https://cdn-images-1.medium.com/max/1200/0*gHVaRro8tGtppFyu.png","https://cdn-images-1.medium.com/max/1200/0*lTyzz8Q68QXAJp7b.jpg","https://cdn-images-1.medium.com/max/1200/0*Ao196f6WdmhUd23C.png","https://cdn-images-1.medium.com/max/1200/0*BbHOE9Jj5PJ4X5_J.png","https://cdn-images-1.medium.com/max/1200/0*JVu0WxaIJxmskKtM.png","https://cdn-images-1.medium.com/max/1500/0*GHt60HGLMyQSA3eY.png","https://cdn-images-1.medium.com/max/1500/1*L2HIQZ_9lmKTRAHZhmia0w.png","https://cdn-images-1.medium.com/max/1200/0*_6MFY4_tyvSGmmob.jpg","https://cdn-images-1.medium.com/max/1200/1*WKUTu33vJGl1bYCVrmFIpA.png","https://cdn-images-1.medium.com/max/1500/1*RgI-9z9AlP2K0eCsfKWoKw.png","https://cdn-images-1.medium.com/max/1500/1*pRNh0NxmIA8PlzzPFRjZkg.png","https://cdn-images-1.medium.com/max/1500/1*bd3q8J1VZG11n0mzehqgzw.png","https://cdn-images-1.medium.com/max/1500/1*MOVqTXg-Cnc3_IWoUF2-bA.png","https://cdn-images-1.medium.com/max/1200/1*10kG05oZZOfQdVXnYBsGrQ.gif","https://cdn-images-1.medium.com/max/1500/1*-oJD2DTpYX3yFEm7bhroDQ.png","https://cdn-images-1.medium.com/max/1500/1*H0GTN1HX9iNcczCK38GRuw.png","https://cdn-images-1.medium.com/max/1500/1*ctP7xyzx8h0_6iVXJjIloQ.png","https://cdn-images-1.medium.com/max/1500/1*t5zEPZ2At3yD2OofNZ4D2w.png","https://cdn-images-1.medium.com/max/1500/1*3Nl5R_ohNDRhJ_zBJhlBcg.png","https://cdn-images-1.medium.com/max/1200/1*TU1H0TawDMl9qbc6OD4iQQ.gif","https://cdn-images-1.medium.com/max/1500/1*ka4AHpW0HUj64BJjfbX1kg.png"],"links":["https://stockcharts.com/school/doku.php?id=chart_school:chart_analysis:chart_patterns:rounding_bottom_reversal","https://www.investopedia.com/university/charts/charts10.asp","https://tradingsim.com/blog/rounding-bottom/","http://thepatternsite.com/roundb.html","https://www.tradingview.com/x/Fs2zTGkU/","https://www.tradingview.com/x/OdAoS0VX/","https://www.tradingview.com/x/nDU5mGPE/","https://www.tradingview.com/x/zyA50yDd/","https://www.tradingview.com/x/x68NyuM0/","https://www.tradingview.com/x/d8YBk0fA/"],"app":"steemit/0.1","format":"markdown"} |
| Transaction Info | Block #25949343/Trx 8bcc5c19f961aef8957e606123453f9068c4c808 |
View Raw JSON Data
{
"trx_id": "8bcc5c19f961aef8957e606123453f9068c4c808",
"block": 25949343,
"trx_in_block": 1,
"op_in_trx": 0,
"virtual_op": 0,
"timestamp": "2018-09-14T09:41:06",
"op": [
"comment",
{
"parent_author": "",
"parent_permlink": "bitcoin",
"author": "proofofresearch",
"permlink": "bitcoin-long-term-price-theory-no-one-considered",
"title": "Bitcoin Long-Term Price Theory No One Considered",
"body": "----------\n\n# Bitcoin Long-Term Price Theory No One Considered\n\n\n\nDepending on who you ask, there are differing opinions on the future direction of the cryptocurrency market; specifically, Bitcoin.\n\nSome folks say that we’re right on the precipice of ending the bear market and going on a bull run for the next few months, the likes of which will bear a close resemblance to what was experienced during the 2017 holiday stretch (October to December).\n\nOthers predict that Bitcoin’s bear market is just beginning, and that there’s a strong chance there will be several more precipitous declines in the price before it truly hits its ‘bottom’, which will be followed by a lengthy recovery period before any such bull market will be experienced again.\n\nAnd of course, there are the ‘permabears’ that believe that it’s only a matter of time before everyone wakes up and decides that Bitcoin has absolutely no inherent value while there are permabulls on the other side of those permabears that claim that its only a matter of time before every fiat currency eventually goes bust and Bitcoin becomes the only money that’s accepted.\n\nWhile this theory makes no assumptions and, it’s just that, a theory — we’ll stick to the details of the potential implications of this price action.\n\n# What is a Rounding Bottom Pattern?\n\n\n\nGreat question.\n\n**_Below, is an illustration:_**\n\n\n\nSource: [https://stockcharts.com/school/doku.php?id=chart_school:chart_analysis:chart_patterns:rounding_bottom_reversal](https://stockcharts.com/school/doku.php?id=chart_school:chart_analysis:chart_patterns:rounding_bottom_reversal)\n\nAbove, you get the general gist of the rounding bottom pattern formation. It pretty much looks like one large cup (keyword: large).\n\nNow, almost everything that we know about the rounding bottom chart formation is from observations and notes that have been taken on asset behavior in the traditional stock markets.\n\nUnfortunately, due to the brief time span of cryptocurrencies trading with any notable volume of cash, we don’t have a lot of data on how rounding bottom patterns play out in the crypto world. But, we’ll assume for simplicity’s sake, that the pattern should behave the same way in crypto that it would in any other crypto.\n\nNow, at this point, you’re probably asking yourself:\n\n# What’s So Special About the Rounding Bottom Chart Formation?\n\n## **_A few things:_**\n\n1. If this indeed is the chart formation that Bitcoin is in currently, that means that the end of the bear market is in sight. As for how long it would take for it to be officially ‘over’, is something that we’ll get into a bit later in this article.\n2. If this is indeed the chart formation, then we probably have enough data points to realistically predict when the market will recover.\n3. If this is the chart formation, then not only are #1 and #2 true, but the ‘worst’ of the bear market (if you’re a bull), is probably over.\n\nNow, before we move on to explain why #1, #2, and #3 are true — let’s dig a little deeper into the Rounding Bottom Formation to give you all as readers a better idea of:\n\nA) What qualifies a pattern as a Rounding Bottom Formation (No, it’s not as simple as you think it is)\n\nB) How one should effectively trade a Rounding Bottom Formation (Once again, no, this is not as simple as you think it is)\n\nC) What it really means if there truly is a Rounding Bottom Formation developing on Bitcoin\n\n# Understanding the Rounding Bottom Formation Chart Pattern\n\nMost individuals are pretty solid visual learners. So before we start really dissecting the Rounding Bottom Formation, we will display a few more photos of rounding bottoms so that you can start to formulate an idea of what they look like and in what scenarios they typically occur in.\n\n\n\nSource: [https://www.investopedia.com/university/charts/charts10.asp](https://www.investopedia.com/university/charts/charts10.asp)\n\n\n\n\n\n\n\nYou probably get the idea by now.\n\n## Fact #1 — Rounding Bottom Formations Are Always Bullish\n\nBecause of this fact, you shouldn’t really stress whether you can discern if it’s truly a reversal or a continuation.\n\nIt makes no difference.\n\nIn either case, if this pattern formation has manifested and it is valid (not all chart patterns result in ‘completion’), **_one should expect the net result to be a substantial price gain._**\n\n## Fact #2 — Rounding Bottom Formations Take a LONG Time to Manifest\n\nThe Rounding Bottom Formation is not something that is meant to be identified on a time frame that’s really any lower than the daily. Ideally, you’ll be confirming this with a weekly/4 or 5-day chart.\n\nFortunately for us, [stockcharts](https://stockcharts.com/school/doku.php?id=chart_school:chart_analysis:chart_patterns:rounding_bottom_reversal) has already thoroughly dissected what one should expect in terms of the length of a rounding bottom formation as well as the criteria that one should seek in identifying that a rounding bottom formation is truly forming.\n\nIn terms of time though, one should expect that this formula will take several months at the very least. Sometimes they took up to two years to complete (in the traditional markets at least).\n\n## Fact #3 — Volume Usually Mimics the Pattern\n\nWhat this means, in a nutshell, is that you should be expecting the volume bars at the bottom of your chart to be forming a cup as well.\n\n**_Check out this example below:_**\n\n\n\nSource: [https://tradingsim.com/blog/rounding-bottom/](https://tradingsim.com/blog/rounding-bottom/)\n\n**_There’s another bended line drawn over the volume as well to illustrate this a bit better:_**\n\n\n\n# Thomas Bulkowski’s Characteristics of a Rounding Bottom Formation\n\n\n\nYeah, this is really the best picture we could get of him ^\n\nIf you’re not familiar with an individual by the name of Thomas Bulkowski, you should try to change that at some point.\n\nWhile his personal background/details are somewhat blurry, his work in dissecting chart patterns definitely isn’t. In fact, Thomas Bulkowski is what many consider to be an expert.\n\nThomas Bulkowski [owns ‘thepatternsite’,](http://thepatternsite.com/roundb.html) which is what we’ll go to next in order to get a better idea of his hints/tips/tricks on trading the Rounding Bottom Formation Chart Pattern.\n\nIf you visit, [http://thepatternsite.com/roundb.html](http://thepatternsite.com/roundb.html) , you’ll be taken to the entry for the Rounding Bottom Chart Formation.\n\n## Thomas Bulkowski’s Technical Assessment of the Pattern\n\n\n\nWith an average rise of 43% (from the top of the cup), and a break even failure rate of only 5%, it should start to become more readily apparent why a positive identification of a Rounding Bottom Chart Pattern Formation on Bitcoin would be significant.\n\n## Thomas Bulkowski’s Rules on the Rounding Bottom Chart Formation\n\n\n\n\n\n\n\n\n\nNote how there are different iterations of the Rounding Bottom Chart Formation itself that can sometimes occur. It’s important to be aware that there are some false jumps in the rounding bottom that are going to catch some traders off guard and result in a loss of funds.\n\n----------\n\n# Taking a Look at Bitcoin\n\n\n\nNow that we’ve learned everything that we need to know about the Rounding Bottom Chart Formation, let’s see if we can see something similar beginning to develop on the Bitcoin chart.\n\n# Daily Resolution\n\n\n\n[https://www.tradingview.com/x/Fs2zTGkU/](https://www.tradingview.com/x/Fs2zTGkU/)\n\nNow, before you say, “What the hell is this?”, check out the following explanation —\n\nWhat you see on the chart above is something called the ‘Fib wheel’. The Fib Wheel (courtesy of TradingView), was applied on this chart to get a better idea of where we should start the rounding bottom chart formation.\n\n**_Why?_**\n\nBecause of the design of the Fib Wheel itself. It virtually plots out various rounding bottom formation lengths (based on fib levels).\n\nThese different lengths are designed for products of varying volatility and price fluctuation.\n\n## The Ultimate Theory\n\nEverytime the price breaks into another channel, the Rounding Bottom Chart Formation (if it is indeed present), must be considered ‘restarted at that point.\n\n_Below are the marked restart points to help you out:_\n\n\n\n[https://www.tradingview.com/x/OdAoS0VX/](https://www.tradingview.com/x/OdAoS0VX/)\n\nSo, only twice thus far — technically. These times are represented by the transparent blue boxes in the photo above.\n\nAs you can see, the latest blue box can be detected at the start of the .786 ring level of our Fib Wheel.\n\n# What the Wheel / Rounding Bottom Formation Predicts\n\n\n\n[https://www.tradingview.com/x/nDU5mGPE/](https://www.tradingview.com/x/nDU5mGPE/)\n\nBased on the wheel is showing us here, the ‘low’ **_could potentially_** be at $2,921/Bitcoin.\n\nThis does not mean that it is an iron clad guarantee — the price could ‘dance around’ this $2.9k mark. But, at the very least, assuming that the price remained in this channel without breaking south or north, it will eventually touch down somewhere around $2.9k.\n\nThe chart shows that this would occur at some point around the beginning of November. While this is not unreasonable by any means, the price is a significant ways away from that point currently:\n\n\n\n[https://www.tradingview.com/x/zyA50yDd/](https://www.tradingview.com/x/zyA50yDd/)\n\nIf the price did touch this point, it would represent a 55.66% loss in price in a little under two months from this present point.\n\nHowever, Bitcoin is no stranger to such drops, and there’s a chance that it could eventually backslide in price again as it tests the top of the rounding formation’s ‘range’ (what would essentially break the pattern altogether).\n\n\n\n[https://www.tradingview.com/x/x68NyuM0/](https://www.tradingview.com/x/x68NyuM0/)\n\nThe two red boxes in the chart above show that the price has been duly rejected twice when it has attempted to break through to the next Fib pattern/layer.\n\nCurrently, the overhead resistance is at $6.9k.\n\n# More Information About Our Daily Resolution Rounding Bottom\n\n\n\nSo far we know a good amount of inforamtion, but we don’t know everything we **_need to know_**.\n\n**_Here’s a list of some important things to remember/consider:_**\n\n## Fact #1\n\nThe ‘lip’ of the cup is at $10k.\n\n## Fact #2\n\nThe potential bottom is at $3k\n\n## Fact #3\n\nThe cup predicts that the lip may be surpassed at any point between April 11th 2019 and June 19th, 2019\n\n## Fact #4\n\nThe rounding bottom formation (as applied in this case), predicts that the ATH may be broken at any point between June 20th, 2019 and August 17th, 2019.\n\n**_Here’s an illustration to reflect all of those ideas:_**\n\n\n\n[https://www.tradingview.com/x/d8YBk0fA/](https://www.tradingview.com/x/d8YBk0fA/)\n\n# Conclusion\n\nWhether you believe in the Rounding Bottom Chart Formation is entirely up to you.\n\nAt this point, it’s not a verified chart pattern. This piece was simply to provoke some thought and cause some individuals to consider alternative scenarios to the ones that they may have in their heads currently.\n\nIf you notice, this theory dictates a price action that actually matches many of the more popular theories about Bitcoin’s price movement that are out there at this point in time.\n\nThus, it seemed worthwhile to put this theory out there to see if we can actually put a ‘face to the name’, so to speak.\n\nAs always, good luck trading! This is definitely not financial advice of any sort and you should be making your own decisions about how you’d like to go about things.",
"json_metadata": "{\"tags\":[\"bitcoin\",\"crypto\",\"cryptocurrency\",\"priceanalysis\",\"technicalanalysis\"],\"image\":[\"https://cdn-images-1.medium.com/max/1200/1*hxyoyzGaUsHs-0GYaxiv0g.gif\",\"https://cdn-images-1.medium.com/max/1200/1*be8jO2BRzJBzRvycPbICeg.gif\",\"https://cdn-images-1.medium.com/max/1200/0*gHVaRro8tGtppFyu.png\",\"https://cdn-images-1.medium.com/max/1200/0*lTyzz8Q68QXAJp7b.jpg\",\"https://cdn-images-1.medium.com/max/1200/0*Ao196f6WdmhUd23C.png\",\"https://cdn-images-1.medium.com/max/1200/0*BbHOE9Jj5PJ4X5_J.png\",\"https://cdn-images-1.medium.com/max/1200/0*JVu0WxaIJxmskKtM.png\",\"https://cdn-images-1.medium.com/max/1500/0*GHt60HGLMyQSA3eY.png\",\"https://cdn-images-1.medium.com/max/1500/1*L2HIQZ_9lmKTRAHZhmia0w.png\",\"https://cdn-images-1.medium.com/max/1200/0*_6MFY4_tyvSGmmob.jpg\",\"https://cdn-images-1.medium.com/max/1200/1*WKUTu33vJGl1bYCVrmFIpA.png\",\"https://cdn-images-1.medium.com/max/1500/1*RgI-9z9AlP2K0eCsfKWoKw.png\",\"https://cdn-images-1.medium.com/max/1500/1*pRNh0NxmIA8PlzzPFRjZkg.png\",\"https://cdn-images-1.medium.com/max/1500/1*bd3q8J1VZG11n0mzehqgzw.png\",\"https://cdn-images-1.medium.com/max/1500/1*MOVqTXg-Cnc3_IWoUF2-bA.png\",\"https://cdn-images-1.medium.com/max/1200/1*10kG05oZZOfQdVXnYBsGrQ.gif\",\"https://cdn-images-1.medium.com/max/1500/1*-oJD2DTpYX3yFEm7bhroDQ.png\",\"https://cdn-images-1.medium.com/max/1500/1*H0GTN1HX9iNcczCK38GRuw.png\",\"https://cdn-images-1.medium.com/max/1500/1*ctP7xyzx8h0_6iVXJjIloQ.png\",\"https://cdn-images-1.medium.com/max/1500/1*t5zEPZ2At3yD2OofNZ4D2w.png\",\"https://cdn-images-1.medium.com/max/1500/1*3Nl5R_ohNDRhJ_zBJhlBcg.png\",\"https://cdn-images-1.medium.com/max/1200/1*TU1H0TawDMl9qbc6OD4iQQ.gif\",\"https://cdn-images-1.medium.com/max/1500/1*ka4AHpW0HUj64BJjfbX1kg.png\"],\"links\":[\"https://stockcharts.com/school/doku.php?id=chart_school:chart_analysis:chart_patterns:rounding_bottom_reversal\",\"https://www.investopedia.com/university/charts/charts10.asp\",\"https://tradingsim.com/blog/rounding-bottom/\",\"http://thepatternsite.com/roundb.html\",\"https://www.tradingview.com/x/Fs2zTGkU/\",\"https://www.tradingview.com/x/OdAoS0VX/\",\"https://www.tradingview.com/x/nDU5mGPE/\",\"https://www.tradingview.com/x/zyA50yDd/\",\"https://www.tradingview.com/x/x68NyuM0/\",\"https://www.tradingview.com/x/d8YBk0fA/\"],\"app\":\"steemit/0.1\",\"format\":\"markdown\"}"
}
]
}proofofresearchreceived 0.030 STEEM, 0.038 SP author reward for @proofofresearch / bitcoin-trade-strategy-aggressive-short-mode2018/09/14 03:29:12
proofofresearchreceived 0.030 STEEM, 0.038 SP author reward for @proofofresearch / bitcoin-trade-strategy-aggressive-short-mode
2018/09/14 03:29:12
| author | proofofresearch |
| permlink | bitcoin-trade-strategy-aggressive-short-mode |
| sbd payout | 0.000 SBD |
| steem payout | 0.030 STEEM |
| vesting payout | 62.680859 VESTS |
| Transaction Info | Block #25941909/Virtual Operation #4 |
View Raw JSON Data
{
  "trx_id": "0000000000000000000000000000000000000000",
  "block": 25941909,
  "trx_in_block": 4294967295,
  "op_in_trx": 0,
  "virtual_op": 4,
  "timestamp": "2018-09-14T03:29:12",
  "op": [
    "author_reward",
    {
      "author": "proofofresearch",
      "permlink": "bitcoin-trade-strategy-aggressive-short-mode",
      "sbd_payout": "0.000 SBD",
      "steem_payout": "0.030 STEEM",
      "vesting_payout": "62.680859 VESTS"
    }
  ]
}cryptomazinupvoted (100.00%) @proofofresearch / stellar-price-analysis2018/09/13 01:59:42
cryptomazinupvoted (100.00%) @proofofresearch / stellar-price-analysis
2018/09/13 01:59:42
| voter | cryptomazin |
| author | proofofresearch |
| permlink | stellar-price-analysis |
| weight | 10000 (100.00%) |
| Transaction Info | Block #25911331/Trx 5fe6b48cef7766fbf3be8e5b58c361016bdb949d |
View Raw JSON Data
{
  "trx_id": "5fe6b48cef7766fbf3be8e5b58c361016bdb949d",
  "block": 25911331,
  "trx_in_block": 38,
  "op_in_trx": 0,
  "virtual_op": 0,
  "timestamp": "2018-09-13T01:59:42",
  "op": [
    "vote",
    {
      "voter": "cryptomazin",
      "author": "proofofresearch",
      "permlink": "stellar-price-analysis",
      "weight": 10000
    }
  ]
}thetroublenotesupvoted (2.00%) @proofofresearch / stellar-price-analysis2018/09/12 21:41:54
thetroublenotesupvoted (2.00%) @proofofresearch / stellar-price-analysis
2018/09/12 21:41:54
| voter | thetroublenotes |
| author | proofofresearch |
| permlink | stellar-price-analysis |
| weight | 200 (2.00%) |
| Transaction Info | Block #25906177/Trx 12c8e944296ff23241f4875ba4eb276c387d2112 |
View Raw JSON Data
{
  "trx_id": "12c8e944296ff23241f4875ba4eb276c387d2112",
  "block": 25906177,
  "trx_in_block": 8,
  "op_in_trx": 0,
  "virtual_op": 0,
  "timestamp": "2018-09-12T21:41:54",
  "op": [
    "vote",
    {
      "voter": "thetroublenotes",
      "author": "proofofresearch",
      "permlink": "stellar-price-analysis",
      "weight": 200
    }
  ]
}2018/09/12 21:33:51
2018/09/12 21:33:51
| parent author | proofofresearch |
| parent permlink | stellar-price-analysis |
| author | offgridlife |
| permlink | offgridlife-re-proofofresearch-stellar-price-analysis-20180912t213349935z |
| title | |
| body | Stellar looked great today. Posted using [Partiko iOS](https://steemit.com/@partiko-ios) |
| json metadata | {"app":"partiko"} |
| Transaction Info | Block #25906016/Trx a42fb7a106aecaae39d4a201d6ea30296d518cb7 |
View Raw JSON Data
{
  "trx_id": "a42fb7a106aecaae39d4a201d6ea30296d518cb7",
  "block": 25906016,
  "trx_in_block": 5,
  "op_in_trx": 0,
  "virtual_op": 0,
  "timestamp": "2018-09-12T21:33:51",
  "op": [
    "comment",
    {
      "parent_author": "proofofresearch",
      "parent_permlink": "stellar-price-analysis",
      "author": "offgridlife",
      "permlink": "offgridlife-re-proofofresearch-stellar-price-analysis-20180912t213349935z",
      "title": "",
      "body": "Stellar looked great today. \n\nPosted using [Partiko iOS](https://steemit.com/@partiko-ios)",
      "json_metadata": "{\"app\":\"partiko\"}"
    }
  ]
}proofofresearchpublished a new post: stellar-price-analysis2018/09/12 21:25:30
proofofresearchpublished a new post: stellar-price-analysis
2018/09/12 21:25:30
| parent author | |
| parent permlink | bitcoin |
| author | proofofresearch |
| permlink | stellar-price-analysis |
| title | Stellar Price Analysis |
| body | @@ -9139,8 +9139,1142 @@ od luck! +%0A%0A### Disclaimer%0A%0AThis article is not financial advice. The author is not a financial advisor and this article was not paid for.%0A%0AFor more information like this, join/follow our %5BWebsite%5D(https://zerononcense.com/), %5BTelegram%5D(http://t.me/MerkleTrader), %5BDiscord%5D(https://discord.gg/AYW5zDw), %5BSteemit%5D(https://steemit.com/@proofofresearch), %5BReddit%5D(http://reddit.com/u/randomshortdude), and %5BTwitter%5D(https://twitter.com/ProofofResearch)!%0A%0A### This Analysis Was Also Posted On:%0A%0AWebsite = %5Bhttps://blog.zerononcense.com/2018/09/12/stellar-price-analysis-9-12-2018/%5D(https://blog.zerononcense.com/2018/09/12/stellar-price-analysis-9-12-2018/)%0A%0ASteemit = %5Bhttps://steemit.com/bitcoin/@proofofresearch/stellar-price-analysis%5D(https://steemit.com/bitcoin/@proofofresearch/stellar-price-analysis)%0A%0AMedium = %5Bhttps://medium.com/@proofofresearch/stellar-price-analysis-c83da46b88d7%5D(https://medium.com/@proofofresearch/stellar-price-analysis-c83da46b88d7)%0A%0ATradingView = %5Bhttps://www.tradingview.com/chart/XLMUSD/yDh74NCv-Stellar-Lumens-COULD-Be-Bullish/%5D(https://www.tradingview.com/chart/XLMUSD/yDh74NCv-Stellar-Lumens-COULD-Be-Bullish/) |
| json metadata | {"tags":["bitcoin","crypto","cryptocurrency","priceanalysis","technicalanalysis"],"image":["https://cdn-images-1.medium.com/max/1000/1*AZvjIk56TcYbwumIepxA1A.gif","https://cdn-images-1.medium.com/max/1250/1*UXQan73GKVlsT08qt4FxYA.png","https://cdn-images-1.medium.com/max/1250/1*-SZ2JUEu7vHTHmgCkqjqYw.png","https://cdn-images-1.medium.com/max/1250/1*vBfBUK8aK5GBWuuigrkclQ.png","https://cdn-images-1.medium.com/max/1250/1*kSWnbOd6LLqekLpm8ugPBA.png","https://cdn-images-1.medium.com/max/1250/1*clGI4U1V7MWQV18qwh473g.png","https://cdn-images-1.medium.com/max/1250/1*H3DvvPzzrrn2eJDHpp31Cg.png","https://cdn-images-1.medium.com/max/1250/1*YObQuX9B3GQulrVdclDyAQ.png","https://cdn-images-1.medium.com/max/1000/0*QQtZeVGoOXl_t4YG.png","https://cdn-images-1.medium.com/max/1250/1*kb_MDATOu0rNf9xFmxHmbA.png","https://cdn-images-1.medium.com/max/1250/1*ejkYjlINucBg90L8K1lVJQ.png","https://cdn-images-1.medium.com/max/1250/1*nBlDKZKP3Qejr__MW51gnQ.png","https://cdn-images-1.medium.com/max/1250/1*h-BeruCYA1LsBb5kHkwQmw.png","https://cdn-images-1.medium.com/max/1250/1*ZP9XU53zfyy8XipycgUegQ.png","https://cdn-images-1.medium.com/max/1250/1*P2h8CT7f7lWc9ktAvvGMmg.png","https://cdn-images-1.medium.com/max/1250/1*qhudT5BVs-NnDDnhMmbksg.png"],"links":["https://www.coindesk.com/ibm-debuts-stellar-powered-blockchain-world-wire-payments-system/","https://www.ibm.com/blockchain/solutions/world-wire","https://www.tradingview.com/x/AqJa3mQX/","https://www.tradingview.com/x/H4OVXlep/","https://www.tradingview.com/x/csD82Ba4/","https://www.tradingview.com/x/mK0lAJ75/","https://www.tradingview.com/x/bw39LwSr/","https://www.tradingview.com/x/5GRJXw86/","https://www.tradingview.com/x/nUJd8L0v/","https://www.investopedia.com/terms/f/flag.asp","https://www.tradingview.com/x/4Ra2keSd/","https://www.tradingview.com/x/lnjxNyoN/","https://www.tradingview.com/x/TxPPgfjh/","https://www.tradingview.com/x/J24FxFys/","https://www.tradingview.com/x/J9ev1KdU/","https://www.tradingview.com/x/ZalMt5vn/","https://zerononcense.com/","http://t.me/MerkleTrader","https://discord.gg/AYW5zDw","https://steemit.com/@proofofresearch","http://reddit.com/u/randomshortdude","https://twitter.com/ProofofResearch","https://blog.zerononcense.com/2018/09/12/stellar-price-analysis-9-12-2018/","https://steemit.com/bitcoin/@proofofresearch/stellar-price-analysis","https://medium.com/@proofofresearch/stellar-price-analysis-c83da46b88d7","https://www.tradingview.com/chart/XLMUSD/yDh74NCv-Stellar-Lumens-COULD-Be-Bullish/"],"app":"steemit/0.1","format":"markdown"} |
| Transaction Info | Block #25905849/Trx 3a5998e6fc8633d7c1f196a5e2cc68ff6e60cfb8 |
View Raw JSON Data
{
  "trx_id": "3a5998e6fc8633d7c1f196a5e2cc68ff6e60cfb8",
  "block": 25905849,
  "trx_in_block": 2,
  "op_in_trx": 0,
  "virtual_op": 0,
  "timestamp": "2018-09-12T21:25:30",
  "op": [
    "comment",
    {
      "parent_author": "",
      "parent_permlink": "bitcoin",
      "author": "proofofresearch",
      "permlink": "stellar-price-analysis",
      "title": "Stellar Price Analysis",
      "body": "@@ -9139,8 +9139,1142 @@\n od luck!\n+%0A%0A### Disclaimer%0A%0AThis article is not financial advice. The author is not a financial advisor and this article was not paid for.%0A%0AFor more information like this, join/follow our %5BWebsite%5D(https://zerononcense.com/), %5BTelegram%5D(http://t.me/MerkleTrader), %5BDiscord%5D(https://discord.gg/AYW5zDw), %5BSteemit%5D(https://steemit.com/@proofofresearch), %5BReddit%5D(http://reddit.com/u/randomshortdude), and %5BTwitter%5D(https://twitter.com/ProofofResearch)!%0A%0A### This Analysis Was Also Posted On:%0A%0AWebsite = %5Bhttps://blog.zerononcense.com/2018/09/12/stellar-price-analysis-9-12-2018/%5D(https://blog.zerononcense.com/2018/09/12/stellar-price-analysis-9-12-2018/)%0A%0ASteemit = %5Bhttps://steemit.com/bitcoin/@proofofresearch/stellar-price-analysis%5D(https://steemit.com/bitcoin/@proofofresearch/stellar-price-analysis)%0A%0AMedium = %5Bhttps://medium.com/@proofofresearch/stellar-price-analysis-c83da46b88d7%5D(https://medium.com/@proofofresearch/stellar-price-analysis-c83da46b88d7)%0A%0ATradingView = %5Bhttps://www.tradingview.com/chart/XLMUSD/yDh74NCv-Stellar-Lumens-COULD-Be-Bullish/%5D(https://www.tradingview.com/chart/XLMUSD/yDh74NCv-Stellar-Lumens-COULD-Be-Bullish/)\n",
      "json_metadata": "{\"tags\":[\"bitcoin\",\"crypto\",\"cryptocurrency\",\"priceanalysis\",\"technicalanalysis\"],\"image\":[\"https://cdn-images-1.medium.com/max/1000/1*AZvjIk56TcYbwumIepxA1A.gif\",\"https://cdn-images-1.medium.com/max/1250/1*UXQan73GKVlsT08qt4FxYA.png\",\"https://cdn-images-1.medium.com/max/1250/1*-SZ2JUEu7vHTHmgCkqjqYw.png\",\"https://cdn-images-1.medium.com/max/1250/1*vBfBUK8aK5GBWuuigrkclQ.png\",\"https://cdn-images-1.medium.com/max/1250/1*kSWnbOd6LLqekLpm8ugPBA.png\",\"https://cdn-images-1.medium.com/max/1250/1*clGI4U1V7MWQV18qwh473g.png\",\"https://cdn-images-1.medium.com/max/1250/1*H3DvvPzzrrn2eJDHpp31Cg.png\",\"https://cdn-images-1.medium.com/max/1250/1*YObQuX9B3GQulrVdclDyAQ.png\",\"https://cdn-images-1.medium.com/max/1000/0*QQtZeVGoOXl_t4YG.png\",\"https://cdn-images-1.medium.com/max/1250/1*kb_MDATOu0rNf9xFmxHmbA.png\",\"https://cdn-images-1.medium.com/max/1250/1*ejkYjlINucBg90L8K1lVJQ.png\",\"https://cdn-images-1.medium.com/max/1250/1*nBlDKZKP3Qejr__MW51gnQ.png\",\"https://cdn-images-1.medium.com/max/1250/1*h-BeruCYA1LsBb5kHkwQmw.png\",\"https://cdn-images-1.medium.com/max/1250/1*ZP9XU53zfyy8XipycgUegQ.png\",\"https://cdn-images-1.medium.com/max/1250/1*P2h8CT7f7lWc9ktAvvGMmg.png\",\"https://cdn-images-1.medium.com/max/1250/1*qhudT5BVs-NnDDnhMmbksg.png\"],\"links\":[\"https://www.coindesk.com/ibm-debuts-stellar-powered-blockchain-world-wire-payments-system/\",\"https://www.ibm.com/blockchain/solutions/world-wire\",\"https://www.tradingview.com/x/AqJa3mQX/\",\"https://www.tradingview.com/x/H4OVXlep/\",\"https://www.tradingview.com/x/csD82Ba4/\",\"https://www.tradingview.com/x/mK0lAJ75/\",\"https://www.tradingview.com/x/bw39LwSr/\",\"https://www.tradingview.com/x/5GRJXw86/\",\"https://www.tradingview.com/x/nUJd8L0v/\",\"https://www.investopedia.com/terms/f/flag.asp\",\"https://www.tradingview.com/x/4Ra2keSd/\",\"https://www.tradingview.com/x/lnjxNyoN/\",\"https://www.tradingview.com/x/TxPPgfjh/\",\"https://www.tradingview.com/x/J24FxFys/\",\"https://www.tradingview.com/x/J9ev1KdU/\",\"https://www.tradingview.com/x/ZalMt5vn/\",\"https://zerononcense.com/\",\"http://t.me/MerkleTrader\",\"https://discord.gg/AYW5zDw\",\"https://steemit.com/@proofofresearch\",\"http://reddit.com/u/randomshortdude\",\"https://twitter.com/ProofofResearch\",\"https://blog.zerononcense.com/2018/09/12/stellar-price-analysis-9-12-2018/\",\"https://steemit.com/bitcoin/@proofofresearch/stellar-price-analysis\",\"https://medium.com/@proofofresearch/stellar-price-analysis-c83da46b88d7\",\"https://www.tradingview.com/chart/XLMUSD/yDh74NCv-Stellar-Lumens-COULD-Be-Bullish/\"],\"app\":\"steemit/0.1\",\"format\":\"markdown\"}"
    }
  ]
}proofofresearchpublished a new post: stellar-price-analysis2018/09/12 21:12:54
proofofresearchpublished a new post: stellar-price-analysis
2018/09/12 21:12:54
| parent author | |
| parent permlink | bitcoin |
| author | proofofresearch |
| permlink | stellar-price-analysis |
| title | Stellar Price Analysis |
| body | # Stellar Price Analysis  # Foreword/Introduction This is an analysis that felt near-mandatory given the amount of fairly bullish news that has come across the wires for Stellar in the last couple of weeks. As we’ve mentioned in some of our former price analyses, the partnership between IBM and Stellar has been the gift that keeps on giving in terms of the updates and developments that have been churned out from the pairing. Most recently, Stellar investors were rewarded with the news that [IBM is launching a ‘Blockchain World Wire’ payment system](https://www.coindesk.com/ibm-debuts-stellar-powered-blockchain-world-wire-payments-system/). In fact, that prior statement should not be put in the past tense, because the [system is actually live as we speak.](https://www.ibm.com/blockchain/solutions/world-wire) It probably goes without saying, but this news is astronomical in terms of Stellar’s future potential (per usual). This is following the news that came out a little over a month ago informing investors and the general public alike that IBM would be building a stable coin atop of the protocol as well. **_The reason why this news is bullish is because:_** 1. It seriously validates Stellar as a blockchain protocol. It shows that Stellar has clearly met its goal to be utilized for a certain purpose as a BaaS (blockchain as a service) project in the cryptocurrency space. 2. Stellar’s developments also provide credence to the idea that there is a specific ‘use case’ for cryptocurrency, in general, and that the business model that they are utilizing is the most effective way of facilitating such. Now let’s have a look at the charts. # Stellar Price Analysis We’re going to start with the XLM/USD pairings, but we’ll also have a look at the XLM/BTC pairing as well in this analysis.  [https://www.tradingview.com/x/AqJa3mQX/](https://www.tradingview.com/x/AqJa3mQX/) So, as we can see in the picture above, there was a point in time where Stellar was trending nicely against that uptrend line that had developed from the beginning of August. However, that line was unable to sustain the constant market dips, and it recently fell off of a cliff (in Stellar world, it did).  [https://www.tradingview.com/x/H4OVXlep/](https://www.tradingview.com/x/H4OVXlep/) Let’s check out the apparent downtrend on the H4 chart below:  [https://www.tradingview.com/x/csD82Ba4/](https://www.tradingview.com/x/csD82Ba4/) As you can see in the picture above, there are a few wicks that attempted to break through this downtrend, but they have been largely unsuccessful thus far. # Relative Strength Index (14)  [https://www.tradingview.com/x/mK0lAJ75/](https://www.tradingview.com/x/mK0lAJ75/) As you can see on the chart above, there is some serious divergence between the RSI(14) for Stellar and the price action on the H4 chart over the couple dozen periods or so. The divergence is actually pretty substantial, all things considered, and definitely something worth paying greater attention to. The Volatility RSI (on the third panel), is still signaling growth on the 4H as well. # Let’s Take a Look at the XLM/BTC Pairing  [https://www.tradingview.com/x/bw39LwSr/](https://www.tradingview.com/x/bw39LwSr/) As you can see above, the BTC chart is a bit different than what we saw on the USD chart on the H4. The two lines drawn in the chart above are used to show the minimum and maximums of the last few weeks of price action for Stellar. It would **_appear_** as though Stellar has hit some sort of bottom point with BTC, although there is no guarantee that this is the case. As has been stated numerous times in past price analysis articles, some coins appear to be more guided by TA done on the BTC charts, others more guided by TA on the USD charts. In the case of Stellar Lumens, it appears that USD dominates the future prediction for Stellar a bit more.  [https://www.tradingview.com/x/5GRJXw86/](https://www.tradingview.com/x/5GRJXw86/) Again, as we can see above, the RSI appears to be on a fairly strong uptrend for Stellar Lumens on the H4. Now, let’s go back to USD and up the chart resolution to the daily. # Daily Chart for XLM/USD Pairing  [https://www.tradingview.com/x/nUJd8L0v/](https://www.tradingview.com/x/nUJd8L0v/) So there are a number of notations that were made on the chart above, but we’ll explain those below (typing them out) for anyone that can’t see. **_On the chart above you can see that:_** 1. There was initially a strong downtrend on the chart that was interrupted by consolidation (bear flag) before a continuing drop in price. 2. Currently it looks as though a bounce COULD be possible, but there’s nothing that’s definitively indicated such on the chart overlay itself. **_For those that need a quick refresher on this course, here’s what a bear flag looks like:_**   Source: [https://www.investopedia.com/terms/f/flag.asp](https://www.investopedia.com/terms/f/flag.asp) It appears that the price is finally at a support on the daily chart as well.  [https://www.tradingview.com/x/4Ra2keSd/](https://www.tradingview.com/x/4Ra2keSd/) The idea that the price has finally hit a support is evidenced by the three translucent boxes that you see on your screen above. # RSI(14) Still Bearish on the Daily Though; Something to Consider  [https://www.tradingview.com/x/lnjxNyoN/](https://www.tradingview.com/x/lnjxNyoN/) This is important to note, because we saw a significant amount of (positive) divergence on the lower TF charts and that’s usually a auto-long position type of signal. However, knowing that the same cannot be said of the daily should give traders pause. Or, at the very least, it should indicate to traders that the divergence on the lower time frames has not been sustained for enough periods on the H4 (and below) to translate to the daily chart. Therefore, if one were to place a long bet on Stellar Lumens at this point in time, it should be done so with caution and prudence, because it has not been entirely immune to the downward thrusts in the market as of late.  [https://www.tradingview.com/x/TxPPgfjh/](https://www.tradingview.com/x/TxPPgfjh/) The Volatility RSI hasn’t even signaled us in yet. # Moving Average Convergence Divergence (MACD)  [https://www.tradingview.com/x/J24FxFys/](https://www.tradingview.com/x/J24FxFys/) The MACD looks a bit ambiguous, perhaps even somewhat ‘shy’ on the daily chart, but the MACD line itself appears to be attempting to make a move upward. We can see on the Histogram in the above chart that the bars are reflecting a rate of decline. # Moving Fib Indicator (Custom)  [https://www.tradingview.com/x/J9ev1KdU/](https://www.tradingview.com/x/J9ev1KdU/) On our moving Fibonacci indicator, we can see the next ‘zone’ ends at 22.6 cents, which would be +10% growth from where it is currently. # Conclusion There is definitely some underlying bullish sentiment in Stellar on the lower time frames. However, it remains to be seen whether that bullish sentiment will continue and be substantive enough for it to break the market’s overall trend. For those that have been following the markets closely over the last few days, it hasn’t been Bitcoin that’s declined in value, but rather altcoins themselves and this has resulted in a greater market dominance for BTC overall (per CMC data). The fact that Stellar has been able to withstand that is already bullish in it of itself. A long bet appears to be a bit of a gamble in this situation, but it seems a lot safer than a short bet (if you have the option of shorting this project). If the author was forced to enter into a position on this coin, then here’s what their R/R would look like:  [https://www.tradingview.com/x/ZalMt5vn/](https://www.tradingview.com/x/ZalMt5vn/) Please note, this is not financial advice in any way, shape or form. Make your own decisions about how you wish to proceed forth with this trade. Good luck! |
| json metadata | {"tags":["bitcoin","crypto","cryptocurrency","priceanalysis","technicalanalysis"],"image":["https://cdn-images-1.medium.com/max/1000/1*AZvjIk56TcYbwumIepxA1A.gif","https://cdn-images-1.medium.com/max/1250/1*UXQan73GKVlsT08qt4FxYA.png","https://cdn-images-1.medium.com/max/1250/1*-SZ2JUEu7vHTHmgCkqjqYw.png","https://cdn-images-1.medium.com/max/1250/1*vBfBUK8aK5GBWuuigrkclQ.png","https://cdn-images-1.medium.com/max/1250/1*kSWnbOd6LLqekLpm8ugPBA.png","https://cdn-images-1.medium.com/max/1250/1*clGI4U1V7MWQV18qwh473g.png","https://cdn-images-1.medium.com/max/1250/1*H3DvvPzzrrn2eJDHpp31Cg.png","https://cdn-images-1.medium.com/max/1250/1*YObQuX9B3GQulrVdclDyAQ.png","https://cdn-images-1.medium.com/max/1000/0*QQtZeVGoOXl_t4YG.png","https://cdn-images-1.medium.com/max/1250/1*kb_MDATOu0rNf9xFmxHmbA.png","https://cdn-images-1.medium.com/max/1250/1*ejkYjlINucBg90L8K1lVJQ.png","https://cdn-images-1.medium.com/max/1250/1*nBlDKZKP3Qejr__MW51gnQ.png","https://cdn-images-1.medium.com/max/1250/1*h-BeruCYA1LsBb5kHkwQmw.png","https://cdn-images-1.medium.com/max/1250/1*ZP9XU53zfyy8XipycgUegQ.png","https://cdn-images-1.medium.com/max/1250/1*P2h8CT7f7lWc9ktAvvGMmg.png","https://cdn-images-1.medium.com/max/1250/1*qhudT5BVs-NnDDnhMmbksg.png"],"links":["https://www.coindesk.com/ibm-debuts-stellar-powered-blockchain-world-wire-payments-system/","https://www.ibm.com/blockchain/solutions/world-wire","https://www.tradingview.com/x/AqJa3mQX/","https://www.tradingview.com/x/H4OVXlep/","https://www.tradingview.com/x/csD82Ba4/","https://www.tradingview.com/x/mK0lAJ75/","https://www.tradingview.com/x/bw39LwSr/","https://www.tradingview.com/x/5GRJXw86/","https://www.tradingview.com/x/nUJd8L0v/","https://www.investopedia.com/terms/f/flag.asp","https://www.tradingview.com/x/4Ra2keSd/","https://www.tradingview.com/x/lnjxNyoN/","https://www.tradingview.com/x/TxPPgfjh/","https://www.tradingview.com/x/J24FxFys/","https://www.tradingview.com/x/J9ev1KdU/","https://www.tradingview.com/x/ZalMt5vn/"],"app":"steemit/0.1","format":"markdown"} |
| Transaction Info | Block #25905597/Trx 3ace334dc42c750f65ec2b153e88b4b0bd854905 |
View Raw JSON Data
{
"trx_id": "3ace334dc42c750f65ec2b153e88b4b0bd854905",
"block": 25905597,
"trx_in_block": 128,
"op_in_trx": 0,
"virtual_op": 0,
"timestamp": "2018-09-12T21:12:54",
"op": [
"comment",
{
"parent_author": "",
"parent_permlink": "bitcoin",
"author": "proofofresearch",
"permlink": "stellar-price-analysis",
"title": "Stellar Price Analysis",
"body": "# Stellar Price Analysis\n\n\n\n# Foreword/Introduction\n\nThis is an analysis that felt near-mandatory given the amount of fairly bullish news that has come across the wires for Stellar in the last couple of weeks.\n\nAs we’ve mentioned in some of our former price analyses, the partnership between IBM and Stellar has been the gift that keeps on giving in terms of the updates and developments that have been churned out from the pairing.\n\nMost recently, Stellar investors were rewarded with the news that [IBM is launching a ‘Blockchain World Wire’ payment system](https://www.coindesk.com/ibm-debuts-stellar-powered-blockchain-world-wire-payments-system/). In fact, that prior statement should not be put in the past tense, because the [system is actually live as we speak.](https://www.ibm.com/blockchain/solutions/world-wire)\n\nIt probably goes without saying, but this news is astronomical in terms of Stellar’s future potential (per usual). This is following the news that came out a little over a month ago informing investors and the general public alike that IBM would be building a stable coin atop of the protocol as well.\n\n**_The reason why this news is bullish is because:_**\n\n1. It seriously validates Stellar as a blockchain protocol. It shows that Stellar has clearly met its goal to be utilized for a certain purpose as a BaaS (blockchain as a service) project in the cryptocurrency space.\n2. Stellar’s developments also provide credence to the idea that there is a specific ‘use case’ for cryptocurrency, in general, and that the business model that they are utilizing is the most effective way of facilitating such.\n\nNow let’s have a look at the charts.\n\n# Stellar Price Analysis\n\nWe’re going to start with the XLM/USD pairings, but we’ll also have a look at the XLM/BTC pairing as well in this analysis.\n\n\n\n[https://www.tradingview.com/x/AqJa3mQX/](https://www.tradingview.com/x/AqJa3mQX/)\n\nSo, as we can see in the picture above, there was a point in time where Stellar was trending nicely against that uptrend line that had developed from the beginning of August.\n\nHowever, that line was unable to sustain the constant market dips, and it recently fell off of a cliff (in Stellar world, it did).\n\n\n\n[https://www.tradingview.com/x/H4OVXlep/](https://www.tradingview.com/x/H4OVXlep/)\n\nLet’s check out the apparent downtrend on the H4 chart below:\n\n\n\n[https://www.tradingview.com/x/csD82Ba4/](https://www.tradingview.com/x/csD82Ba4/)\n\nAs you can see in the picture above, there are a few wicks that attempted to break through this downtrend, but they have been largely unsuccessful thus far.\n\n# Relative Strength Index (14)\n\n\n\n[https://www.tradingview.com/x/mK0lAJ75/](https://www.tradingview.com/x/mK0lAJ75/)\n\nAs you can see on the chart above, there is some serious divergence between the RSI(14) for Stellar and the price action on the H4 chart over the couple dozen periods or so.\n\nThe divergence is actually pretty substantial, all things considered, and definitely something worth paying greater attention to.\n\nThe Volatility RSI (on the third panel), is still signaling growth on the 4H as well.\n\n# Let’s Take a Look at the XLM/BTC Pairing\n\n\n\n[https://www.tradingview.com/x/bw39LwSr/](https://www.tradingview.com/x/bw39LwSr/)\n\nAs you can see above, the BTC chart is a bit different than what we saw on the USD chart on the H4.\n\nThe two lines drawn in the chart above are used to show the minimum and maximums of the last few weeks of price action for Stellar.\n\nIt would **_appear_** as though Stellar has hit some sort of bottom point with BTC, although there is no guarantee that this is the case.\n\nAs has been stated numerous times in past price analysis articles, some coins appear to be more guided by TA done on the BTC charts, others more guided by TA on the USD charts. In the case of Stellar Lumens, it appears that USD dominates the future prediction for Stellar a bit more.\n\n\n\n[https://www.tradingview.com/x/5GRJXw86/](https://www.tradingview.com/x/5GRJXw86/)\n\nAgain, as we can see above, the RSI appears to be on a fairly strong uptrend for Stellar Lumens on the H4.\n\nNow, let’s go back to USD and up the chart resolution to the daily.\n\n# Daily Chart for XLM/USD Pairing\n\n\n\n[https://www.tradingview.com/x/nUJd8L0v/](https://www.tradingview.com/x/nUJd8L0v/)\n\nSo there are a number of notations that were made on the chart above, but we’ll explain those below (typing them out) for anyone that can’t see.\n\n**_On the chart above you can see that:_**\n\n1. There was initially a strong downtrend on the chart that was interrupted by consolidation (bear flag) before a continuing drop in price.\n2. Currently it looks as though a bounce COULD be possible, but there’s nothing that’s definitively indicated such on the chart overlay itself.\n\n**_For those that need a quick refresher on this course, here’s what a bear flag looks like:_**\n\n\n\n\n\nSource: [https://www.investopedia.com/terms/f/flag.asp](https://www.investopedia.com/terms/f/flag.asp)\n\nIt appears that the price is finally at a support on the daily chart as well.\n\n\n\n[https://www.tradingview.com/x/4Ra2keSd/](https://www.tradingview.com/x/4Ra2keSd/)\n\nThe idea that the price has finally hit a support is evidenced by the three translucent boxes that you see on your screen above.\n\n# RSI(14) Still Bearish on the Daily Though; Something to Consider\n\n\n\n[https://www.tradingview.com/x/lnjxNyoN/](https://www.tradingview.com/x/lnjxNyoN/)\n\nThis is important to note, because we saw a significant amount of (positive) divergence on the lower TF charts and that’s usually a auto-long position type of signal.\n\nHowever, knowing that the same cannot be said of the daily should give traders pause. Or, at the very least, it should indicate to traders that the divergence on the lower time frames has not been sustained for enough periods on the H4 (and below) to translate to the daily chart.\n\nTherefore, if one were to place a long bet on Stellar Lumens at this point in time, it should be done so with caution and prudence, because it has not been entirely immune to the downward thrusts in the market as of late.\n\n\n\n[https://www.tradingview.com/x/TxPPgfjh/](https://www.tradingview.com/x/TxPPgfjh/)\n\nThe Volatility RSI hasn’t even signaled us in yet.\n\n# Moving Average Convergence Divergence (MACD)\n\n\n\n[https://www.tradingview.com/x/J24FxFys/](https://www.tradingview.com/x/J24FxFys/)\n\nThe MACD looks a bit ambiguous, perhaps even somewhat ‘shy’ on the daily chart, but the MACD line itself appears to be attempting to make a move upward.\n\nWe can see on the Histogram in the above chart that the bars are reflecting a rate of decline.\n\n# Moving Fib Indicator (Custom)\n\n\n\n[https://www.tradingview.com/x/J9ev1KdU/](https://www.tradingview.com/x/J9ev1KdU/)\n\nOn our moving Fibonacci indicator, we can see the next ‘zone’ ends at 22.6 cents, which would be +10% growth from where it is currently.\n\n# Conclusion\n\nThere is definitely some underlying bullish sentiment in Stellar on the lower time frames.\n\nHowever, it remains to be seen whether that bullish sentiment will continue and be substantive enough for it to break the market’s overall trend.\n\nFor those that have been following the markets closely over the last few days, it hasn’t been Bitcoin that’s declined in value, but rather altcoins themselves and this has resulted in a greater market dominance for BTC overall (per CMC data).\n\nThe fact that Stellar has been able to withstand that is already bullish in it of itself.\n\nA long bet appears to be a bit of a gamble in this situation, but it seems a lot safer than a short bet (if you have the option of shorting this project). If the author was forced to enter into a position on this coin, then here’s what their R/R would look like:\n\n\n\n[https://www.tradingview.com/x/ZalMt5vn/](https://www.tradingview.com/x/ZalMt5vn/)\n\nPlease note, this is not financial advice in any way, shape or form. Make your own decisions about how you wish to proceed forth with this trade.\n\nGood luck!",
"json_metadata": "{\"tags\":[\"bitcoin\",\"crypto\",\"cryptocurrency\",\"priceanalysis\",\"technicalanalysis\"],\"image\":[\"https://cdn-images-1.medium.com/max/1000/1*AZvjIk56TcYbwumIepxA1A.gif\",\"https://cdn-images-1.medium.com/max/1250/1*UXQan73GKVlsT08qt4FxYA.png\",\"https://cdn-images-1.medium.com/max/1250/1*-SZ2JUEu7vHTHmgCkqjqYw.png\",\"https://cdn-images-1.medium.com/max/1250/1*vBfBUK8aK5GBWuuigrkclQ.png\",\"https://cdn-images-1.medium.com/max/1250/1*kSWnbOd6LLqekLpm8ugPBA.png\",\"https://cdn-images-1.medium.com/max/1250/1*clGI4U1V7MWQV18qwh473g.png\",\"https://cdn-images-1.medium.com/max/1250/1*H3DvvPzzrrn2eJDHpp31Cg.png\",\"https://cdn-images-1.medium.com/max/1250/1*YObQuX9B3GQulrVdclDyAQ.png\",\"https://cdn-images-1.medium.com/max/1000/0*QQtZeVGoOXl_t4YG.png\",\"https://cdn-images-1.medium.com/max/1250/1*kb_MDATOu0rNf9xFmxHmbA.png\",\"https://cdn-images-1.medium.com/max/1250/1*ejkYjlINucBg90L8K1lVJQ.png\",\"https://cdn-images-1.medium.com/max/1250/1*nBlDKZKP3Qejr__MW51gnQ.png\",\"https://cdn-images-1.medium.com/max/1250/1*h-BeruCYA1LsBb5kHkwQmw.png\",\"https://cdn-images-1.medium.com/max/1250/1*ZP9XU53zfyy8XipycgUegQ.png\",\"https://cdn-images-1.medium.com/max/1250/1*P2h8CT7f7lWc9ktAvvGMmg.png\",\"https://cdn-images-1.medium.com/max/1250/1*qhudT5BVs-NnDDnhMmbksg.png\"],\"links\":[\"https://www.coindesk.com/ibm-debuts-stellar-powered-blockchain-world-wire-payments-system/\",\"https://www.ibm.com/blockchain/solutions/world-wire\",\"https://www.tradingview.com/x/AqJa3mQX/\",\"https://www.tradingview.com/x/H4OVXlep/\",\"https://www.tradingview.com/x/csD82Ba4/\",\"https://www.tradingview.com/x/mK0lAJ75/\",\"https://www.tradingview.com/x/bw39LwSr/\",\"https://www.tradingview.com/x/5GRJXw86/\",\"https://www.tradingview.com/x/nUJd8L0v/\",\"https://www.investopedia.com/terms/f/flag.asp\",\"https://www.tradingview.com/x/4Ra2keSd/\",\"https://www.tradingview.com/x/lnjxNyoN/\",\"https://www.tradingview.com/x/TxPPgfjh/\",\"https://www.tradingview.com/x/J24FxFys/\",\"https://www.tradingview.com/x/J9ev1KdU/\",\"https://www.tradingview.com/x/ZalMt5vn/\"],\"app\":\"steemit/0.1\",\"format\":\"markdown\"}"
}
]
}lethaltouchupvoted (100.00%) @proofofresearch / ethereum-price-outlook2018/09/12 15:59:36
lethaltouchupvoted (100.00%) @proofofresearch / ethereum-price-outlook
2018/09/12 15:59:36
| voter | lethaltouch |
| author | proofofresearch |
| permlink | ethereum-price-outlook |
| weight | 10000 (100.00%) |
| Transaction Info | Block #25899333/Trx fd69bdfb3f37ab00e02744a6b6d8077a7f0a6610 |
View Raw JSON Data
{
  "trx_id": "fd69bdfb3f37ab00e02744a6b6d8077a7f0a6610",
  "block": 25899333,
  "trx_in_block": 26,
  "op_in_trx": 0,
  "virtual_op": 0,
  "timestamp": "2018-09-12T15:59:36",
  "op": [
    "vote",
    {
      "voter": "lethaltouch",
      "author": "proofofresearch",
      "permlink": "ethereum-price-outlook",
      "weight": 10000
    }
  ]
}proofofresearchpublished a new post: monero-price-analysis-bounce-possible2018/09/12 02:05:21
proofofresearchpublished a new post: monero-price-analysis-bounce-possible
2018/09/12 02:05:21
| parent author | |
| parent permlink | bitcoin |
| author | proofofresearch |
| permlink | monero-price-analysis-bounce-possible |
| title | Monero Price Analysis: Bounce Possible |
| body | @@ -8450,8 +8450,453 @@ trading! +%0A%0A## All Links to the Monero Price Analysis %0A%0AWebsite: https://zerononcense.com/2018/09/12/monero-price-analysis-9-11-18/%0A%0AMedium: https://medium.com/@proofofresearch/monero-price-analysis-bounce-possible-unfinished-draft-29c8900bae96 %0A%0ASteemit: https://steemit.com/bitcoin/@proofofresearch/monero-price-analysis-bounce-possible %0A%0ATradingView Idea: https://www.tradingview.com/chart/XMRUSD/xeuy8OUz-Monero-Price-Analysis-Feast-or-Famine-Version/ |
| json metadata | {"tags":["bitcoin","crypto","cryptocurrency","monero","technicalanalysis"],"image":["https://cdn-images-1.medium.com/max/1000/1*pUbEG8noGE9gT3sv13nKEw.png","https://cdn-images-1.medium.com/max/1250/1*Z4COn2FxEiXJjiKjeHiAyQ.png","https://cdn-images-1.medium.com/max/1250/1*UV413r4iKM7iUBWq_zu4fA.png","https://cdn-images-1.medium.com/max/1250/1*VgnJbGvXs-Pqh6lEIXAq9Q.png","https://cdn-images-1.medium.com/max/1250/1*eUvLoBa1HMlfvCM51GaeSQ.png","https://cdn-images-1.medium.com/max/1250/1*YpXWhMqmquk3-KSPeNlo7w.png","https://cdn-images-1.medium.com/max/1250/1*POrn2R7Cae2PVvZcRwHkgQ.png","https://cdn-images-1.medium.com/max/1250/1*LB01gR6wnbS47rSAUUrW8Q.png","https://cdn-images-1.medium.com/max/1250/1*TMTyt9U41-023fVwnkkr6g.png","https://cdn-images-1.medium.com/max/1250/1*IIqsbQT0CldCMOd9EkDfyA.png","https://cdn-images-1.medium.com/max/1250/1*UBQWjdDY2M6Vbhbv0thSgA.png","https://cdn-images-1.medium.com/max/1250/1*Mf6g4dEy1OFEKWXlmlpfxg.png","https://cdn-images-1.medium.com/max/1250/1*Cld5noPmzIYf1F6n1O5vwA.png"],"links":["https://zerononcense.com","http://t.me/MerkleTrader","https://discord.gg/AYW5zDw","https://steemit.com/@proofofresearch","http://reddit.com/u/randomshortdude","https://twitter.com/ProofofResearch","https://ethereumworldnews.com/bitcoin-monero-price-prediction-2018/","https://www.tradingview.com/x/XIu5PVi5/","https://www.tradingview.com/x/Qt5VrcFT/","https://www.tradingview.com/x/MzxnNC98/","https://www.tradingview.com/x/JdDdqJxG/","https://www.investopedia.com/terms/l/laggingindicator.asp","https://www.tradingview.com/x/0tGiJ1Nv/","https://www.tradingview.com/x/lzEQtbnd/","https://www.tradingview.com/x/tmcnFyDr/","https://www.tradingview.com/x/IE8SP77N/","https://www.tradingview.com/x/zhfrKxUX/","https://www.tradingview.com/x/Te4R780j/","https://www.tradingview.com/x/GjZV6LHP/","https://zerononcense.com/2018/09/12/monero-price-analysis-9-11-18/","https://medium.com/@proofofresearch/monero-price-analysis-bounce-possible-unfinished-draft-29c8900bae96","https://steemit.com/bitcoin/@proofofresearch/monero-price-analysis-bounce-possible","https://www.tradingview.com/chart/XMRUSD/xeuy8OUz-Monero-Price-Analysis-Feast-or-Famine-Version/"],"app":"steemit/0.1","format":"markdown"} |
| Transaction Info | Block #25882653/Trx c9d473a7b6024d7393d62116994b8d0a2d4c3dad |
View Raw JSON Data
{
  "trx_id": "c9d473a7b6024d7393d62116994b8d0a2d4c3dad",
  "block": 25882653,
  "trx_in_block": 12,
  "op_in_trx": 0,
  "virtual_op": 0,
  "timestamp": "2018-09-12T02:05:21",
  "op": [
    "comment",
    {
      "parent_author": "",
      "parent_permlink": "bitcoin",
      "author": "proofofresearch",
      "permlink": "monero-price-analysis-bounce-possible",
      "title": "Monero Price Analysis: Bounce Possible",
      "body": "@@ -8450,8 +8450,453 @@\n trading!\n+%0A%0A## All Links to the Monero Price Analysis %0A%0AWebsite: https://zerononcense.com/2018/09/12/monero-price-analysis-9-11-18/%0A%0AMedium: https://medium.com/@proofofresearch/monero-price-analysis-bounce-possible-unfinished-draft-29c8900bae96 %0A%0ASteemit: https://steemit.com/bitcoin/@proofofresearch/monero-price-analysis-bounce-possible %0A%0ATradingView Idea: https://www.tradingview.com/chart/XMRUSD/xeuy8OUz-Monero-Price-Analysis-Feast-or-Famine-Version/\n",
      "json_metadata": "{\"tags\":[\"bitcoin\",\"crypto\",\"cryptocurrency\",\"monero\",\"technicalanalysis\"],\"image\":[\"https://cdn-images-1.medium.com/max/1000/1*pUbEG8noGE9gT3sv13nKEw.png\",\"https://cdn-images-1.medium.com/max/1250/1*Z4COn2FxEiXJjiKjeHiAyQ.png\",\"https://cdn-images-1.medium.com/max/1250/1*UV413r4iKM7iUBWq_zu4fA.png\",\"https://cdn-images-1.medium.com/max/1250/1*VgnJbGvXs-Pqh6lEIXAq9Q.png\",\"https://cdn-images-1.medium.com/max/1250/1*eUvLoBa1HMlfvCM51GaeSQ.png\",\"https://cdn-images-1.medium.com/max/1250/1*YpXWhMqmquk3-KSPeNlo7w.png\",\"https://cdn-images-1.medium.com/max/1250/1*POrn2R7Cae2PVvZcRwHkgQ.png\",\"https://cdn-images-1.medium.com/max/1250/1*LB01gR6wnbS47rSAUUrW8Q.png\",\"https://cdn-images-1.medium.com/max/1250/1*TMTyt9U41-023fVwnkkr6g.png\",\"https://cdn-images-1.medium.com/max/1250/1*IIqsbQT0CldCMOd9EkDfyA.png\",\"https://cdn-images-1.medium.com/max/1250/1*UBQWjdDY2M6Vbhbv0thSgA.png\",\"https://cdn-images-1.medium.com/max/1250/1*Mf6g4dEy1OFEKWXlmlpfxg.png\",\"https://cdn-images-1.medium.com/max/1250/1*Cld5noPmzIYf1F6n1O5vwA.png\"],\"links\":[\"https://zerononcense.com\",\"http://t.me/MerkleTrader\",\"https://discord.gg/AYW5zDw\",\"https://steemit.com/@proofofresearch\",\"http://reddit.com/u/randomshortdude\",\"https://twitter.com/ProofofResearch\",\"https://ethereumworldnews.com/bitcoin-monero-price-prediction-2018/\",\"https://www.tradingview.com/x/XIu5PVi5/\",\"https://www.tradingview.com/x/Qt5VrcFT/\",\"https://www.tradingview.com/x/MzxnNC98/\",\"https://www.tradingview.com/x/JdDdqJxG/\",\"https://www.investopedia.com/terms/l/laggingindicator.asp\",\"https://www.tradingview.com/x/0tGiJ1Nv/\",\"https://www.tradingview.com/x/lzEQtbnd/\",\"https://www.tradingview.com/x/tmcnFyDr/\",\"https://www.tradingview.com/x/IE8SP77N/\",\"https://www.tradingview.com/x/zhfrKxUX/\",\"https://www.tradingview.com/x/Te4R780j/\",\"https://www.tradingview.com/x/GjZV6LHP/\",\"https://zerononcense.com/2018/09/12/monero-price-analysis-9-11-18/\",\"https://medium.com/@proofofresearch/monero-price-analysis-bounce-possible-unfinished-draft-29c8900bae96\",\"https://steemit.com/bitcoin/@proofofresearch/monero-price-analysis-bounce-possible\",\"https://www.tradingview.com/chart/XMRUSD/xeuy8OUz-Monero-Price-Analysis-Feast-or-Famine-Version/\"],\"app\":\"steemit/0.1\",\"format\":\"markdown\"}"
    }
  ]
}proofofresearchpublished a new post: monero-price-analysis-bounce-possible2018/09/12 01:33:45
proofofresearchpublished a new post: monero-price-analysis-bounce-possible
2018/09/12 01:33:45
| parent author | |
| parent permlink | bitcoin |
| author | proofofresearch |
| permlink | monero-price-analysis-bounce-possible |
| title | Monero Price Analysis: Bounce Possible |
| body | # Monero Price Analysis: Bounce Possible  > Disclaimer: This article is not financial advice. The author is not a financial advisor and this article was not paid for. > For more information like this, join/follow our [Website](https://zerononcense.com), [Telegram](http://t.me/MerkleTrader), [Discord](https://discord.gg/AYW5zDw), [Steemit](https://steemit.com/@proofofresearch), [Reddit](http://reddit.com/u/randomshortdude), and [Twitter](https://twitter.com/ProofofResearch)! For those that have been following Monero, you’ve probably noticed the extraordinarily bullish sentiment that has taken hold of the protocl in recent weeks. There are a few reasons for that: 1. On a technical trading level, Monero was looking delectable. Period. 2. [There was a report that came out](https://ethereumworldnews.com/bitcoin-monero-price-prediction-2018/) that valued Monero somewhere in the upper reaches around $40k at some point in the near future (which is a few hundred/thousand percent above where it is currently). 3. Monero is a solid project in general and things that are fundamentally solid in any market, with awareness and marketing behind it are never going to die — even when we’re in a bear market. Now that we got those facts out of the way, let’s get to the actual price analysis itself. # Monero Price Analysis (Daily TF) 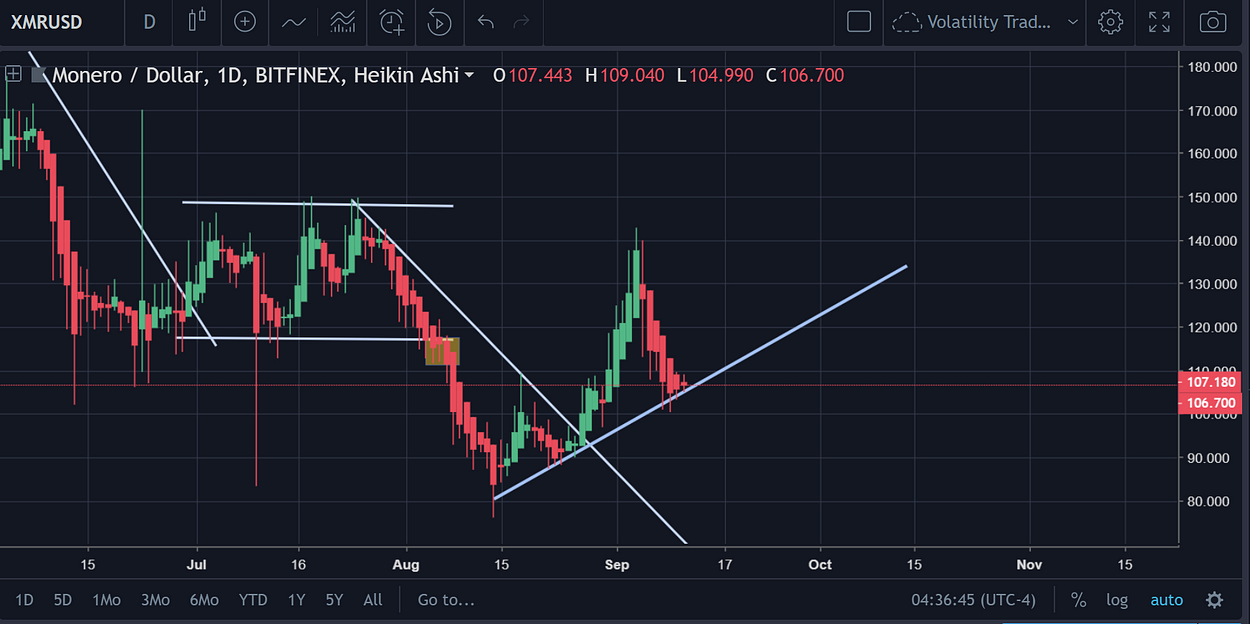 [https://www.tradingview.com/x/XIu5PVi5/](https://www.tradingview.com/x/XIu5PVi5/) From the chart, we can see a break above the baby-symmetric triangle (which resulted in a reversal), into a couple of bounces that eventually let the price start jumping out of the gym before touching back down to earth (where it is now). If the mini-uptrend on the daily chart holds, then one should expect that the price will be increasing for Monero at any point now. **_Below, is another illustration of the chart to help traders get a better visual of what’s going on:_**  [https://www.tradingview.com/x/Qt5VrcFT/](https://www.tradingview.com/x/Qt5VrcFT/) 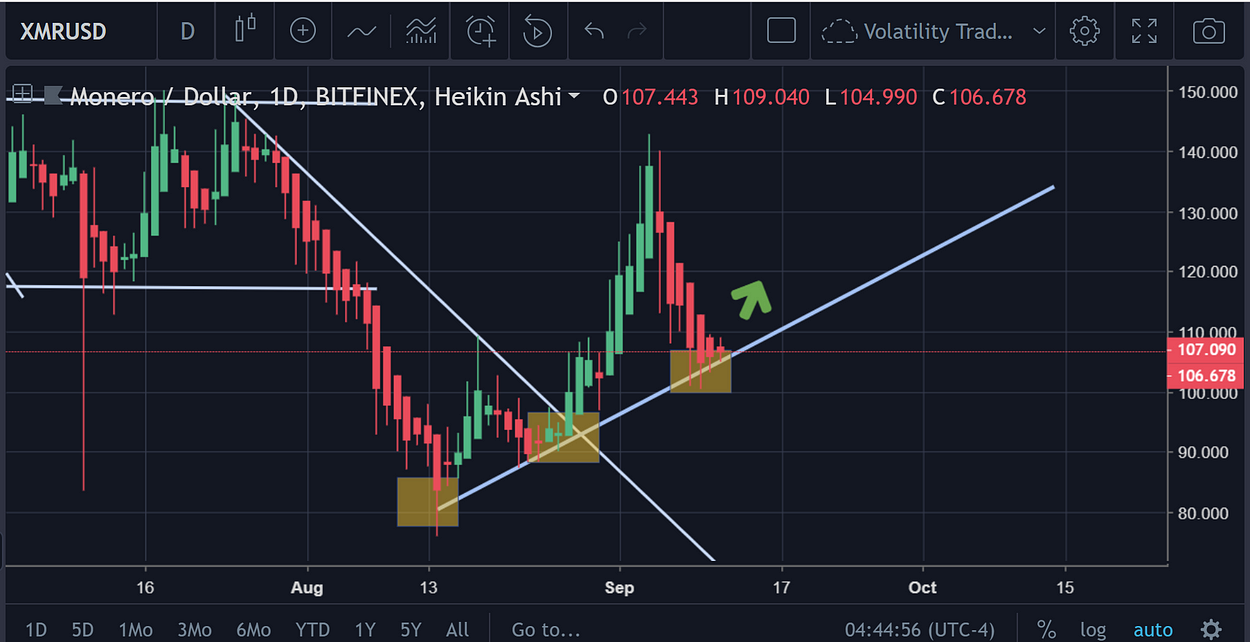 [https://www.tradingview.com/x/MzxnNC98/](https://www.tradingview.com/x/MzxnNC98/) If the uptrend were to hold here, then the green arrow should symbolize where the price action will head to in the future. But we can not just take this at face value! This is crypto, and the price could just as easily break back down below the uptrend line. There are a slew of **_negative price signals on the daily_** # EMA ( Exponential Moving Averages )  [https://www.tradingview.com/x/JdDdqJxG/](https://www.tradingview.com/x/JdDdqJxG/) **_Burnt Orange_** = EMA-26 **_Lime Yellow_** = EMA-12 Looks like the **_EMA-12_** may be headed down below the **_EMA-26_**, which would be bearish and the price has already crossed below both EMA indicators, which is bearish in itself. So, this is something to watch for. However, it must be noted that the exponential moving averages are [**_lagging indicators_**.](https://www.investopedia.com/terms/l/laggingindicator.asp) 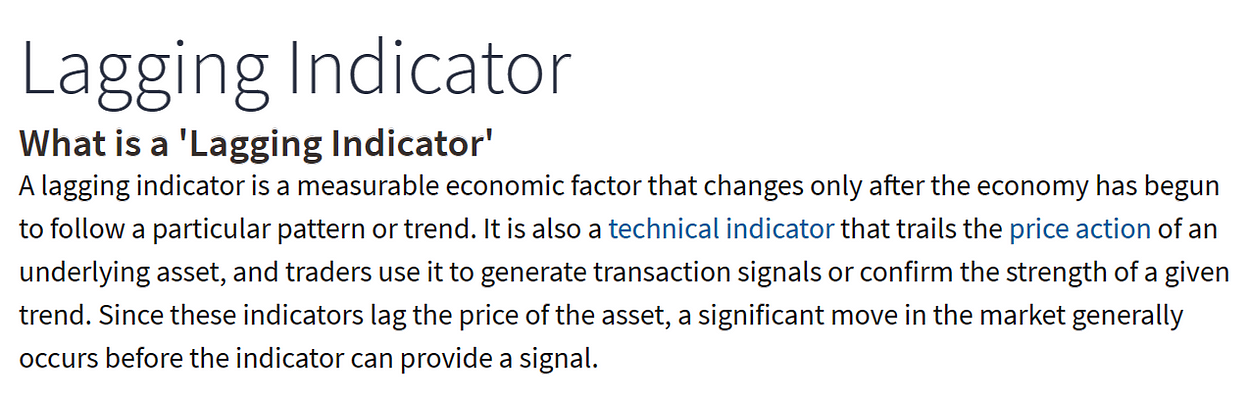 Source: [https://www.investopedia.com/terms/l/laggingindicator.asp](https://www.investopedia.com/terms/l/laggingindicator.asp) # MACD (Moving Average Convergence Divergence) Indicator 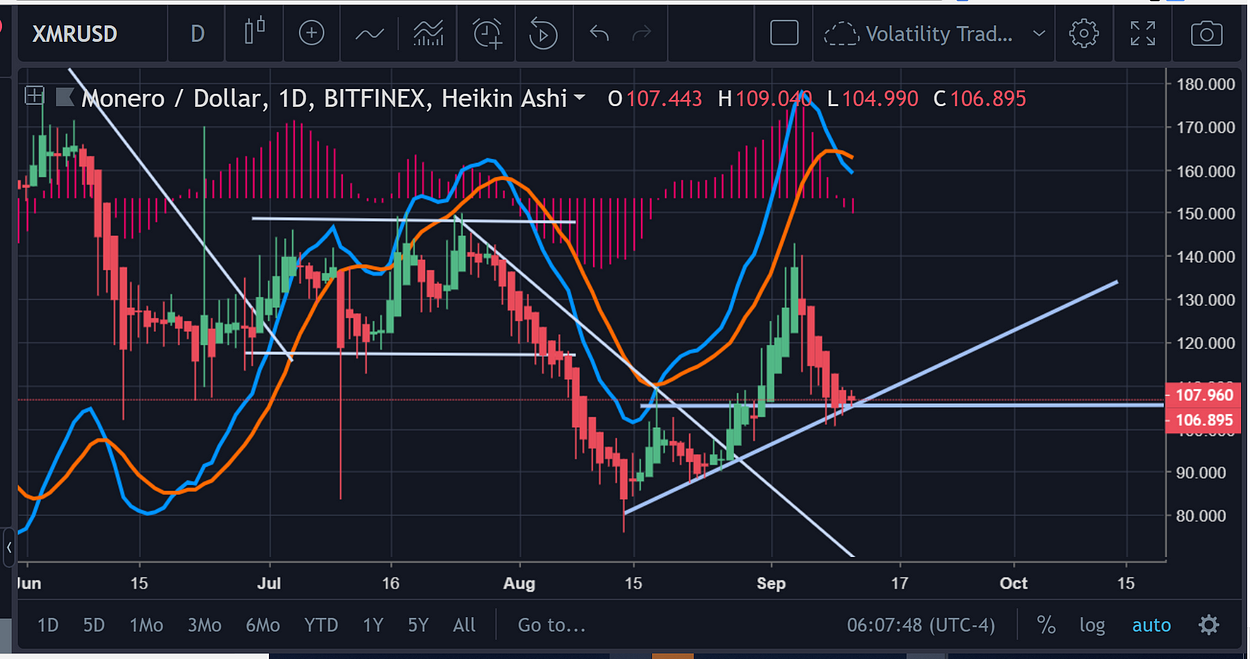 [https://www.tradingview.com/x/0tGiJ1Nv/](https://www.tradingview.com/x/0tGiJ1Nv/) This is the MACD overlaid on the main chart. Its a bit messy, but you should still be able to clearly see the bearish cross of the MACD as well as the negative Histogram just getting started and the current bar is bigger than the last, and it also looks like the bars have just started on the negative side too — so, it looks like there’s no waning on that situation coming anytime soon. # Bollinger’s Bands 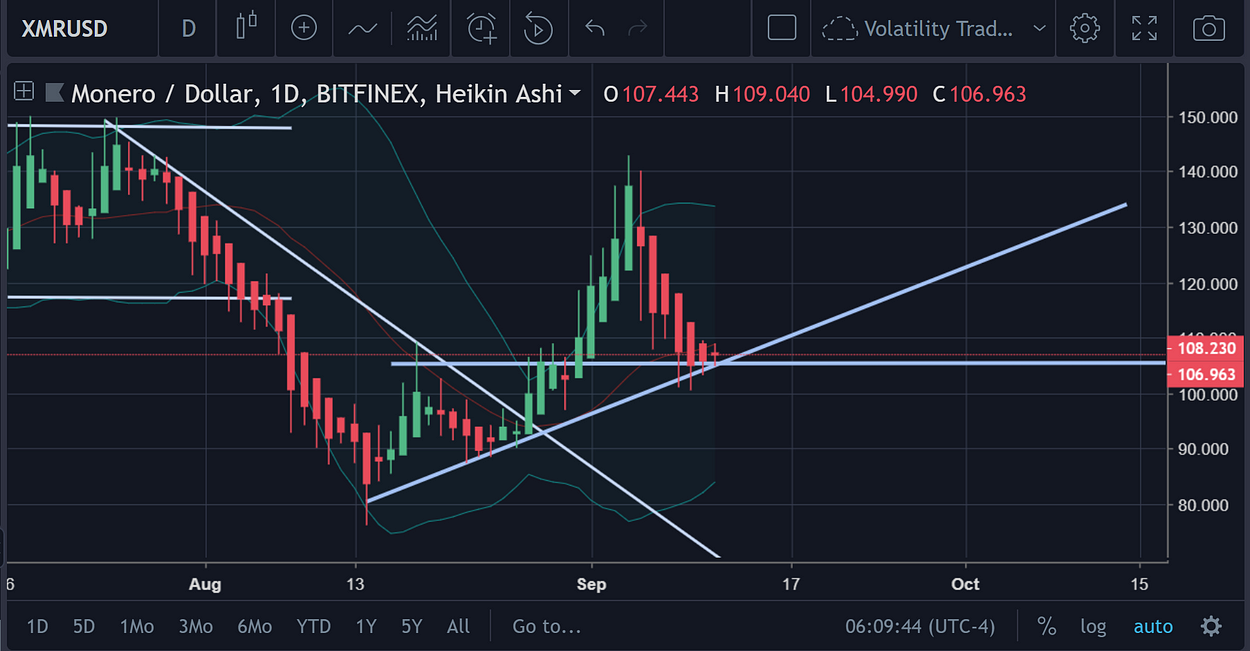 [https://www.tradingview.com/x/lzEQtbnd/](https://www.tradingview.com/x/lzEQtbnd/) Price isn’t even at the bottom of the Bollinger’s Bands on the daily. No bounce in sight. **_(Continued on September 11th, 2018)_** # Let’s Go to the 2 Hour 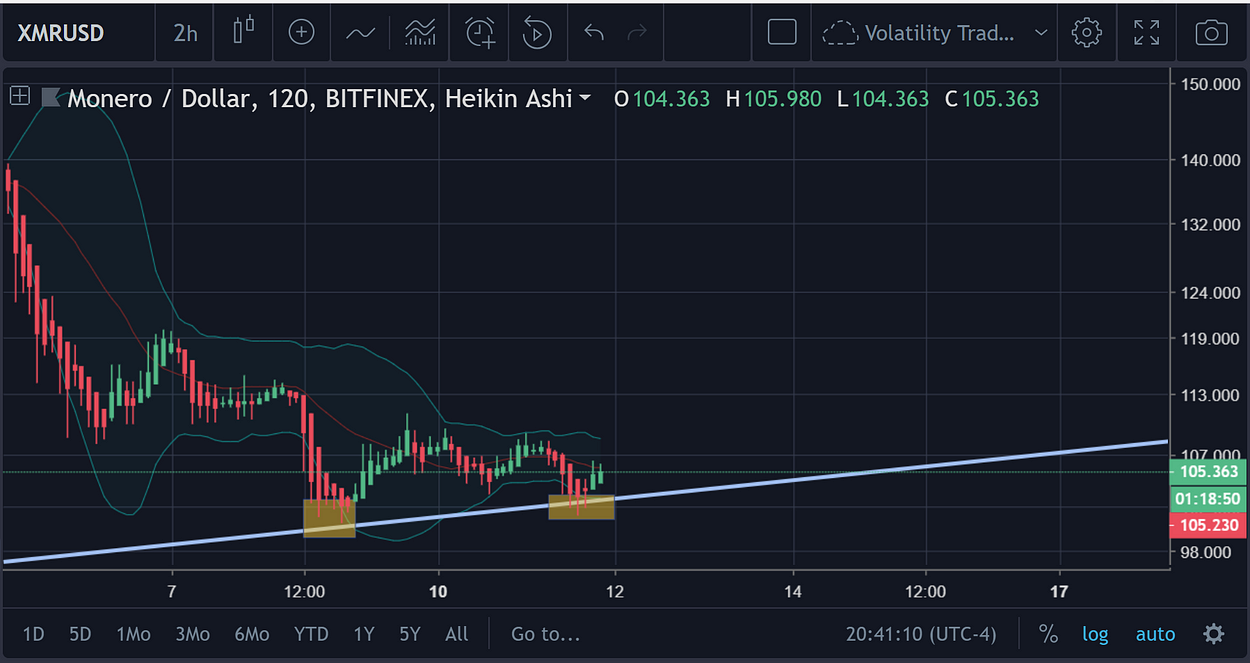 [https://www.tradingview.com/x/tmcnFyDr/](https://www.tradingview.com/x/tmcnFyDr/) As you can see in the photo above, the uptrend appears to be holding fairly and we can see a slight bounce off of the trendline at the end. The yellow squares that you see are indicative of the touches on the trendline (please note that this does not need to be an “exact” touch, just within the general realm/region). # RSI(14) on the 2H 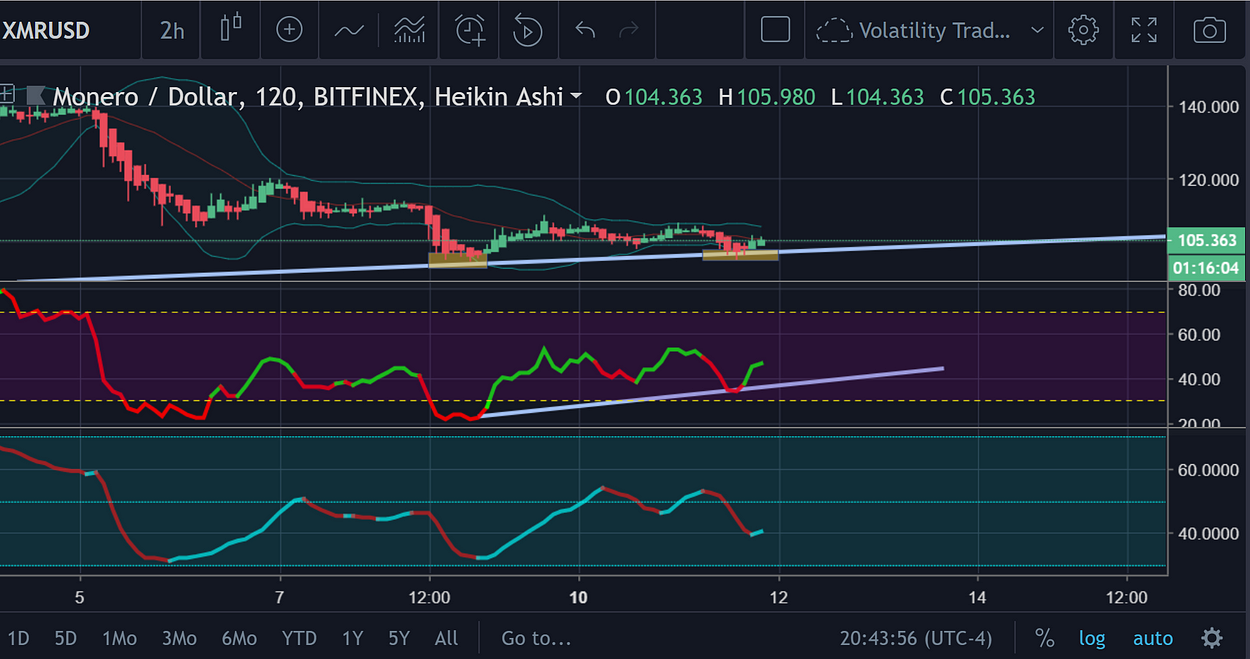 [https://www.tradingview.com/x/IE8SP77N/](https://www.tradingview.com/x/IE8SP77N/) Truthfully, the RSI is a bit iffy here, but it does appear to be on its way up. XMR’s fate will probably be decided, in large part, by the performance of the crypto market in general. If the crypto market s**** the bed at some point in time, then yeah, it’s most likely that the price of Monero is going to plummet with it. While it has been defying the market trend over the past month, it has not been entirely immune to downward moves. For the most part, Monero has been on the move while Bitcoin/crypto markets are moving sideways/going up. But when the market is headed downward, it has generally been consolidating as well (we can even observe this phenomenon on the charts now). However, the fact that the uptrend line has held so solidly is fairly indicative of the fact that it is proving to be a **_reliable point of support for the price_**. But, a break below this could lead to the same disastrous drop in price that we had seen before. 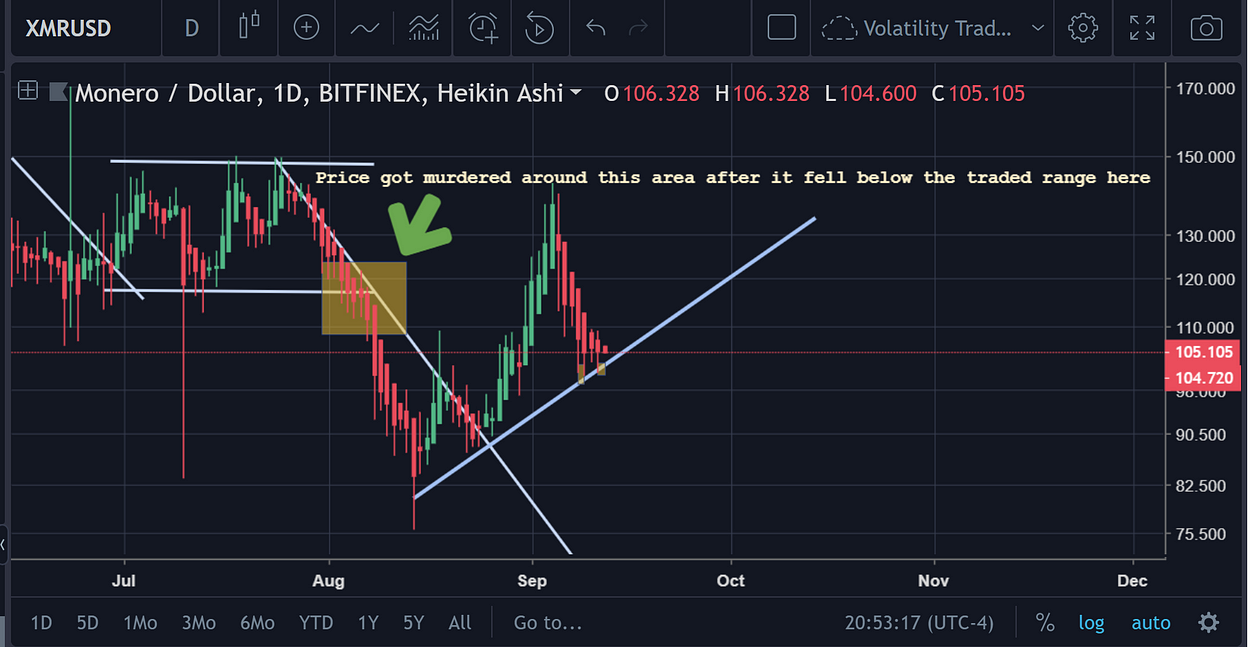 [https://www.tradingview.com/x/zhfrKxUX/](https://www.tradingview.com/x/zhfrKxUX/) 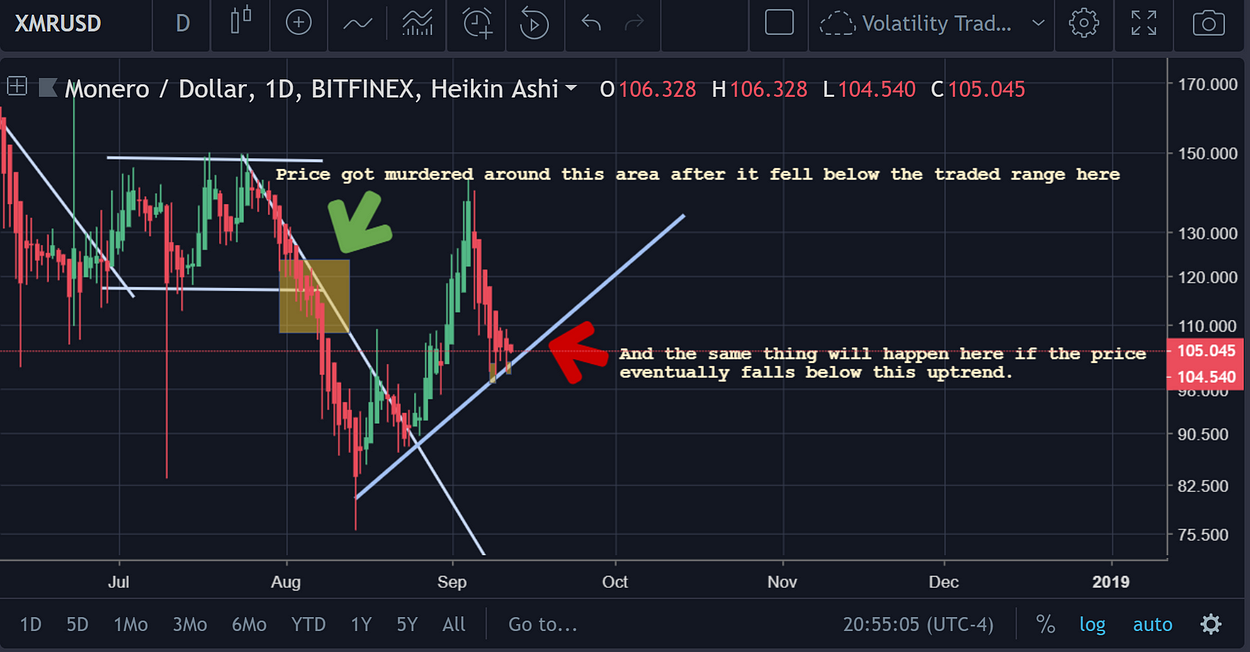 [https://www.tradingview.com/x/Te4R780j/](https://www.tradingview.com/x/Te4R780j/) The two pictures above show the inherent risk to traders if they are “wrong” about their long decision. # Conclusion (Strategy Advocacy; Not Financial Advice) If it were left up to the author’s hands, and they were resolute on making some sort of play on Monero, then the best play would probably be to **_wait._** The author is unsure about the liquidity of shorts on Bitfinex’s platform, but if the price does break down below the uptrend line that it is on, then Monero would be an excellent short. That’s something that most readers have probably gathered at this point. A price where this breakage below the uptrend would probably be most ‘apparent’, would be at $100. Or, one could wait until there is another massive decrease in the markets, and make sure to short a coin like Monero, because it is more than likely that it will finally depreciate like the rest of the market once it has finally broken its uptrend. Conversely, if this does not happen, then a tentative long position should be placed at the **_next resistance point that gets broken_**. 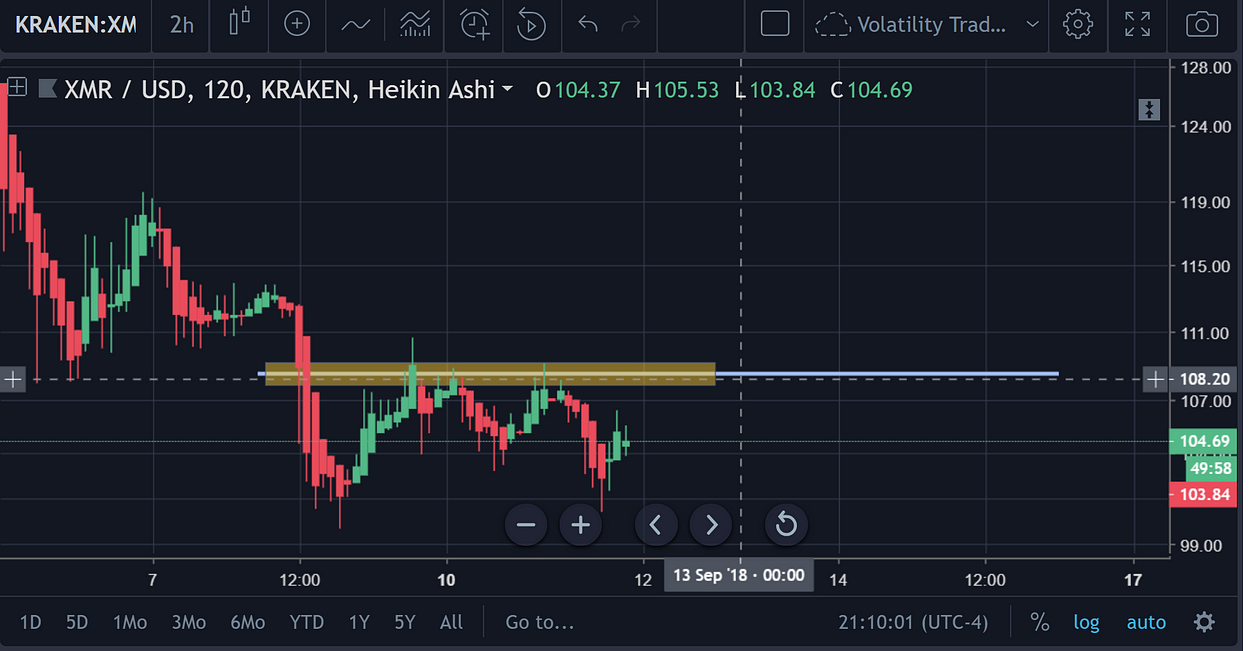 [https://www.tradingview.com/x/GjZV6LHP/](https://www.tradingview.com/x/GjZV6LHP/) It’s fair to assume that the next notable resistance point for Monero is hovering in the $108-$110 range. This resistance point was determined by looking at the top of the range that Monero is trading in. Thus, if the price breaks above the point where Monero is at currently, it would be most prudent to place a long position there and then place a S/L just below the resistance point. Placing a long where the price is at **_currently_** could be really risky, even if you have a solid S/L on the market because a **_dramatic reduction in price could lead_** to your S/L not being fulfilled at all. And such an event is much more likely to happen in the wake of a major sell off or decrease in price (which tends to happen when price breaks below a trendline). In either case, be safe trading! |
| json metadata | {"tags":["bitcoin","crypto","cryptocurrency","monero","technicalanalysis"],"image":["https://cdn-images-1.medium.com/max/1000/1*pUbEG8noGE9gT3sv13nKEw.png","https://cdn-images-1.medium.com/max/1250/1*Z4COn2FxEiXJjiKjeHiAyQ.png","https://cdn-images-1.medium.com/max/1250/1*UV413r4iKM7iUBWq_zu4fA.png","https://cdn-images-1.medium.com/max/1250/1*VgnJbGvXs-Pqh6lEIXAq9Q.png","https://cdn-images-1.medium.com/max/1250/1*eUvLoBa1HMlfvCM51GaeSQ.png","https://cdn-images-1.medium.com/max/1250/1*YpXWhMqmquk3-KSPeNlo7w.png","https://cdn-images-1.medium.com/max/1250/1*POrn2R7Cae2PVvZcRwHkgQ.png","https://cdn-images-1.medium.com/max/1250/1*LB01gR6wnbS47rSAUUrW8Q.png","https://cdn-images-1.medium.com/max/1250/1*TMTyt9U41-023fVwnkkr6g.png","https://cdn-images-1.medium.com/max/1250/1*IIqsbQT0CldCMOd9EkDfyA.png","https://cdn-images-1.medium.com/max/1250/1*UBQWjdDY2M6Vbhbv0thSgA.png","https://cdn-images-1.medium.com/max/1250/1*Mf6g4dEy1OFEKWXlmlpfxg.png","https://cdn-images-1.medium.com/max/1250/1*Cld5noPmzIYf1F6n1O5vwA.png"],"links":["https://zerononcense.com","http://t.me/MerkleTrader","https://discord.gg/AYW5zDw","https://steemit.com/@proofofresearch","http://reddit.com/u/randomshortdude","https://twitter.com/ProofofResearch","https://ethereumworldnews.com/bitcoin-monero-price-prediction-2018/","https://www.tradingview.com/x/XIu5PVi5/","https://www.tradingview.com/x/Qt5VrcFT/","https://www.tradingview.com/x/MzxnNC98/","https://www.tradingview.com/x/JdDdqJxG/","https://www.investopedia.com/terms/l/laggingindicator.asp","https://www.tradingview.com/x/0tGiJ1Nv/","https://www.tradingview.com/x/lzEQtbnd/","https://www.tradingview.com/x/tmcnFyDr/","https://www.tradingview.com/x/IE8SP77N/","https://www.tradingview.com/x/zhfrKxUX/","https://www.tradingview.com/x/Te4R780j/","https://www.tradingview.com/x/GjZV6LHP/"],"app":"steemit/0.1","format":"markdown"} |
| Transaction Info | Block #25882021/Trx a7883390e919f0bb9d5d4c8ccc2ae7bb050cba00 |
View Raw JSON Data
{
"trx_id": "a7883390e919f0bb9d5d4c8ccc2ae7bb050cba00",
"block": 25882021,
"trx_in_block": 15,
"op_in_trx": 0,
"virtual_op": 0,
"timestamp": "2018-09-12T01:33:45",
"op": [
"comment",
{
"parent_author": "",
"parent_permlink": "bitcoin",
"author": "proofofresearch",
"permlink": "monero-price-analysis-bounce-possible",
"title": "Monero Price Analysis: Bounce Possible",
"body": "# Monero Price Analysis: Bounce Possible \n\n\n\n> Disclaimer: This article is not financial advice. The author is not a financial advisor and this article was not paid for.\n\n> For more information like this, join/follow our [Website](https://zerononcense.com), [Telegram](http://t.me/MerkleTrader), [Discord](https://discord.gg/AYW5zDw), [Steemit](https://steemit.com/@proofofresearch), [Reddit](http://reddit.com/u/randomshortdude), and [Twitter](https://twitter.com/ProofofResearch)!\n\nFor those that have been following Monero, you’ve probably noticed the extraordinarily bullish sentiment that has taken hold of the protocl in recent weeks.\n\nThere are a few reasons for that:\n\n1. On a technical trading level, Monero was looking delectable. Period.\n2. [There was a report that came out](https://ethereumworldnews.com/bitcoin-monero-price-prediction-2018/) that valued Monero somewhere in the upper reaches around $40k at some point in the near future (which is a few hundred/thousand percent above where it is currently).\n3. Monero is a solid project in general and things that are fundamentally solid in any market, with awareness and marketing behind it are never going to die — even when we’re in a bear market.\n\nNow that we got those facts out of the way, let’s get to the actual price analysis itself.\n\n# Monero Price Analysis (Daily TF)\n\n\n\n[https://www.tradingview.com/x/XIu5PVi5/](https://www.tradingview.com/x/XIu5PVi5/)\n\nFrom the chart, we can see a break above the baby-symmetric triangle (which resulted in a reversal), into a couple of bounces that eventually let the price start jumping out of the gym before touching back down to earth (where it is now).\n\nIf the mini-uptrend on the daily chart holds, then one should expect that the price will be increasing for Monero at any point now.\n\n**_Below, is another illustration of the chart to help traders get a better visual of what’s going on:_**\n\n\n\n[https://www.tradingview.com/x/Qt5VrcFT/](https://www.tradingview.com/x/Qt5VrcFT/)\n\n\n\n[https://www.tradingview.com/x/MzxnNC98/](https://www.tradingview.com/x/MzxnNC98/)\n\nIf the uptrend were to hold here, then the green arrow should symbolize where the price action will head to in the future.\n\nBut we can not just take this at face value!\n\nThis is crypto, and the price could just as easily break back down below the uptrend line.\n\nThere are a slew of **_negative price signals on the daily_**\n\n# EMA ( Exponential Moving Averages )\n\n\n\n[https://www.tradingview.com/x/JdDdqJxG/](https://www.tradingview.com/x/JdDdqJxG/)\n\n**_Burnt Orange_** = EMA-26\n\n**_Lime Yellow_** = EMA-12\n\nLooks like the **_EMA-12_** may be headed down below the **_EMA-26_**, which would be bearish and the price has already crossed below both EMA indicators, which is bearish in itself. So, this is something to watch for.\n\nHowever, it must be noted that the exponential moving averages are [**_lagging indicators_**.](https://www.investopedia.com/terms/l/laggingindicator.asp)\n\n\n\nSource: [https://www.investopedia.com/terms/l/laggingindicator.asp](https://www.investopedia.com/terms/l/laggingindicator.asp)\n\n# MACD (Moving Average Convergence Divergence) Indicator\n\n\n\n[https://www.tradingview.com/x/0tGiJ1Nv/](https://www.tradingview.com/x/0tGiJ1Nv/)\n\nThis is the MACD overlaid on the main chart.\n\nIts a bit messy, but you should still be able to clearly see the bearish cross of the MACD as well as the negative Histogram just getting started and the current bar is bigger than the last, and it also looks like the bars have just started on the negative side too — so, it looks like there’s no waning on that situation coming anytime soon.\n\n# Bollinger’s Bands\n\n\n\n[https://www.tradingview.com/x/lzEQtbnd/](https://www.tradingview.com/x/lzEQtbnd/)\n\nPrice isn’t even at the bottom of the Bollinger’s Bands on the daily. No bounce in sight.\n\n \n\n**_(Continued on September 11th, 2018)_**\n\n# Let’s Go to the 2 Hour\n\n\n\n[https://www.tradingview.com/x/tmcnFyDr/](https://www.tradingview.com/x/tmcnFyDr/)\n\nAs you can see in the photo above, the uptrend appears to be holding fairly and we can see a slight bounce off of the trendline at the end.\n\nThe yellow squares that you see are indicative of the touches on the trendline (please note that this does not need to be an “exact” touch, just within the general realm/region).\n\n# RSI(14) on the 2H\n\n\n\n[https://www.tradingview.com/x/IE8SP77N/](https://www.tradingview.com/x/IE8SP77N/)\n\nTruthfully, the RSI is a bit iffy here, but it does appear to be on its way up.\n\nXMR’s fate will probably be decided, in large part, by the performance of the crypto market in general.\n\nIf the crypto market s**** the bed at some point in time, then yeah, it’s most likely that the price of Monero is going to plummet with it. While it has been defying the market trend over the past month, it has not been entirely immune to downward moves.\n\nFor the most part, Monero has been on the move while Bitcoin/crypto markets are moving sideways/going up. But when the market is headed downward, it has generally been consolidating as well (we can even observe this phenomenon on the charts now).\n\nHowever, the fact that the uptrend line has held so solidly is fairly indicative of the fact that it is proving to be a **_reliable point of support for the price_**. But, a break below this could lead to the same disastrous drop in price that we had seen before.\n\n\n\n[https://www.tradingview.com/x/zhfrKxUX/](https://www.tradingview.com/x/zhfrKxUX/)\n\n\n\n[https://www.tradingview.com/x/Te4R780j/](https://www.tradingview.com/x/Te4R780j/)\n\nThe two pictures above show the inherent risk to traders if they are “wrong” about their long decision.\n\n# Conclusion (Strategy Advocacy; Not Financial Advice)\n\nIf it were left up to the author’s hands, and they were resolute on making some sort of play on Monero, then the best play would probably be to **_wait._**\n\nThe author is unsure about the liquidity of shorts on Bitfinex’s platform, but if the price does break down below the uptrend line that it is on, then Monero would be an excellent short. That’s something that most readers have probably gathered at this point.\n\nA price where this breakage below the uptrend would probably be most ‘apparent’, would be at $100. Or, one could wait until there is another massive decrease in the markets, and make sure to short a coin like Monero, because it is more than likely that it will finally depreciate like the rest of the market once it has finally broken its uptrend.\n\nConversely, if this does not happen, then a tentative long position should be placed at the **_next resistance point that gets broken_**.\n\n\n\n[https://www.tradingview.com/x/GjZV6LHP/](https://www.tradingview.com/x/GjZV6LHP/)\n\nIt’s fair to assume that the next notable resistance point for Monero is hovering in the $108-$110 range.\n\nThis resistance point was determined by looking at the top of the range that Monero is trading in.\n\nThus, if the price breaks above the point where Monero is at currently, it would be most prudent to place a long position there and then place a S/L just below the resistance point.\n\nPlacing a long where the price is at **_currently_** could be really risky, even if you have a solid S/L on the market because a **_dramatic reduction in price could lead_** to your S/L not being fulfilled at all. And such an event is much more likely to happen in the wake of a major sell off or decrease in price (which tends to happen when price breaks below a trendline).\n\nIn either case, be safe trading!",
"json_metadata": "{\"tags\":[\"bitcoin\",\"crypto\",\"cryptocurrency\",\"monero\",\"technicalanalysis\"],\"image\":[\"https://cdn-images-1.medium.com/max/1000/1*pUbEG8noGE9gT3sv13nKEw.png\",\"https://cdn-images-1.medium.com/max/1250/1*Z4COn2FxEiXJjiKjeHiAyQ.png\",\"https://cdn-images-1.medium.com/max/1250/1*UV413r4iKM7iUBWq_zu4fA.png\",\"https://cdn-images-1.medium.com/max/1250/1*VgnJbGvXs-Pqh6lEIXAq9Q.png\",\"https://cdn-images-1.medium.com/max/1250/1*eUvLoBa1HMlfvCM51GaeSQ.png\",\"https://cdn-images-1.medium.com/max/1250/1*YpXWhMqmquk3-KSPeNlo7w.png\",\"https://cdn-images-1.medium.com/max/1250/1*POrn2R7Cae2PVvZcRwHkgQ.png\",\"https://cdn-images-1.medium.com/max/1250/1*LB01gR6wnbS47rSAUUrW8Q.png\",\"https://cdn-images-1.medium.com/max/1250/1*TMTyt9U41-023fVwnkkr6g.png\",\"https://cdn-images-1.medium.com/max/1250/1*IIqsbQT0CldCMOd9EkDfyA.png\",\"https://cdn-images-1.medium.com/max/1250/1*UBQWjdDY2M6Vbhbv0thSgA.png\",\"https://cdn-images-1.medium.com/max/1250/1*Mf6g4dEy1OFEKWXlmlpfxg.png\",\"https://cdn-images-1.medium.com/max/1250/1*Cld5noPmzIYf1F6n1O5vwA.png\"],\"links\":[\"https://zerononcense.com\",\"http://t.me/MerkleTrader\",\"https://discord.gg/AYW5zDw\",\"https://steemit.com/@proofofresearch\",\"http://reddit.com/u/randomshortdude\",\"https://twitter.com/ProofofResearch\",\"https://ethereumworldnews.com/bitcoin-monero-price-prediction-2018/\",\"https://www.tradingview.com/x/XIu5PVi5/\",\"https://www.tradingview.com/x/Qt5VrcFT/\",\"https://www.tradingview.com/x/MzxnNC98/\",\"https://www.tradingview.com/x/JdDdqJxG/\",\"https://www.investopedia.com/terms/l/laggingindicator.asp\",\"https://www.tradingview.com/x/0tGiJ1Nv/\",\"https://www.tradingview.com/x/lzEQtbnd/\",\"https://www.tradingview.com/x/tmcnFyDr/\",\"https://www.tradingview.com/x/IE8SP77N/\",\"https://www.tradingview.com/x/zhfrKxUX/\",\"https://www.tradingview.com/x/Te4R780j/\",\"https://www.tradingview.com/x/GjZV6LHP/\"],\"app\":\"steemit/0.1\",\"format\":\"markdown\"}"
}
]
}2018/09/11 11:13:30
2018/09/11 11:13:30
| parent author | proofofresearch |
| parent permlink | litecoin-price-analysis |
| author | cryptolaidlaw |
| permlink | re-proofofresearch-litecoin-price-analysis-20180911t111330875z |
| title | |
| body | Thanks for sharing. There are definitely sound technical reasons for another considerable drop. Personally, I see strong support around the 46-48 USD region and again at around 38 USD. Let's see what happens. |
| json metadata | {"tags":["bitcoin"],"app":"steemit/0.1"} |
| Transaction Info | Block #25864819/Trx 77454c4f6ea05f3f0ae5078cc18abd7d3aa01284 |
View Raw JSON Data
{
  "trx_id": "77454c4f6ea05f3f0ae5078cc18abd7d3aa01284",
  "block": 25864819,
  "trx_in_block": 41,
  "op_in_trx": 0,
  "virtual_op": 0,
  "timestamp": "2018-09-11T11:13:30",
  "op": [
    "comment",
    {
      "parent_author": "proofofresearch",
      "parent_permlink": "litecoin-price-analysis",
      "author": "cryptolaidlaw",
      "permlink": "re-proofofresearch-litecoin-price-analysis-20180911t111330875z",
      "title": "",
      "body": "Thanks for sharing. There are definitely sound technical reasons for another considerable drop. Personally, I see strong support around the 46-48 USD region and again at around 38 USD. Let's see what happens.",
      "json_metadata": "{\"tags\":[\"bitcoin\"],\"app\":\"steemit/0.1\"}"
    }
  ]
}cryptolaidlawupvoted (100.00%) @proofofresearch / litecoin-price-analysis2018/09/11 11:10:03
cryptolaidlawupvoted (100.00%) @proofofresearch / litecoin-price-analysis
2018/09/11 11:10:03
| voter | cryptolaidlaw |
| author | proofofresearch |
| permlink | litecoin-price-analysis |
| weight | 10000 (100.00%) |
| Transaction Info | Block #25864750/Trx 9ad409670ce6554e82ce85a2b5f94cc169bf4a84 |
View Raw JSON Data
{
  "trx_id": "9ad409670ce6554e82ce85a2b5f94cc169bf4a84",
  "block": 25864750,
  "trx_in_block": 19,
  "op_in_trx": 0,
  "virtual_op": 0,
  "timestamp": "2018-09-11T11:10:03",
  "op": [
    "vote",
    {
      "voter": "cryptolaidlaw",
      "author": "proofofresearch",
      "permlink": "litecoin-price-analysis",
      "weight": 10000
    }
  ]
}Manabar
Voting Power100.00%
Downvote Power100.00%
Resource Credits100.00%
Reputation Progress86.91%
{
  "voting_manabar": {
    "current_mana": "16437212015",
    "last_update_time": 1539406014
  },
  "downvote_manabar": {
    "current_mana": 0,
    "last_update_time": 1532820414
  },
  "rc_account": {
    "account": "proofofresearch",
    "rc_manabar": {
      "current_mana": 687748366,
      "last_update_time": 1539419994
    },
    "max_rc_creation_adjustment": {
      "amount": "2020748973",
      "precision": 6,
      "nai": "@@000000037"
    },
    "max_rc": "18793414295"
  }
}
Account Metadata
| POSTING JSON METADATA | |
| profile | {"name":"ProofofResearch","profile_image":"https://cdn.steemitimages.com/DQmXWtFsFR64AC23HwGw1vAogsiKre8wm2v4c8yhndi8viT/Proof%20of%20Research%20Brain%20LARGE%20FULL%20w%20phrase.png","cover_image":"https://cdn.steemitimages.com/DQmWTC4cTfvzBmpgExMyhjmZtLcEdGDKVgaMb9t8EbRSABx/Wow%20this%20is%20awesome.png","website":"https://t.me/MerkleTrader"} |
| JSON METADATA | |
| profile | {"name":"ProofofResearch","profile_image":"https://cdn.steemitimages.com/DQmXWtFsFR64AC23HwGw1vAogsiKre8wm2v4c8yhndi8viT/Proof%20of%20Research%20Brain%20LARGE%20FULL%20w%20phrase.png","cover_image":"https://cdn.steemitimages.com/DQmWTC4cTfvzBmpgExMyhjmZtLcEdGDKVgaMb9t8EbRSABx/Wow%20this%20is%20awesome.png","website":"https://t.me/MerkleTrader"} |
{
  "posting_json_metadata": {
    "profile": {
      "name": "ProofofResearch",
      "profile_image": "https://cdn.steemitimages.com/DQmXWtFsFR64AC23HwGw1vAogsiKre8wm2v4c8yhndi8viT/Proof%20of%20Research%20Brain%20LARGE%20FULL%20w%20phrase.png",
      "cover_image": "https://cdn.steemitimages.com/DQmWTC4cTfvzBmpgExMyhjmZtLcEdGDKVgaMb9t8EbRSABx/Wow%20this%20is%20awesome.png",
      "website": "https://t.me/MerkleTrader"
    }
  },
  "json_metadata": {
    "profile": {
      "name": "ProofofResearch",
      "profile_image": "https://cdn.steemitimages.com/DQmXWtFsFR64AC23HwGw1vAogsiKre8wm2v4c8yhndi8viT/Proof%20of%20Research%20Brain%20LARGE%20FULL%20w%20phrase.png",
      "cover_image": "https://cdn.steemitimages.com/DQmWTC4cTfvzBmpgExMyhjmZtLcEdGDKVgaMb9t8EbRSABx/Wow%20this%20is%20awesome.png",
      "website": "https://t.me/MerkleTrader"
    }
  }
}
Auth Keys
Owner
Single Signature
Public Keys
STM6UHRSsR2p6iQcRJJYioikQCThcvDatDwGHZy9gwkyoy65M1pPH1/1
Active
Single Signature
Public Keys
STM6KyYr1JLnCE2CainvgWyKWCeKwKs5BXvDAGwnbJB1QzNxWzRXa1/1
Posting
Single Signature
Public Keys
STM5pcS8NVoo7TCn4KRkavn2kVS4onNtUd1egNDuRLfC8goHXg5E61/1
Memo
STM7juYLhpRsZRGxSfGeamVMky42f74nCjoqseUgv3ekmVv82FcLh
{
  "owner": {
    "weight_threshold": 1,
    "account_auths": [],
    "key_auths": [
      [
        "STM6UHRSsR2p6iQcRJJYioikQCThcvDatDwGHZy9gwkyoy65M1pPH",
        1
      ]
    ]
  },
  "active": {
    "weight_threshold": 1,
    "account_auths": [],
    "key_auths": [
      [
        "STM6KyYr1JLnCE2CainvgWyKWCeKwKs5BXvDAGwnbJB1QzNxWzRXa",
        1
      ]
    ]
  },
  "posting": {
    "weight_threshold": 1,
    "account_auths": [],
    "key_auths": [
      [
        "STM5pcS8NVoo7TCn4KRkavn2kVS4onNtUd1egNDuRLfC8goHXg5E6",
        1
      ]
    ]
  },
  "memo": "STM7juYLhpRsZRGxSfGeamVMky42f74nCjoqseUgv3ekmVv82FcLh"
}
Witness Votes
0 / 30
No active witness votes.
[]