@barrylee
31QingCheng AE Institute (Guangzhou) Co., Ltd have been committed to acoustic emission detection and monitoring in NDT industry for more than 20 years.
steemit.com/@barryleeVOTING POWER100.00%
DOWNVOTE POWER100.00%
RESOURCE CREDITS100.00%
REPUTATION PROGRESS48.85%
Net Worth
0.014USD
STEEM
0.263STEEM
SBD
0.000SBD
Effective Power
3.430SP
├── Own SP
0.000SP
└── Incoming DelegationsDeleg
+3.430SP
Detailed Balance
| STEEM | ||
| balance | 0.184STEEM | STEEM |
| market_balance | 0.000STEEM | STEEM |
| savings_balance | 0.000STEEM | STEEM |
| reward_steem_balance | 0.079STEEM | STEEM |
| STEEM POWER | ||
| Own SP | 0.000SP | SP |
| Delegated Out | 0.000SP | SP |
| Delegation In | 3.430SP | SP |
| Effective Power | 3.430SP | SP |
| Reward SP (pending) | 0.080SP | SP |
| SBD | ||
| sbd_balance | 0.000SBD | SBD |
| sbd_conversions | 0.000SBD | SBD |
| sbd_market_balance | 0.000SBD | SBD |
| savings_sbd_balance | 0.000SBD | SBD |
| reward_sbd_balance | 0.000SBD | SBD |
{
  "balance": "0.184 STEEM",
  "savings_balance": "0.000 STEEM",
  "reward_steem_balance": "0.079 STEEM",
  "vesting_shares": "0.000000 VESTS",
  "delegated_vesting_shares": "0.000000 VESTS",
  "received_vesting_shares": "5585.256183 VESTS",
  "sbd_balance": "0.000 SBD",
  "savings_sbd_balance": "0.000 SBD",
  "reward_sbd_balance": "0.000 SBD",
  "conversions": []
}
Account Info
| name | barrylee |
| id | 1800009 |
| rank | 1,030,714 |
| reputation | 5259542925 |
| created | 2023-03-24T06:25:18 |
| recovery_account | steemcurator01 |
| proxy | None |
| post_count | 84 |
| comment_count | 0 |
| lifetime_vote_count | 0 |
| witnesses_voted_for | 0 |
| last_post | 2025-01-19T10:55:06 |
| last_root_post | 2025-01-19T10:55:06 |
| last_vote_time | 2023-03-24T06:37:54 |
| proxied_vsf_votes | 0, 0, 0, 0 |
| can_vote | 1 |
| voting_power | 0 |
| delayed_votes | 0 |
| balance | 0.184 STEEM |
| savings_balance | 0.000 STEEM |
| sbd_balance | 0.000 SBD |
| savings_sbd_balance | 0.000 SBD |
| vesting_shares | 0.000000 VESTS |
| delegated_vesting_shares | 0.000000 VESTS |
| received_vesting_shares | 5585.256183 VESTS |
| reward_vesting_balance | 137.756157 VESTS |
| vesting_balance | 0.000 STEEM |
| vesting_withdraw_rate | 0.000000 VESTS |
| next_vesting_withdrawal | 1969-12-31T23:59:59 |
| withdrawn | 0 |
| to_withdraw | 0 |
| withdraw_routes | 0 |
| savings_withdraw_requests | 0 |
| last_account_recovery | 1970-01-01T00:00:00 |
| reset_account | null |
| last_owner_update | 1970-01-01T00:00:00 |
| last_account_update | 2024-09-27T09:39:15 |
| mined | No |
| sbd_seconds | 0 |
| sbd_last_interest_payment | 1970-01-01T00:00:00 |
| savings_sbd_last_interest_payment | 1970-01-01T00:00:00 |
{
  "id": 1800009,
  "name": "barrylee",
  "owner": {
    "weight_threshold": 1,
    "account_auths": [],
    "key_auths": [
      [
        "STM5WDJ5jVXuN27exTThXTh7S82MP7gxnPDW7Evi7u5243cz4hnNP",
        1
      ]
    ]
  },
  "active": {
    "weight_threshold": 1,
    "account_auths": [],
    "key_auths": [
      [
        "STM4vmtm6jDJUMt6666fFaGXVunQo6sUiwQDwVFKLLt1mJvvhiXKG",
        1
      ]
    ]
  },
  "posting": {
    "weight_threshold": 1,
    "account_auths": [],
    "key_auths": [
      [
        "STM5yCXao13ZwvxLBJyKWakfjp9FW543oe3DFf4qnKxTk99VB4xam",
        1
      ]
    ]
  },
  "memo_key": "STM6mwnLrgnmBBV8y1eZKyR4Gm1L9Zd2KCzTmU2YPMx2rixGZWXGU",
  "json_metadata": "{}",
  "posting_json_metadata": "{\"profile\":{\"profile_image\":\"https://cdn.steemitimages.com/DQmXbKk6eTxNNfPnudYCgKHmJvHCHmivAnaFDsAVDXsRjrU/jpg2.jpg\",\"cover_image\":\"https://cdn.steemitimages.com/DQmXGbD3ofNYWjvzTdaFtHFwrfdoTVkk2yDYS33BT54Db2p/channels4_banner.jpg\",\"name\":\"Qawrums Ltd\",\"about\":\"QingCheng AE Institute (Guangzhou) Co., Ltd have been committed to acoustic emission detection and monitoring in NDT industry for more than 20 years.\",\"location\":\"China\",\"website\":\"https://www.aendt.com\",\"version\":2}}",
  "proxy": "",
  "last_owner_update": "1970-01-01T00:00:00",
  "last_account_update": "2024-09-27T09:39:15",
  "created": "2023-03-24T06:25:18",
  "mined": false,
  "recovery_account": "steemcurator01",
  "last_account_recovery": "1970-01-01T00:00:00",
  "reset_account": "null",
  "comment_count": 0,
  "lifetime_vote_count": 0,
  "post_count": 84,
  "can_vote": true,
  "voting_manabar": {
    "current_mana": "5585256183",
    "last_update_time": 1745150373
  },
  "downvote_manabar": {
    "current_mana": 1396314045,
    "last_update_time": 1745150373
  },
  "voting_power": 0,
  "balance": "0.184 STEEM",
  "savings_balance": "0.000 STEEM",
  "sbd_balance": "0.000 SBD",
  "sbd_seconds": "0",
  "sbd_seconds_last_update": "1970-01-01T00:00:00",
  "sbd_last_interest_payment": "1970-01-01T00:00:00",
  "savings_sbd_balance": "0.000 SBD",
  "savings_sbd_seconds": "0",
  "savings_sbd_seconds_last_update": "1970-01-01T00:00:00",
  "savings_sbd_last_interest_payment": "1970-01-01T00:00:00",
  "savings_withdraw_requests": 0,
  "reward_sbd_balance": "0.000 SBD",
  "reward_steem_balance": "0.079 STEEM",
  "reward_vesting_balance": "137.756157 VESTS",
  "reward_vesting_steem": "0.080 STEEM",
  "vesting_shares": "0.000000 VESTS",
  "delegated_vesting_shares": "0.000000 VESTS",
  "received_vesting_shares": "5585.256183 VESTS",
  "vesting_withdraw_rate": "0.000000 VESTS",
  "next_vesting_withdrawal": "1969-12-31T23:59:59",
  "withdrawn": 0,
  "to_withdraw": 0,
  "withdraw_routes": 0,
  "curation_rewards": 0,
  "posting_rewards": 159,
  "proxied_vsf_votes": [
    0,
    0,
    0,
    0
  ],
  "witnesses_voted_for": 0,
  "last_post": "2025-01-19T10:55:06",
  "last_root_post": "2025-01-19T10:55:06",
  "last_vote_time": "2023-03-24T06:37:54",
  "post_bandwidth": 0,
  "pending_claimed_accounts": 0,
  "vesting_balance": "0.000 STEEM",
  "reputation": "5259542925",
  "transfer_history": [],
  "market_history": [],
  "post_history": [],
  "vote_history": [],
  "other_history": [],
  "witness_votes": [],
  "tags_usage": [],
  "guest_bloggers": [],
  "rank": 1030714
}
Withdraw Routes
| Incoming | Outgoing |
|---|---|
Empty | Empty |
{
  "incoming": [],
  "outgoing": []
}From Date
To Date
2025/04/20 11:59:33
2025/04/20 11:59:33
| delegatee | barrylee |
| delegator | steem |
| vesting shares | 5585.256183 VESTS |
| Transaction Info | Block #94870197/Trx 570dd9bb4d896fb52e527c7ece73df0bc92d221b |
View Raw JSON Data
{
  "block": 94870197,
  "op": [
    "delegate_vesting_shares",
    {
      "delegatee": "barrylee",
      "delegator": "steem",
      "vesting_shares": "5585.256183 VESTS"
    }
  ],
  "op_in_trx": 0,
  "timestamp": "2025-04-20T11:59:33",
  "trx_id": "570dd9bb4d896fb52e527c7ece73df0bc92d221b",
  "trx_in_block": 1,
  "virtual_op": 0
}barryleepublished a new post: acoustic-emission-testing-latest-news-and-manufacturer-developments-in-20252025/01/19 10:56:27
barryleepublished a new post: acoustic-emission-testing-latest-news-and-manufacturer-developments-in-2025
2025/01/19 10:56:27
| author | barrylee |
| body | @@ -8334,16 +8334,17 @@ og/acous +t ic-emiss |
| json metadata | {"links":["https://www.aendt.com/blog/acoustic-emission-testing.html","https://www.aendt.com/"],"app":"steemit/0.2","format":"html"} |
| parent author | |
| parent permlink | trends |
| permlink | acoustic-emission-testing-latest-news-and-manufacturer-developments-in-2025 |
| title | Acoustic Emission Testing: Latest News and Manufacturer Developments in 2025 |
| Transaction Info | Block #92255712/Trx a43a69937565b2969d4829f65a33f19ccb429d78 |
View Raw JSON Data
{
  "block": 92255712,
  "op": [
    "comment",
    {
      "author": "barrylee",
      "body": "@@ -8334,16 +8334,17 @@\n og/acous\n+t\n ic-emiss\n",
      "json_metadata": "{\"links\":[\"https://www.aendt.com/blog/acoustic-emission-testing.html\",\"https://www.aendt.com/\"],\"app\":\"steemit/0.2\",\"format\":\"html\"}",
      "parent_author": "",
      "parent_permlink": "trends",
      "permlink": "acoustic-emission-testing-latest-news-and-manufacturer-developments-in-2025",
      "title": "Acoustic Emission Testing: Latest News and Manufacturer Developments in 2025"
    }
  ],
  "op_in_trx": 0,
  "timestamp": "2025-01-19T10:56:27",
  "trx_id": "a43a69937565b2969d4829f65a33f19ccb429d78",
  "trx_in_block": 0,
  "virtual_op": 0
}barryleepublished a new post: acoustic-emission-testing-latest-news-and-manufacturer-developments-in-20252025/01/19 10:55:06
barryleepublished a new post: acoustic-emission-testing-latest-news-and-manufacturer-developments-in-2025
2025/01/19 10:55:06
| author | barrylee |
| body | <html> <p> </p> <h1>Market Trends</h1> <p>The global <a href="https://www.aendt.com/blog/acoustic-emission-testing.html">acoustic emission testing</a> (AET) market is experiencing significant growth, with an estimated size of USD 399.70 million in 2025, projected to reach USD 555.38 million by 2030, at a CAGR of 6.8% during the forecast period (2025–2030). This growth is driven by increasing safety concerns to enhance productivity and the rising demand in various industry verticals. The market is also being fueled by technological innovations such as advances in sensor technology and the development of advanced AE testing equipment. These innovations have enhanced the accuracy, reliability, and efficiency of structural integrity monitoring. The integration of AI and machine learning algorithms has further augmented the capabilities of AE testing systems, enabling predictive maintenance and real-time analysis. Stricter safety regulations across industries require regular inspections and maintenance of assets, driving the adoption of AE testing methods. The digital transformation of industries and increased investment in Maintenance 4.0 technologies also underscore the significant growth potential of the AE testing market.</p> <h1>Application Developments</h1> <ul><li><strong>Structural Health Monitoring</strong>: <a href="https://www.aendt.com/blog/acoustic-emission-testing.html">AET</a> is widely used for continuous, real-time assessment of critical infrastructure such as bridges, dams, and high-rise buildings. It helps identify micro-cracks and stress-induced failures before they evolve into structural hazards.</li><li><strong>Pipeline Inspection</strong>: AET is used for detecting active damage mechanisms in real-time in pipeline systems, including corrosion detection, crack growth monitoring, and leak detection. Improved sensor sensitivity enables the detection of micro-leaks in challenging environments.</li><li><strong>Pressure Vessels</strong>: AET facilitates early defect detection and real-time integrity assessment of pressure vessels during hydrostatic or pneumatic pressure tests.</li><li><strong>Aerospace</strong>: AET is applied to advanced metallic alloys and additive-manufactured (3D-printed) components in the aerospace industry. It is used for detecting voids or micro-cracks introduced during fabrication and for dynamic flight condition monitoring.</li><li><strong>Corrosion Monitoring in Offshore Structures</strong>: The offshore oil and gas industry is increasingly relying on AET for corrosion detection in structures such as risers, jackets, and platforms. AET provides live feedback on pitting and stress-corrosion cracking caused by aggressive saltwater conditions.</li><li><strong>Infrastructure and Urban Applications</strong>: AET is expanding its application to urban environments, including large-scale infrastructure projects such as smart cities, heritage structure preservation, wind turbine monitoring, and solar panel structural health.</li><li><strong>Leak Detection in Cryogenic Systems</strong>: AET is used for leak detection in cryogenic systems in space exploration and liquefied natural gas (LNG) transportation, identifying leaks caused by thermal stress in cryogenic tanks and pipelines.</li></ul> <h1>Upcoming Events</h1> <ul><li><strong>III AE 2025</strong>: The 27th International Acoustic Emission Symposium will be held from November 4–7, 2025, at the Nagoya Convention Hall, Aichi-Nagoya, Japan. The conference is co-sponsored by the R&T Committee on AE, JSNDI (Japanese Society for Non-Destructive Inspection), EWGAE (European Working Group on Acoustic Emission), and AEWG (Acoustic Emission Working Group, U.S.A).</li><li><strong>SCHALL 25</strong>: This event will be held from March 27–28, 2025, in Dresden, Germany. It focuses on acoustic emission test methods and testing with guided waves. The event includes numerous presentations, exciting workshops, and an equipment exhibition.</li></ul> <h1>Key Manufacturers and Their Developments</h1> <ul><li><strong>Physical Acoustics</strong></li><li><strong>Sales and Revenue</strong>: A leading player in the AET equipment market, Physical Acoustics has significant sales and revenue and continues to invest in R&D to enhance product offerings.</li><li><strong>Recent Developments</strong>: Launched advanced AE testing systems that integrate AI for predictive maintenance and real-time analysis.</li><li><strong>Vallen Systeme GmbH</strong></li><li><strong>Sales and Revenue</strong>: Strong market presence in Europe with steady growth due to innovative products and extensive customer base.</li><li><strong>Recent Developments</strong>: Introduced new sensors with higher sensitivity and durability, suitable for harsh environments like offshore platforms and wind turbines.</li><li><a href="https://www.aendt.com/"><strong>Qawrums Ltd.</strong></a></li><li><strong>Sales and Revenue</strong>: Focusing on the European and Middle Eastern markets with growing sales and revenue due to innovative AE testing solutions.</li><li><strong>Recent Developments</strong>: Introduced new AE testing systems that integrate with IoT technologies, enabling remote monitoring and data analysis.</li><li><strong>Hexagon</strong></li><li><strong>Sales and Revenue</strong>: A global leader in measurement and information technologies with robust AET equipment sales and revenue.</li><li><strong>Recent Developments</strong>: Focused on integrating advanced analytics and data management solutions into AE testing equipment, enhancing overall efficiency and accuracy.</li><li><strong>Senseven</strong></li><li><strong>Sales and Revenue</strong>: Expanding market share in the Asia-Pacific region with growing sales and revenue due to cost-effective and high-performance products.</li><li><strong>Recent Developments</strong>: Launched new AE testing systems specifically designed for the wind power and aerospace industries.</li><li><strong>Score Group plc</strong></li><li><strong>Sales and Revenue</strong>: Significant presence in the oil and gas industry with sales and revenue driven by increasing demand for corrosion and leak detection solutions.</li><li><strong>Recent Developments</strong>: Developed advanced AE testing equipment that can operate in high-temperature and high-pressure environments.</li><li><strong>Innerspec</strong></li><li><strong>Sales and Revenue</strong>: Known for advanced AE testing solutions in the aerospace and defense sectors with growing sales and revenue.</li><li><strong>Recent Developments</strong>: Introduced new AE testing systems that combine multiple non-destructive testing techniques for more comprehensive structural health monitoring.</li><li><strong>Blue Star Engineering & Electronics Ltd</strong></li><li><strong>Sales and Revenue</strong>: Expanding market share in the Indian and Southeast Asian markets with growing sales and revenue due to cost-effective and reliable AE testing equipment.</li><li><strong>Recent Developments</strong>: Launched new AE testing systems with advanced data analysis capabilities.</li></ul> <h1>Market Trends and Future Outlook</h1> <ul><li><strong>Technological Innovations</strong>: Manufacturers are focusing on integrating advanced sensor technology, AI, and machine learning algorithms to enhance the capabilities of AE testing equipment, enabling more accurate and efficient structural health monitoring.</li><li><strong>Expanding Applications</strong>: The market is expanding into new applications such as smart cities, heritage structure preservation, and renewable energy systems, creating new opportunities for specialized AE testing solutions.</li><li><strong>Regulatory Compliance</strong>: Stricter safety regulations and quality standards are driving the demand for AE testing equipment, with manufacturers investing in R&D to ensure compliance.</li><li><strong>Digital Transformation</strong>: The digital transformation of industries is leading to increased investment in Maintenance 4.0 technologies, with manufacturers developing AE testing systems that can integrate with these technologies for real-time data and predictive maintenance solutions.</li></ul> <p>These developments and trends highlight the ongoing growth and innovation in the field of <a href="https://www.aendt.com/blog/acousic-emission-testing.html">acoustic emission testing</a> and equipment manufacturing, showcasing the industry’s commitment to enhancing safety, efficiency, and reliability across various sectors.</p> <p> <br/></p> </html> |
| json metadata | {"tags":["trends"],"links":["https://www.aendt.com/blog/acoustic-emission-testing.html","https://www.aendt.com/","https://www.aendt.com/blog/acousic-emission-testing.html"],"app":"steemit/0.2","format":"html"} |
| parent author | |
| parent permlink | trends |
| permlink | acoustic-emission-testing-latest-news-and-manufacturer-developments-in-2025 |
| title | Acoustic Emission Testing: Latest News and Manufacturer Developments in 2025 |
| Transaction Info | Block #92255685/Trx cc4f2dd97e6c8f9c28a044681e9e5535a0aa40dc |
View Raw JSON Data
{
"block": 92255685,
"op": [
"comment",
{
"author": "barrylee",
"body": "<html>\n<p>\r</p>\n<h1>Market Trends</h1>\n<p>The global <a href=\"https://www.aendt.com/blog/acoustic-emission-testing.html\">acoustic emission testing</a> (AET) market is experiencing significant growth, with an estimated size of USD 399.70 million in 2025, projected to reach USD 555.38 million by 2030, at a CAGR of 6.8% during the forecast period (2025–2030). This growth is driven by increasing safety concerns to enhance productivity and the rising demand in various industry verticals. The market is also being fueled by technological innovations such as advances in sensor technology and the development of advanced AE testing equipment. These innovations have enhanced the accuracy, reliability, and efficiency of structural integrity monitoring. The integration of AI and machine learning algorithms has further augmented the capabilities of AE testing systems, enabling predictive maintenance and real-time analysis. Stricter safety regulations across industries require regular inspections and maintenance of assets, driving the adoption of AE testing methods. The digital transformation of industries and increased investment in Maintenance 4.0 technologies also underscore the significant growth potential of the AE testing market.</p>\n<h1>Application Developments</h1>\n<ul><li><strong>Structural Health Monitoring</strong>: <a href=\"https://www.aendt.com/blog/acoustic-emission-testing.html\">AET</a> is widely used for continuous, real-time assessment of critical infrastructure such as bridges, dams, and high-rise buildings. It helps identify micro-cracks and stress-induced failures before they evolve into structural hazards.</li><li><strong>Pipeline Inspection</strong>: AET is used for detecting active damage mechanisms in real-time in pipeline systems, including corrosion detection, crack growth monitoring, and leak detection. Improved sensor sensitivity enables the detection of micro-leaks in challenging environments.</li><li><strong>Pressure Vessels</strong>: AET facilitates early defect detection and real-time integrity assessment of pressure vessels during hydrostatic or pneumatic pressure tests.</li><li><strong>Aerospace</strong>: AET is applied to advanced metallic alloys and additive-manufactured (3D-printed) components in the aerospace industry. It is used for detecting voids or micro-cracks introduced during fabrication and for dynamic flight condition monitoring.</li><li><strong>Corrosion Monitoring in Offshore Structures</strong>: The offshore oil and gas industry is increasingly relying on AET for corrosion detection in structures such as risers, jackets, and platforms. AET provides live feedback on pitting and stress-corrosion cracking caused by aggressive saltwater conditions.</li><li><strong>Infrastructure and Urban Applications</strong>: AET is expanding its application to urban environments, including large-scale infrastructure projects such as smart cities, heritage structure preservation, wind turbine monitoring, and solar panel structural health.</li><li><strong>Leak Detection in Cryogenic Systems</strong>: AET is used for leak detection in cryogenic systems in space exploration and liquefied natural gas (LNG) transportation, identifying leaks caused by thermal stress in cryogenic tanks and pipelines.</li></ul>\n<h1>Upcoming Events</h1>\n<ul><li><strong>III AE 2025</strong>: The 27th International Acoustic Emission Symposium will be held from November 4–7, 2025, at the Nagoya Convention Hall, Aichi-Nagoya, Japan. The conference is co-sponsored by the R&T Committee on AE, JSNDI (Japanese Society for Non-Destructive Inspection), EWGAE (European Working Group on Acoustic Emission), and AEWG (Acoustic Emission Working Group, U.S.A).</li><li><strong>SCHALL 25</strong>: This event will be held from March 27–28, 2025, in Dresden, Germany. It focuses on acoustic emission test methods and testing with guided waves. The event includes numerous presentations, exciting workshops, and an equipment exhibition.</li></ul>\n<h1>Key Manufacturers and Their Developments</h1>\n<ul><li><strong>Physical Acoustics</strong></li><li><strong>Sales and Revenue</strong>: A leading player in the AET equipment market, Physical Acoustics has significant sales and revenue and continues to invest in R&D to enhance product offerings.</li><li><strong>Recent Developments</strong>: Launched advanced AE testing systems that integrate AI for predictive maintenance and real-time analysis.</li><li><strong>Vallen Systeme GmbH</strong></li><li><strong>Sales and Revenue</strong>: Strong market presence in Europe with steady growth due to innovative products and extensive customer base.</li><li><strong>Recent Developments</strong>: Introduced new sensors with higher sensitivity and durability, suitable for harsh environments like offshore platforms and wind turbines.</li><li><a href=\"https://www.aendt.com/\"><strong>Qawrums Ltd.</strong></a></li><li><strong>Sales and Revenue</strong>: Focusing on the European and Middle Eastern markets with growing sales and revenue due to innovative AE testing solutions.</li><li><strong>Recent Developments</strong>: Introduced new AE testing systems that integrate with IoT technologies, enabling remote monitoring and data analysis.</li><li><strong>Hexagon</strong></li><li><strong>Sales and Revenue</strong>: A global leader in measurement and information technologies with robust AET equipment sales and revenue.</li><li><strong>Recent Developments</strong>: Focused on integrating advanced analytics and data management solutions into AE testing equipment, enhancing overall efficiency and accuracy.</li><li><strong>Senseven</strong></li><li><strong>Sales and Revenue</strong>: Expanding market share in the Asia-Pacific region with growing sales and revenue due to cost-effective and high-performance products.</li><li><strong>Recent Developments</strong>: Launched new AE testing systems specifically designed for the wind power and aerospace industries.</li><li><strong>Score Group plc</strong></li><li><strong>Sales and Revenue</strong>: Significant presence in the oil and gas industry with sales and revenue driven by increasing demand for corrosion and leak detection solutions.</li><li><strong>Recent Developments</strong>: Developed advanced AE testing equipment that can operate in high-temperature and high-pressure environments.</li><li><strong>Innerspec</strong></li><li><strong>Sales and Revenue</strong>: Known for advanced AE testing solutions in the aerospace and defense sectors with growing sales and revenue.</li><li><strong>Recent Developments</strong>: Introduced new AE testing systems that combine multiple non-destructive testing techniques for more comprehensive structural health monitoring.</li><li><strong>Blue Star Engineering & Electronics Ltd</strong></li><li><strong>Sales and Revenue</strong>: Expanding market share in the Indian and Southeast Asian markets with growing sales and revenue due to cost-effective and reliable AE testing equipment.</li><li><strong>Recent Developments</strong>: Launched new AE testing systems with advanced data analysis capabilities.</li></ul>\n<h1>Market Trends and Future Outlook</h1>\n<ul><li><strong>Technological Innovations</strong>: Manufacturers are focusing on integrating advanced sensor technology, AI, and machine learning algorithms to enhance the capabilities of AE testing equipment, enabling more accurate and efficient structural health monitoring.</li><li><strong>Expanding Applications</strong>: The market is expanding into new applications such as smart cities, heritage structure preservation, and renewable energy systems, creating new opportunities for specialized AE testing solutions.</li><li><strong>Regulatory Compliance</strong>: Stricter safety regulations and quality standards are driving the demand for AE testing equipment, with manufacturers investing in R&D to ensure compliance.</li><li><strong>Digital Transformation</strong>: The digital transformation of industries is leading to increased investment in Maintenance 4.0 technologies, with manufacturers developing AE testing systems that can integrate with these technologies for real-time data and predictive maintenance solutions.</li></ul>\n<p>These developments and trends highlight the ongoing growth and innovation in the field of <a href=\"https://www.aendt.com/blog/acousic-emission-testing.html\">acoustic emission testing</a> and equipment manufacturing, showcasing the industry’s commitment to enhancing safety, efficiency, and reliability across various sectors.</p>\n<p>\r<br/></p>\n</html>",
"json_metadata": "{\"tags\":[\"trends\"],\"links\":[\"https://www.aendt.com/blog/acoustic-emission-testing.html\",\"https://www.aendt.com/\",\"https://www.aendt.com/blog/acousic-emission-testing.html\"],\"app\":\"steemit/0.2\",\"format\":\"html\"}",
"parent_author": "",
"parent_permlink": "trends",
"permlink": "acoustic-emission-testing-latest-news-and-manufacturer-developments-in-2025",
"title": "Acoustic Emission Testing: Latest News and Manufacturer Developments in 2025"
}
],
"op_in_trx": 0,
"timestamp": "2025-01-19T10:55:06",
"trx_id": "cc4f2dd97e6c8f9c28a044681e9e5535a0aa40dc",
"trx_in_block": 39,
"virtual_op": 0
}2025/01/07 02:41:27
2025/01/07 02:41:27
| author | barrylee |
| permlink | distributed-wireless-acoustic-emission-system-and-its-application-based-on-gps-wifi-high-precision-wireless-synchronous-clock |
| voter | barrylee |
| weight | -10000 (-100.00%) |
| Transaction Info | Block #91901013/Trx 25d14fa4c94cf2c7bebdc7a20f211bb9e73f558d |
View Raw JSON Data
{
  "block": 91901013,
  "op": [
    "vote",
    {
      "author": "barrylee",
      "permlink": "distributed-wireless-acoustic-emission-system-and-its-application-based-on-gps-wifi-high-precision-wireless-synchronous-clock",
      "voter": "barrylee",
      "weight": -10000
    }
  ],
  "op_in_trx": 0,
  "timestamp": "2025-01-07T02:41:27",
  "trx_id": "25d14fa4c94cf2c7bebdc7a20f211bb9e73f558d",
  "trx_in_block": 0,
  "virtual_op": 0
}2025/01/07 02:39:06
2025/01/07 02:39:06
| author | barrylee |
| permlink | 2mgijf |
| voter | barrylee |
| weight | -10000 (-100.00%) |
| Transaction Info | Block #91900967/Trx a6ea496ff98d32d26e1e38654458623f5064b61f |
View Raw JSON Data
{
  "block": 91900967,
  "op": [
    "vote",
    {
      "author": "barrylee",
      "permlink": "2mgijf",
      "voter": "barrylee",
      "weight": -10000
    }
  ],
  "op_in_trx": 0,
  "timestamp": "2025-01-07T02:39:06",
  "trx_id": "a6ea496ff98d32d26e1e38654458623f5064b61f",
  "trx_in_block": 0,
  "virtual_op": 0
}2024/12/31 12:43:57
2024/12/31 12:43:57
| author | barrylee |
| body | <html> <p>1、lora组网的RAEM2监测系统</p> <p>lora通讯方式组网,具有低功耗、远距离,能穿透建筑物,信号覆盖范围广的优势,通常用于部署大规模、分散的传感器网络。</p> <h1>lora通讯组网实现低功耗远距离传输</h1> <p><strong>原理:</strong><br/><a href="https://www.ae-ndt.com/">RAEM2</a>通过lora通讯方式组网,信号传输到边缘计算网关RK3588进行边缘计算,或直接通过lora网关透传到各类云平台,实现远程数据监测和参数远程配置。</p> <p>注:可定制其他的通讯方式,如WiFi,Zigbee,网口,USB3.0等。</p> <p>lora组网<a href="https://www.ae-ndt.com/">RAEM2监测系统</a>组成: RAEM2采集器、RK3588边缘计算网关、云平台、蓝牙巡检APP。</p> <p><img src="https://miro.medium.com/v2/resize:fit:1400/0*JDigGpyYrm8e5RWw.jpg" alt=""/></p> <h1>过程可视化</h1> <ul><li>365天在线监测,物联网远程操作使用,结合机器学习算法实时分析处理,满足快速响应的需求,提高数据处理效率,手机蓝牙巡检APP实现巡检。</li><li>自动给出检测监测诊断结果</li><li>在线和历史数据屏幕显示</li><li>AI机器学习算法高效处理数据</li><li>对厂区阀门泄露、跑冒滴点、转动设备(电动机,轴承等)的磨损、润滑状态进行可视化监测</li></ul> <p><img src="https://miro.medium.com/v2/resize:fit:1400/0*Pm9-KJo-wZk0qdjL.jpg" alt=""/></p> <h1>快速部署安装</h1> <p><strong>非侵入设计,无需布线和电源,实现设备快速部署安装</strong></p> <ul><li>①<a href="https://www.ae-ndt.com/">RAEM2内置声发射传感器</a>版本<br/>将RAEM2采集器底部涂上耦合剂,直接安装在被测物表面,转动设备安装在轴承的固定位置(轴承座),确保底部与打磨掉漆后的被测物表面耦合良好,边缘计算网关RK3588放置在安装现场指定位置的设备安放箱。</li><li>②RAEM2外置声发射传感器版本<br/>传感器底部涂耦合剂后安装在被测物表面,转动设备安装在轴承的固定位置(轴承座),耦合剂采用真空脂,利用磁夹具辅助安装,确保传感器与被测面耦合良好;传感器输出端接入同轴电缆(具体长度根据现场确定),按照现场安装要求,通过线管或线槽,走线至指定RAEM2采集器安装位置,RAEM2采集器、边缘计算网关RK3588布置在安放箱内。</li></ul> <h1>应用范围</h1> <p>厂区阀门泄漏监测、跑冒滴漏点监测(难于或不能接近环境下的检测同样适用如高低温、核辐射、易燃、易爆极毒等环境),转动设备(电动机,轴承等)的磨损、润滑状态监测。</p> <p><img src="https://miro.medium.com/v2/resize:fit:1400/0*8pjg27RPG509MR_3.jpg" alt=""/><img src="https://miro.medium.com/v2/resize:fit:1400/0*I7b3sVv9lDhVvxR2.jpg" alt=""/></p> <h1>2、软硬件介绍</h1> <h1>硬件介绍</h1> <p>RAEM2是一款一体化状态监测系统,将声发射传感器、电池、数据采集模块和通信模块内置在一个小型铝合金圆柱体外壳中,其底部内置有磁铁,可以磁吸在铁磁性材料物体表面,时间触发采集,RAEM2按照休眠时间自动唤醒采集数据,不依赖电脑具有高可靠性,适用于长期连续无人值守的状态监测,具备蓝牙短距离巡检功能,物联网云平台用于远程数据监控和参数配置。</p> <h1>RAEM2内置传感器版本实物图</h1> <p><img src="https://miro.medium.com/v2/resize:fit:816/0*ER3H8Gq-w0EAbHDI.png" alt=""/><img src="https://miro.medium.com/v2/resize:fit:686/0*-NOytvhsyqe9fzlv.png" alt=""/><img src="https://miro.medium.com/v2/resize:fit:1018/0*hVOACIUN-IEU_vet.png" alt=""/></p> <h1>RAEM2外置传感器版本实物图</h1> <p><img src="https://miro.medium.com/v2/resize:fit:824/0*tiWrRyykm2Jgemnw.png" alt=""/><img src="https://miro.medium.com/v2/resize:fit:650/0*Zb5-pSBio4Dutix7.png" alt=""/><img src="https://miro.medium.com/v2/resize:fit:896/0*_EngK960zLfv1QUB.png" alt=""/></p> <h1>RK3588边缘计算网关</h1> <p>Lora版本RAEM2搭载RK3588边缘计算网关,通过内置的人工智能算法,可以在本地执行机器学习算法,减轻云端服务器的压力,提高数据处理效率,通过智能网关的连接,实现高效协同工作的广泛互联互通。</p> <p>智能边缘计算网关具备AI功能,包括:AI参数模式识别、AI波形模式识别、AI网格定位识别。网格定位需要配套M1–6等有高精度同步时钟的采集器。</p> <p><img src="https://miro.medium.com/v2/resize:fit:1400/0*Zz8sHYOjs0XiDjkB.jpg" alt=""/><img src="https://miro.medium.com/v2/resize:fit:1400/0*WFS66ziyXyovj_CI.jpg" alt=""/><img src="https://miro.medium.com/v2/resize:fit:1400/0*W5rAn3hRJcIew-8M.jpg" alt=""/></p> <p><strong>硬件技术参数表</strong></p> <p>通道组合单通道信号输入采集方式连续采集模式、间隔采集模式、定时采集模式(注:Lora版本只有间隔采集模式)输入频率10KHz-400KHz采样精度16位采样率可选200k/s,500k/s,1000k/s,2000k/s系统噪声(幅度)内置传感器优于40dB,外置传感器优于30dB传感器150KHz(60KHz-400KHz)/40KHz(15KHz-70kHz)可选前置放大器供电输出28V40dB/12V34dB/5V26dB数字滤波器128阶,0kKz-1000kHz任意可调(滤波范围与采样率有关,最大为采样率的1/2数据输出参数(幅度,RMS,功率,ASL)、波形(注:Lora版本暂不支持发波形数据)通讯方式4G/LoRa,RS485(注:可定制其他的通讯方式,如WiFi,Zigbee,网口,USB3.0等)4G支持频段LTE-FDD:B1/B3/B5/B8<br/>LTE-TDD:B34/B38/B39/B40/B41手机巡检蓝牙蓝牙最远通讯距离范围(米)无遮挡物区域内最远13.0m使用温度-20℃~+60℃供电方式多种方式可选:</p> <p>1、 外部8.4VDC供电<br/>2、 内置充电电池([email protected])<br/>3、 内置低自放电率的锂亚电池([email protected],不可充电)充电电压8.4V防护等级IP65采样长度(us)2000Ksps:500us~15000us<br/>1000Ksps: 1000us~30000us<br/>500Ksps:2000~60000us<br/>200Ksps:5000~150000us触发方式时间触发动态范围内置传感器60dB,外置传感器70dB最大信号100dB定时采集休眠时间精度±1min (注:Lora版本:3min)定时采集模式电池寿命每天唤醒1次,每次1秒钟的情况下最大可工作:理论下3年(使用使用7000mAh锂亚电池)、理论下1年(使用3000mAh充电电池)连续采集模式电池寿命15h(使用充电电池)、24h(使用锂亚电池)尺寸直径φ60mm,高度105mm(含150k传感器不含天线);高度117mm(含40k传感器不含天线)<br/>外置传感器:直径φ60mm,高度105mm(不含天线)重量(含电池、磁铁、天线)<500g备注:Lora网关参数信息仅供Lora版本RAEM2声发射系统参考Lora网关理论最大连接RAEM2设备数量200台Lora网关最远通讯距离空旷无遮挡的海平面最远10kmLora网关入网方式有线以太网、wifi、4GLora网关工作频率EU433、CN470–510、 CN779–787、 EU863–870、 US902–928、 AU915–928、AS923、 KR920–923电源输入支持9~15V宽电压直流电源输入工作温度-20℃~70℃工作湿度0%~95%(不结露)尺寸157*125*28mm(不含接口和外置天线)</p> <h1>蓝牙巡检APP软件</h1> <ul><li><strong>远程配置:</strong>参数在线设置、远程控制设备启停、定时参数配置。(注:采样间隔最小200ms)</li></ul> <p><img src="https://miro.medium.com/v2/resize:fit:1400/0*_c1F5kUVos6Ru3Dy.jpg" alt=""/></p> <ul><li><strong>实时/历史参数、波形数据显示。</strong>参数:可选幅度、平均信号电平、功率、RMS。(注:Lora版本暂不支持发波形数据)</li></ul> <p><img src="https://miro.medium.com/v2/resize:fit:1400/0*sGF9hmDr_1gnT_i4.jpg" alt=""/></p> <h1>云平台选择</h1> <p>清诚物联网云平台、阿里云平台、亚马逊云平台等,可根据客户具体需求具体定制,如客户的私有云平台。</p> <p><img src="https://miro.medium.com/v2/resize:fit:1400/0*4Qb6bL22OeEZ6ZvX.jpg" alt=""/></p> <h1>清诚云</h1> <p>用户登录清诚云,可实时查看设备状态信息,实时/历史数据,参数远程配置,评级判据设置,评级结果显示,告警场景设置,告警推送联系方式添加,有邮箱和短信报警推送。</p> <ul><li><strong>远程配置:</strong>包括参数配置(如采样速率、采样长度、采样次数、采样间隔)、滤波配置、定时配置等,远程实现固件升级,免人工现场维护。</li></ul> <p><img src="https://miro.medium.com/v2/resize:fit:1400/0*4pXjKqkdJ3kFGkGK.jpg" alt=""/></p> <ul><li><strong>远程查看实时/历史数据:</strong>实时查看监测数据,可对任意时间段的历史数据进行调阅查询。<br/><strong>AE特征参数:</strong>幅度、平均信号电平、功率、RMS。</li></ul> <p><img src="https://miro.medium.com/v2/resize:fit:1400/0*14V5CqsKtxukDUls.jpg" alt=""/></p> <ul><li>注:数据可以根据用户要求上传到用户指定的私有云平台。</li><li><strong>数据下载:</strong>数据格式为CSV格式或我司的参数文件或波形文件(.PRA和.AED)格式。</li></ul> <p><img src="https://miro.medium.com/v2/resize:fit:1400/0*BmYmHMuPNATevPEQ.jpg" alt=""/><img src="https://miro.medium.com/v2/resize:fit:1400/0*SBol-Oxx1kNJJTVS.jpg" alt=""/></p> <h1>3、解决方案</h1> <h1>1、厂区阀门泄漏、跑冒滴漏点监测</h1> <p>化工厂区内存在大量的输送管道,常伴随着高温高压,原料、中间产物、成品在输送过程中容易发生液体跑冒滴漏,气体无组织泄露,存在着人员中毒和漏爆的风险。</p> <p><strong>原理:</strong><br/>阀门管道在长期使用的过程中,由于阀门密封体损坏、阀门密封槽堵塞和阀门部件老化、阀门管道缺乏定期维护和维修,导致出现阀门管道出现泄漏现象,随着阀门裂纹进一步扩展,密封面裂口增大,气体或液体在裂口处因压力差喷射而出形成紊流,紊流中的介质与介质密封表面产生冲击和摩擦产生连续型信号。</p> <p>RAEM2声发射系统接收、分析阀门管道泄漏过程中产生的声波信号,判断阀门泄漏状况,通过Lora组网,传输到RK3588主机进行边缘计算或直接通过lora网关透传到各类云平台实时远程监测阀门状态。</p> <p>注:可定制其他的通讯方式,如WiFi,Zigbee,网口,USB3.0等。</p> <p><img src="https://miro.medium.com/v2/resize:fit:1400/0*2FGbidKeisQMplhp.jpg" alt=""/><img src="https://miro.medium.com/v2/resize:fit:896/0*5nSWGvVzQhHa9qgd.jpg" alt=""/><img src="https://miro.medium.com/v2/resize:fit:896/0*IbSruL4bG09qN44i.jpg" alt=""/></p> <h1>2、厂区转动设备(电动机,轴承等)的磨损、润滑状态监测</h1> <p><strong>原理:</strong><br/>当轴承发生磨损,润滑剂污染劣化等故障时,随着轴承的旋转,轴承内的滚动体与内外圈相互碰撞时产生的声波信号,参数中的有效电压(RMS)或能量出现不规则和高峰值的特点,RAEM2声发射系统接收、分析转动设备在运行过程中产生的声波信号,判断转动设备的润滑情况,通过Lora组网,传输到边缘计算网关RK3588进行边缘计算或直接通过lora网关透传到各类云平台实时远程监测阀门状态。</p> <p>注:可定制其他的通讯方式,如WiFi,Zigbee,网口,USB3.0等。</p> <p><img src="https://miro.medium.com/v2/resize:fit:1400/0*JF2LIdozoHP_pzIO.jpg" alt=""/><img src="https://miro.medium.com/v2/resize:fit:1400/0*q0inHsUg8O4dpElj.jpg" alt=""/></p> <h1>4、配置清单</h1> <p><strong>lora组网RAEM2监测系统配置清单</strong></p> <p>序号名称详细信息价格1RAEM2采集器分析处理传感器采集的声波信号 2传感器150KHz(60KHz-400KHz)/40KHz(15KHz-70kHz)可选 3RK3588边缘计算网关数据接收和转发,执行机器学习算法,减轻云端服务器的压力,提高数据处理效率 4蓝牙巡检APP实现巡检、点检功能 5清诚云平台实时远程监测可视化平台</p> <p> <br/> <br/></p> </html> |
| json metadata | {"tags":["qawrums"],"image":["https://miro.medium.com/v2/resize:fit:1400/0*JDigGpyYrm8e5RWw.jpg","https://miro.medium.com/v2/resize:fit:1400/0*Pm9-KJo-wZk0qdjL.jpg","https://miro.medium.com/v2/resize:fit:1400/0*8pjg27RPG509MR_3.jpg","https://miro.medium.com/v2/resize:fit:1400/0*I7b3sVv9lDhVvxR2.jpg","https://miro.medium.com/v2/resize:fit:816/0*ER3H8Gq-w0EAbHDI.png","https://miro.medium.com/v2/resize:fit:686/0*-NOytvhsyqe9fzlv.png","https://miro.medium.com/v2/resize:fit:1018/0*hVOACIUN-IEU_vet.png","https://miro.medium.com/v2/resize:fit:824/0*tiWrRyykm2Jgemnw.png","https://miro.medium.com/v2/resize:fit:650/0*Zb5-pSBio4Dutix7.png","https://miro.medium.com/v2/resize:fit:896/0*_EngK960zLfv1QUB.png","https://miro.medium.com/v2/resize:fit:1400/0*Zz8sHYOjs0XiDjkB.jpg","https://miro.medium.com/v2/resize:fit:1400/0*WFS66ziyXyovj_CI.jpg","https://miro.medium.com/v2/resize:fit:1400/0*W5rAn3hRJcIew-8M.jpg","https://miro.medium.com/v2/resize:fit:1400/0*_c1F5kUVos6Ru3Dy.jpg","https://miro.medium.com/v2/resize:fit:1400/0*sGF9hmDr_1gnT_i4.jpg","https://miro.medium.com/v2/resize:fit:1400/0*4Qb6bL22OeEZ6ZvX.jpg","https://miro.medium.com/v2/resize:fit:1400/0*4pXjKqkdJ3kFGkGK.jpg","https://miro.medium.com/v2/resize:fit:1400/0*14V5CqsKtxukDUls.jpg","https://miro.medium.com/v2/resize:fit:1400/0*BmYmHMuPNATevPEQ.jpg","https://miro.medium.com/v2/resize:fit:1400/0*SBol-Oxx1kNJJTVS.jpg","https://miro.medium.com/v2/resize:fit:1400/0*2FGbidKeisQMplhp.jpg","https://miro.medium.com/v2/resize:fit:896/0*5nSWGvVzQhHa9qgd.jpg","https://miro.medium.com/v2/resize:fit:896/0*IbSruL4bG09qN44i.jpg","https://miro.medium.com/v2/resize:fit:1400/0*JF2LIdozoHP_pzIO.jpg","https://miro.medium.com/v2/resize:fit:1400/0*q0inHsUg8O4dpElj.jpg"],"links":["https://www.ae-ndt.com/"],"app":"steemit/0.2","format":"html"} |
| parent author | |
| parent permlink | qawrums |
| permlink | raem2lora |
| title | RAEM2Lora组网的应用系统解决方案 |
| Transaction Info | Block #91711901/Trx bdc5e9a413704e6bcf81d5b357b0bef268110c40 |
View Raw JSON Data
{
"block": 91711901,
"op": [
"comment",
{
"author": "barrylee",
"body": "<html>\n<p>1、lora组网的RAEM2监测系统</p>\n<p>lora通讯方式组网,具有低功耗、远距离,能穿透建筑物,信号覆盖范围广的优势,通常用于部署大规模、分散的传感器网络。</p>\n<h1>lora通讯组网实现低功耗远距离传输</h1>\n<p><strong>原理:</strong><br/><a href=\"https://www.ae-ndt.com/\">RAEM2</a>通过lora通讯方式组网,信号传输到边缘计算网关RK3588进行边缘计算,或直接通过lora网关透传到各类云平台,实现远程数据监测和参数远程配置。</p>\n<p>注:可定制其他的通讯方式,如WiFi,Zigbee,网口,USB3.0等。</p>\n<p>lora组网<a href=\"https://www.ae-ndt.com/\">RAEM2监测系统</a>组成: RAEM2采集器、RK3588边缘计算网关、云平台、蓝牙巡检APP。</p>\n<p><img src=\"https://miro.medium.com/v2/resize:fit:1400/0*JDigGpyYrm8e5RWw.jpg\" alt=\"\"/></p>\n<h1>过程可视化</h1>\n<ul><li>365天在线监测,物联网远程操作使用,结合机器学习算法实时分析处理,满足快速响应的需求,提高数据处理效率,手机蓝牙巡检APP实现巡检。</li><li>自动给出检测监测诊断结果</li><li>在线和历史数据屏幕显示</li><li>AI机器学习算法高效处理数据</li><li>对厂区阀门泄露、跑冒滴点、转动设备(电动机,轴承等)的磨损、润滑状态进行可视化监测</li></ul>\n<p><img src=\"https://miro.medium.com/v2/resize:fit:1400/0*Pm9-KJo-wZk0qdjL.jpg\" alt=\"\"/></p>\n<h1>快速部署安装</h1>\n<p><strong>非侵入设计,无需布线和电源,实现设备快速部署安装</strong></p>\n<ul><li>①<a href=\"https://www.ae-ndt.com/\">RAEM2内置声发射传感器</a>版本<br/>将RAEM2采集器底部涂上耦合剂,直接安装在被测物表面,转动设备安装在轴承的固定位置(轴承座),确保底部与打磨掉漆后的被测物表面耦合良好,边缘计算网关RK3588放置在安装现场指定位置的设备安放箱。</li><li>②RAEM2外置声发射传感器版本<br/>传感器底部涂耦合剂后安装在被测物表面,转动设备安装在轴承的固定位置(轴承座),耦合剂采用真空脂,利用磁夹具辅助安装,确保传感器与被测面耦合良好;传感器输出端接入同轴电缆(具体长度根据现场确定),按照现场安装要求,通过线管或线槽,走线至指定RAEM2采集器安装位置,RAEM2采集器、边缘计算网关RK3588布置在安放箱内。</li></ul>\n<h1>应用范围</h1>\n<p>厂区阀门泄漏监测、跑冒滴漏点监测(难于或不能接近环境下的检测同样适用如高低温、核辐射、易燃、易爆极毒等环境),转动设备(电动机,轴承等)的磨损、润滑状态监测。</p>\n<p><img src=\"https://miro.medium.com/v2/resize:fit:1400/0*8pjg27RPG509MR_3.jpg\" alt=\"\"/><img src=\"https://miro.medium.com/v2/resize:fit:1400/0*I7b3sVv9lDhVvxR2.jpg\" alt=\"\"/></p>\n<h1>2、软硬件介绍</h1>\n<h1>硬件介绍</h1>\n<p>RAEM2是一款一体化状态监测系统,将声发射传感器、电池、数据采集模块和通信模块内置在一个小型铝合金圆柱体外壳中,其底部内置有磁铁,可以磁吸在铁磁性材料物体表面,时间触发采集,RAEM2按照休眠时间自动唤醒采集数据,不依赖电脑具有高可靠性,适用于长期连续无人值守的状态监测,具备蓝牙短距离巡检功能,物联网云平台用于远程数据监控和参数配置。</p>\n<h1>RAEM2内置传感器版本实物图</h1>\n<p><img src=\"https://miro.medium.com/v2/resize:fit:816/0*ER3H8Gq-w0EAbHDI.png\" alt=\"\"/><img src=\"https://miro.medium.com/v2/resize:fit:686/0*-NOytvhsyqe9fzlv.png\" alt=\"\"/><img src=\"https://miro.medium.com/v2/resize:fit:1018/0*hVOACIUN-IEU_vet.png\" alt=\"\"/></p>\n<h1>RAEM2外置传感器版本实物图</h1>\n<p><img src=\"https://miro.medium.com/v2/resize:fit:824/0*tiWrRyykm2Jgemnw.png\" alt=\"\"/><img src=\"https://miro.medium.com/v2/resize:fit:650/0*Zb5-pSBio4Dutix7.png\" alt=\"\"/><img src=\"https://miro.medium.com/v2/resize:fit:896/0*_EngK960zLfv1QUB.png\" alt=\"\"/></p>\n<h1>RK3588边缘计算网关</h1>\n<p>Lora版本RAEM2搭载RK3588边缘计算网关,通过内置的人工智能算法,可以在本地执行机器学习算法,减轻云端服务器的压力,提高数据处理效率,通过智能网关的连接,实现高效协同工作的广泛互联互通。</p>\n<p>智能边缘计算网关具备AI功能,包括:AI参数模式识别、AI波形模式识别、AI网格定位识别。网格定位需要配套M1–6等有高精度同步时钟的采集器。</p>\n<p><img src=\"https://miro.medium.com/v2/resize:fit:1400/0*Zz8sHYOjs0XiDjkB.jpg\" alt=\"\"/><img src=\"https://miro.medium.com/v2/resize:fit:1400/0*WFS66ziyXyovj_CI.jpg\" alt=\"\"/><img src=\"https://miro.medium.com/v2/resize:fit:1400/0*W5rAn3hRJcIew-8M.jpg\" alt=\"\"/></p>\n<p><strong>硬件技术参数表</strong></p>\n<p>通道组合单通道信号输入采集方式连续采集模式、间隔采集模式、定时采集模式(注:Lora版本只有间隔采集模式)输入频率10KHz-400KHz采样精度16位采样率可选200k/s,500k/s,1000k/s,2000k/s系统噪声(幅度)内置传感器优于40dB,外置传感器优于30dB传感器150KHz(60KHz-400KHz)/40KHz(15KHz-70kHz)可选前置放大器供电输出28V40dB/12V34dB/5V26dB数字滤波器128阶,0kKz-1000kHz任意可调(滤波范围与采样率有关,最大为采样率的1/2数据输出参数(幅度,RMS,功率,ASL)、波形(注:Lora版本暂不支持发波形数据)通讯方式4G/LoRa,RS485(注:可定制其他的通讯方式,如WiFi,Zigbee,网口,USB3.0等)4G支持频段LTE-FDD:B1/B3/B5/B8<br/>LTE-TDD:B34/B38/B39/B40/B41手机巡检蓝牙蓝牙最远通讯距离范围(米)无遮挡物区域内最远13.0m使用温度-20℃~+60℃供电方式多种方式可选:</p>\n<p>1、 外部8.4VDC供电<br/>2、 内置充电电池([email protected])<br/>3、 内置低自放电率的锂亚电池([email protected],不可充电)充电电压8.4V防护等级IP65采样长度(us)2000Ksps:500us~15000us<br/>1000Ksps: 1000us~30000us<br/>500Ksps:2000~60000us<br/>200Ksps:5000~150000us触发方式时间触发动态范围内置传感器60dB,外置传感器70dB最大信号100dB定时采集休眠时间精度±1min (注:Lora版本:3min)定时采集模式电池寿命每天唤醒1次,每次1秒钟的情况下最大可工作:理论下3年(使用使用7000mAh锂亚电池)、理论下1年(使用3000mAh充电电池)连续采集模式电池寿命15h(使用充电电池)、24h(使用锂亚电池)尺寸直径φ60mm,高度105mm(含150k传感器不含天线);高度117mm(含40k传感器不含天线)<br/>外置传感器:直径φ60mm,高度105mm(不含天线)重量(含电池、磁铁、天线)<500g备注:Lora网关参数信息仅供Lora版本RAEM2声发射系统参考Lora网关理论最大连接RAEM2设备数量200台Lora网关最远通讯距离空旷无遮挡的海平面最远10kmLora网关入网方式有线以太网、wifi、4GLora网关工作频率EU433、CN470–510、 CN779–787、 EU863–870、 US902–928、 AU915–928、AS923、 KR920–923电源输入支持9~15V宽电压直流电源输入工作温度-20℃~70℃工作湿度0%~95%(不结露)尺寸157*125*28mm(不含接口和外置天线)</p>\n<h1>蓝牙巡检APP软件</h1>\n<ul><li><strong>远程配置:</strong>参数在线设置、远程控制设备启停、定时参数配置。(注:采样间隔最小200ms)</li></ul>\n<p><img src=\"https://miro.medium.com/v2/resize:fit:1400/0*_c1F5kUVos6Ru3Dy.jpg\" alt=\"\"/></p>\n<ul><li><strong>实时/历史参数、波形数据显示。</strong>参数:可选幅度、平均信号电平、功率、RMS。(注:Lora版本暂不支持发波形数据)</li></ul>\n<p><img src=\"https://miro.medium.com/v2/resize:fit:1400/0*sGF9hmDr_1gnT_i4.jpg\" alt=\"\"/></p>\n<h1>云平台选择</h1>\n<p>清诚物联网云平台、阿里云平台、亚马逊云平台等,可根据客户具体需求具体定制,如客户的私有云平台。</p>\n<p><img src=\"https://miro.medium.com/v2/resize:fit:1400/0*4Qb6bL22OeEZ6ZvX.jpg\" alt=\"\"/></p>\n<h1>清诚云</h1>\n<p>用户登录清诚云,可实时查看设备状态信息,实时/历史数据,参数远程配置,评级判据设置,评级结果显示,告警场景设置,告警推送联系方式添加,有邮箱和短信报警推送。</p>\n<ul><li><strong>远程配置:</strong>包括参数配置(如采样速率、采样长度、采样次数、采样间隔)、滤波配置、定时配置等,远程实现固件升级,免人工现场维护。</li></ul>\n<p><img src=\"https://miro.medium.com/v2/resize:fit:1400/0*4pXjKqkdJ3kFGkGK.jpg\" alt=\"\"/></p>\n<ul><li><strong>远程查看实时/历史数据:</strong>实时查看监测数据,可对任意时间段的历史数据进行调阅查询。<br/><strong>AE特征参数:</strong>幅度、平均信号电平、功率、RMS。</li></ul>\n<p><img src=\"https://miro.medium.com/v2/resize:fit:1400/0*14V5CqsKtxukDUls.jpg\" alt=\"\"/></p>\n<ul><li>注:数据可以根据用户要求上传到用户指定的私有云平台。</li><li><strong>数据下载:</strong>数据格式为CSV格式或我司的参数文件或波形文件(.PRA和.AED)格式。</li></ul>\n<p><img src=\"https://miro.medium.com/v2/resize:fit:1400/0*BmYmHMuPNATevPEQ.jpg\" alt=\"\"/><img src=\"https://miro.medium.com/v2/resize:fit:1400/0*SBol-Oxx1kNJJTVS.jpg\" alt=\"\"/></p>\n<h1>3、解决方案</h1>\n<h1>1、厂区阀门泄漏、跑冒滴漏点监测</h1>\n<p>化工厂区内存在大量的输送管道,常伴随着高温高压,原料、中间产物、成品在输送过程中容易发生液体跑冒滴漏,气体无组织泄露,存在着人员中毒和漏爆的风险。</p>\n<p><strong>原理:</strong><br/>阀门管道在长期使用的过程中,由于阀门密封体损坏、阀门密封槽堵塞和阀门部件老化、阀门管道缺乏定期维护和维修,导致出现阀门管道出现泄漏现象,随着阀门裂纹进一步扩展,密封面裂口增大,气体或液体在裂口处因压力差喷射而出形成紊流,紊流中的介质与介质密封表面产生冲击和摩擦产生连续型信号。</p>\n<p>RAEM2声发射系统接收、分析阀门管道泄漏过程中产生的声波信号,判断阀门泄漏状况,通过Lora组网,传输到RK3588主机进行边缘计算或直接通过lora网关透传到各类云平台实时远程监测阀门状态。</p>\n<p>注:可定制其他的通讯方式,如WiFi,Zigbee,网口,USB3.0等。</p>\n<p><img src=\"https://miro.medium.com/v2/resize:fit:1400/0*2FGbidKeisQMplhp.jpg\" alt=\"\"/><img src=\"https://miro.medium.com/v2/resize:fit:896/0*5nSWGvVzQhHa9qgd.jpg\" alt=\"\"/><img src=\"https://miro.medium.com/v2/resize:fit:896/0*IbSruL4bG09qN44i.jpg\" alt=\"\"/></p>\n<h1>2、厂区转动设备(电动机,轴承等)的磨损、润滑状态监测</h1>\n<p><strong>原理:</strong><br/>当轴承发生磨损,润滑剂污染劣化等故障时,随着轴承的旋转,轴承内的滚动体与内外圈相互碰撞时产生的声波信号,参数中的有效电压(RMS)或能量出现不规则和高峰值的特点,RAEM2声发射系统接收、分析转动设备在运行过程中产生的声波信号,判断转动设备的润滑情况,通过Lora组网,传输到边缘计算网关RK3588进行边缘计算或直接通过lora网关透传到各类云平台实时远程监测阀门状态。</p>\n<p>注:可定制其他的通讯方式,如WiFi,Zigbee,网口,USB3.0等。</p>\n<p><img src=\"https://miro.medium.com/v2/resize:fit:1400/0*JF2LIdozoHP_pzIO.jpg\" alt=\"\"/><img src=\"https://miro.medium.com/v2/resize:fit:1400/0*q0inHsUg8O4dpElj.jpg\" alt=\"\"/></p>\n<h1>4、配置清单</h1>\n<p><strong>lora组网RAEM2监测系统配置清单</strong></p>\n<p>序号名称详细信息价格1RAEM2采集器分析处理传感器采集的声波信号 2传感器150KHz(60KHz-400KHz)/40KHz(15KHz-70kHz)可选 3RK3588边缘计算网关数据接收和转发,执行机器学习算法,减轻云端服务器的压力,提高数据处理效率 4蓝牙巡检APP实现巡检、点检功能 5清诚云平台实时远程监测可视化平台</p>\n<p>\r<br/>\r<br/></p>\n</html>",
"json_metadata": "{\"tags\":[\"qawrums\"],\"image\":[\"https://miro.medium.com/v2/resize:fit:1400/0*JDigGpyYrm8e5RWw.jpg\",\"https://miro.medium.com/v2/resize:fit:1400/0*Pm9-KJo-wZk0qdjL.jpg\",\"https://miro.medium.com/v2/resize:fit:1400/0*8pjg27RPG509MR_3.jpg\",\"https://miro.medium.com/v2/resize:fit:1400/0*I7b3sVv9lDhVvxR2.jpg\",\"https://miro.medium.com/v2/resize:fit:816/0*ER3H8Gq-w0EAbHDI.png\",\"https://miro.medium.com/v2/resize:fit:686/0*-NOytvhsyqe9fzlv.png\",\"https://miro.medium.com/v2/resize:fit:1018/0*hVOACIUN-IEU_vet.png\",\"https://miro.medium.com/v2/resize:fit:824/0*tiWrRyykm2Jgemnw.png\",\"https://miro.medium.com/v2/resize:fit:650/0*Zb5-pSBio4Dutix7.png\",\"https://miro.medium.com/v2/resize:fit:896/0*_EngK960zLfv1QUB.png\",\"https://miro.medium.com/v2/resize:fit:1400/0*Zz8sHYOjs0XiDjkB.jpg\",\"https://miro.medium.com/v2/resize:fit:1400/0*WFS66ziyXyovj_CI.jpg\",\"https://miro.medium.com/v2/resize:fit:1400/0*W5rAn3hRJcIew-8M.jpg\",\"https://miro.medium.com/v2/resize:fit:1400/0*_c1F5kUVos6Ru3Dy.jpg\",\"https://miro.medium.com/v2/resize:fit:1400/0*sGF9hmDr_1gnT_i4.jpg\",\"https://miro.medium.com/v2/resize:fit:1400/0*4Qb6bL22OeEZ6ZvX.jpg\",\"https://miro.medium.com/v2/resize:fit:1400/0*4pXjKqkdJ3kFGkGK.jpg\",\"https://miro.medium.com/v2/resize:fit:1400/0*14V5CqsKtxukDUls.jpg\",\"https://miro.medium.com/v2/resize:fit:1400/0*BmYmHMuPNATevPEQ.jpg\",\"https://miro.medium.com/v2/resize:fit:1400/0*SBol-Oxx1kNJJTVS.jpg\",\"https://miro.medium.com/v2/resize:fit:1400/0*2FGbidKeisQMplhp.jpg\",\"https://miro.medium.com/v2/resize:fit:896/0*5nSWGvVzQhHa9qgd.jpg\",\"https://miro.medium.com/v2/resize:fit:896/0*IbSruL4bG09qN44i.jpg\",\"https://miro.medium.com/v2/resize:fit:1400/0*JF2LIdozoHP_pzIO.jpg\",\"https://miro.medium.com/v2/resize:fit:1400/0*q0inHsUg8O4dpElj.jpg\"],\"links\":[\"https://www.ae-ndt.com/\"],\"app\":\"steemit/0.2\",\"format\":\"html\"}",
"parent_author": "",
"parent_permlink": "qawrums",
"permlink": "raem2lora",
"title": "RAEM2Lora组网的应用系统解决方案"
}
],
"op_in_trx": 0,
"timestamp": "2024-12-31T12:43:57",
"trx_id": "bdc5e9a413704e6bcf81d5b357b0bef268110c40",
"trx_in_block": 0,
"virtual_op": 0
}barryleepublished a new post: raem2-user-s-manual-operation-guide-qawrums-ltd2024/12/27 05:41:06
barryleepublished a new post: raem2-user-s-manual-operation-guide-qawrums-ltd
2024/12/27 05:41:06
| author | barrylee |
| body | <html> <p> <br/>Qawrums Ltd — RAEM2 USER’S MANUAL Operation Guide</p> <p>RAEM 2 Acoustic Wave (<a href="https://www.blogger.com/blog/post/edit/4846769717482021329/3339670695828179779#">Acoustic Emission</a>) Monitoring System, RAEM2 is an all-in-one condition monitoring system, combining acoustic emission (AE) sensor, battery, data acquisition and process module and communication modules in a small aluminium alloy cylinder.</p> <p><img src="https://miro.medium.com/v2/resize:fit:1400/1*VTYdzYB0gOoTmD-kiD6KWw.png" alt=""/></p> <p>V1.2.0</p> <p>2024/12/20</p> <p>Table of Content</p> <p><a href="https://www.blogger.com/blog/post/edit/4846769717482021329/3339670695828179779#">1. Technical Background</a></p> <p><a href="https://www.blogger.com/blog/post/edit/4846769717482021329/3339670695828179779#">1.1. Acoustic Emission Technology Introduction</a></p> <p><a href="https://www.blogger.com/blog/post/edit/4846769717482021329/3339670695828179779#">1.2. Main Purpose of Acoustic Emission Testing</a></p> <p><a href="https://www.blogger.com/blog/post/edit/4846769717482021329/3339670695828179779#">1.3. Characteristics of Acoustic Emission Testing</a></p> <p><a href="https://www.blogger.com/blog/post/edit/4846769717482021329/3339670695828179779#">1.4. Applications of Acoustic Emission Technology</a></p> <p><a href="https://www.blogger.com/blog/post/edit/4846769717482021329/3339670695828179779#">1.5. Key Terms of Acoustic Emission Technology</a></p> <p><a href="https://www.blogger.com/blog/post/edit/4846769717482021329/3339670695828179779#">1.6. Key Terms in RAEM2 System</a></p> <p><a href="https://www.blogger.com/blog/post/edit/4846769717482021329/3339670695828179779#">2. Product Introduction</a></p> <p><a href="https://www.blogger.com/blog/post/edit/4846769717482021329/3339670695828179779#">2.1. Hardware Introduction</a></p> <p><a href="https://www.blogger.com/blog/post/edit/4846769717482021329/3339670695828179779#">2.2. RAEM2 Technical Specifications</a></p> <p><a href="https://www.blogger.com/blog/post/edit/4846769717482021329/3339670695828179779#">3. Quick Operation Guide</a></p> <p><a href="https://www.blogger.com/blog/post/edit/4846769717482021329/3339670695828179779#">3.1. Quick Operation Steps</a></p> <p><a href="https://www.blogger.com/blog/post/edit/4846769717482021329/3339670695828179779#">3.2. Operation Notes</a></p> <p><a href="https://www.blogger.com/blog/post/edit/4846769717482021329/3339670695828179779#">3.2.1. RAEM2 States</a></p> <p><a href="https://www.blogger.com/blog/post/edit/4846769717482021329/3339670695828179779#">3.2.2. RAEM2 Modifications</a></p> <p><a href="https://www.blogger.com/blog/post/edit/4846769717482021329/3339670695828179779#">3.2.3. RAEM2 Controls</a></p> <p><a href="https://www.blogger.com/blog/post/edit/4846769717482021329/3339670695828179779#">3.2.4. Special Case Handling</a></p> <p><a href="https://www.blogger.com/blog/post/edit/4846769717482021329/3339670695828179779#">4. Local Inspection Through Bluetooth</a></p> <p><a href="https://www.blogger.com/blog/post/edit/4846769717482021329/3339670695828179779#">4.1. Bluetooth Connection</a></p> <p><a href="https://www.blogger.com/blog/post/edit/4846769717482021329/3339670695828179779#">4.2. AST Test</a></p> <p><a href="https://www.blogger.com/blog/post/edit/4846769717482021329/3339670695828179779#">4.3. AE Parameter Configuration</a></p> <p><a href="https://www.blogger.com/blog/post/edit/4846769717482021329/3339670695828179779#">4.4. AE Timing Setup</a></p> <p><a href="https://www.blogger.com/blog/post/edit/4846769717482021329/3339670695828179779#">4.5. Refresh Configuration</a></p> <p><a href="https://www.blogger.com/blog/post/edit/4846769717482021329/3339670695828179779#">4.6. Parameters</a></p> <p><a href="https://www.blogger.com/blog/post/edit/4846769717482021329/3339670695828179779#">4.7. Language Switch/Send Data to Cloud</a></p> <p><a href="https://www.blogger.com/blog/post/edit/4846769717482021329/3339670695828179779#">5. Qingcheng IoT Gateway</a></p> <p><a href="https://www.blogger.com/blog/post/edit/4846769717482021329/3339670695828179779#">5.1. Gateway Configuration</a></p> <p><a href="https://www.blogger.com/blog/post/edit/4846769717482021329/3339670695828179779#">5.1.1. Basic Config</a></p> <p><a href="https://www.blogger.com/blog/post/edit/4846769717482021329/3339670695828179779#">5.1.2. Sub Devices</a></p> <p><a href="https://www.blogger.com/blog/post/edit/4846769717482021329/3339670695828179779#">5.1.3. APN Config</a></p> <p><a href="https://www.blogger.com/blog/post/edit/4846769717482021329/3339670695828179779#">6. Qingcheng IoT Cloud Platform</a></p> <p><a href="https://www.blogger.com/blog/post/edit/4846769717482021329/3339670695828179779#">6.1. IoT Product</a></p> <p><a href="https://www.blogger.com/blog/post/edit/4846769717482021329/3339670695828179779#">6.1.1. Device Groups</a></p> <p><a href="https://www.blogger.com/blog/post/edit/4846769717482021329/3339670695828179779#">6.1.2. Devices</a></p> <p><a href="https://www.blogger.com/blog/post/edit/4846769717482021329/3339670695828179779#">6.1.3. Gateway Configuration Page</a></p> <p><a href="https://www.blogger.com/blog/post/edit/4846769717482021329/3339670695828179779#">6.1.4. Device Configuration Page</a></p> <p><a href="https://www.blogger.com/blog/post/edit/4846769717482021329/3339670695828179779#">6.2. IoT Data</a></p> <p><a href="https://www.blogger.com/blog/post/edit/4846769717482021329/3339670695828179779#">6.2.1. AE Data</a></p> <p><a href="https://www.blogger.com/blog/post/edit/4846769717482021329/3339670695828179779#">6.2.2. Correlogram</a></p> <p><a href="https://www.blogger.com/blog/post/edit/4846769717482021329/3339670695828179779#">6.3. IoT Tool</a></p> <p><a href="https://www.blogger.com/blog/post/edit/4846769717482021329/3339670695828179779#">6.3.1. AST Function</a></p> <h1>1. Technical Background</h1> <h1>1.1. Acoustic Emission Technology Introduction</h1> <p>Acoustic emission (AE) is the phenomenon of transient elastic waves generated by the rapid release of energy from local sources in materials, sometimes also known as stress wave emission. The acoustic emission testing technology is the acoustic detection method by receiving and analyzing the acoustic emission signals to evaluate the material performances or structural integrity. The deformation and crack propagation of materials under stress are important mechanisms of structural failure. The source directly related to deformation and fracture mechanism is called acoustic emission source.</p> <p>The principle of acoustic emission detection is shown in Figure 1–1. The elastic waves emitted from the acoustic emission source finally propagate to the surface of the material, causing the surface displacement that can be detected by the acoustic emission sensor. The sensor converts the mechanical vibration of the material into an electrical signal, which is then amplified, processed, and recorded. By analyzing and inferring the recorded acoustic emission signals, the mechanism of the acoustic emission of the material is understood.</p> <p><img src="https://miro.medium.com/v2/resize:fit:1400/1*DN4Z2vbG5bmLGFwrBg63OA.png" alt=""/></p> <p>Fig. 1–1 Block diagram of acoustic emission testing principle</p> <h1>1.2. Main Purpose of Acoustic Emission Testing</h1> <p>l Locate the acoustic emission source.</p> <p>l Analyze the properties of the acoustic emission source.</p> <p>l Determine the time and load of the AE occurrence.</p> <p>l Assess the severity of the acoustic emission source.</p> <h1>1.3. Characteristics of Acoustic Emission Testing</h1> <p>The discovery of each acoustic emission source indicates the application of AE system. The AE testing method is different from other conventional NDT methods in many aspects:</p> <p>l It is a dynamic detection method. The detected energy comes from the object itself, not from the detection instrument.</p> <p>l It is sensitive to linear defects and can detect the movement of the defects under external structural stress.</p> <p>l It can detect and evaluate the state of the defects in the whole structure.</p> <p>l The system can provide real-time or continuous information of the defects changing with the external variables, such as load.</p> <p>l The requirement of approaching the detected objects is not high.</p> <p>l It can be used for inspection of pressure vessels in service.</p> <p>l When used in pressure tests of pressure vessels, it can prevent catastrophic failure of the inspected object caused by unknown discontinuous defects and limit its maximum working pressure.</p> <p>l It is suitable for object detection with complex geometry.</p> <p>By finding the hidden defects, even in some unreachable parts of the structure, the spread of the damages can be prevented. That is the main purpose of the AE detection/monitoring.</p> <h1>1.4. Applications of Acoustic Emission Technology</h1> <p>Currently acoustic emission technology has been applied in many fields, including the following aspects:</p> <p>l The petrochemical industry</p> <p>l The power industry</p> <p>l Material test</p> <p>l Civil Engineering</p> <p>l The aerospace and aviation industry</p> <p>l Metal Process</p> <p>l The transportation industry</p> <p>Main application of RAEM2:</p> <p>l Steady state acoustic emission signal acquisition. Once the steady state signal is generated, it will not disappear, such as bearing wear, pipeline valve leakage, tool wear, etc.</p> <p>l Time parameters RMS, ASL, power, applicable to fault diagnosis, condition monitoring and other steady state acoustic emission signal monitoring and detection;</p> <p>l Interval sampling mode or continuous sampling mode can be set according to application requirements, and the change of parameters over time is the main criteria of the judgement of the faults;</p> <p>l Low power consumption, suitable for long-term monitoring of applications without external power supply, the use of lithium-ion battery power supply can work for up to 3 years (Interval sampling mode with wake up once a day, 1 second each time);</p> <p>l Typical applications: fault diagnosis and monitoring of rotating machinery (bearings, tool machining, gear boxes, etc.), wear, lubrication state, etc. Leakage monitoring of pipes, valves and containers; Damage monitoring of continuous damage signals, such as serious damage of wind turbine blades.</p> <p><img src="https://miro.medium.com/v2/resize:fit:1400/1*l0jAC4ZGhMLsNfT8UgRcDA.png" alt=""/></p> <p>Fig. 1–2 Block diagram of RAEM2 monitoring system</p> <h1>1.5. Key Terms of Acoustic Emission Technology</h1> <p>(1) Starting point of AE signal: the starting point of an AE signal recognized by the system processor, is usually when the amplitude begins to exceed the threshold.</p> <p>(2) End point of AE signal: the end point of the AE signal, which is usually defined as the last time that the signal amplitude crosses the threshold.</p> <p>(3) Duration: the time interval between the beginning and the end of the acoustic emission signal.</p> <p>(4) Rise time: the time interval between the starting point of AE signal and the peak of the AE signal.</p> <p>(5) Sensor array: a combination of two or more sensors placed on a component to detect and determine the position of the source in the array.</p> <p>(6) Attenuation: the decrease of the AE amplitude per unit distance, usually expressed in dB per unit distance.</p> <p>(7) Average Signal Level (ASL): the time average logarithmic value of the acoustic emission signal after rectification. The amplitude of the acoustic emission signal is measured in logarithmic scale, in unit of dB. At the input of the pre-amplifiers, 0dB = 1μV.</p> <p>(8) RMS: Root mean square. The effective average value of the signal amplitude, in unit of V.</p> <p>(9) Channel: a complete acoustic emission channel consists of a sensor, a pre-amplifier or an impedance matching transformer, a filter, a secondary amplifier, a connection cable and a signal detector or processor.</p> <p>(10) Counts: also known as ring-down counts. In the selected detection interval, the number of times the AE signal crosses the present threshold.</p> <p>(11) Event: a local material change giving rise to acoustic emission.</p> <p>(12) Event count: the number of events that can be detected by the AE instrument.</p> <p>(13) Couplant: the material filled between the contact surface of the sensor and test structure, which can improve the ability of sound power passing through the interface in the process of acoustic emission monitoring.</p> <p>(14) Decibel (dB): logarithmic measurement value of AE signal amplitude referring to 1μV, dB = 20lg(A/1μV), where A is the amplitude voltage value of the measured AE signal.</p> <p>(15) Dynamic range: the decibel difference between the overload level and the minimum signal level (usually determined by one or more factors in the noise level, low-level distortion, interference, or resolution level) in a system or sensor.</p> <p>(16) Effective sound velocity: the sound velocity calculated based on arrival time and distance determined by the artificial acoustic emission signal, for the use of source location.</p> <p>(17) Burst acoustic emission: the qualitative description of the discrete signals related to an independent acoustic emission event in the material.</p> <p>(18) Continuous acoustic emission: the qualitative description of the continuous signal level produced by the rapid occurrence of acoustic emission events.</p> <p>(19) Energy: elastic energy released by acoustic emission events.</p> <p>(20) Threshold: the threshold value for monitoring the triggered AE signal.</p> <p>(21) Monitoring area: part of the structure monitored by AE sensors.</p> <p>(22) Detection range: the part of the test object evaluated by acoustic emission technology.</p> <p>(23) Felicity effect: the presence of AE at stress levels below the maximum previously experienced.</p> <p>(24) Felicity ratio: the ratio of the stress at presence to the maximum stress applied last time.</p> <p>(25) Floating threshold: a dynamic threshold established by the time average of the amplitude of the input signal.</p> <p>(26) Hit: any signal that exceeds the threshold and causes a system channel to collect data.</p> <p>(27) Kaiser effect: under a fixed sensitivity, there is no detectable AE signal before the stress level is exceeded.</p> <h1>1.6. Key Terms in RAEM2 System</h1> <p>(1) Sampling rate: also known as sampling speed, the number of sampling points per second of analog voltage signal acquired by the ADC module; for example, 10MSPS, means 10M (=106) points per second.</p> <p>(2) Sampling accuracy: the sampling accuracy determines the minimum resolution of the signal within the input voltage range. For example, in the 20Vpp input range, the 16-bit sampling accuracy means that the voltage of 20V is divided into 216 units, i.e., the step is about 0.305 mV. The higher the accuracy, the higher the resolution of the signal.</p> <p>(3) AST: automatic sensor testing, which refers to the technology that the sensor transmits a mechanical pulse signal under a voltage excitation, and it is received by the adjacent sensors to evaluate the sensitivity of adjacent sensors.</p> <p>(4) ADC: analog to digital conversion, i.e., analog voltage signal is converted into digital signal.</p> <p>(5) Analog filter: filter applied in the analog circuit. The product uses 4th order Butterworth analog filter before ADC.</p> <p>(6) Pre-amplifier: amplifies the weak voltage signal output from the sensor and applies impedance transformation, to adapt to the electronic amplification circuit for long-distance signal transmission, and outputs analog signals.</p> <p>(7) IoT: Internet of Things.</p> <p>(8) Sampling Mode (LoRa version RAEM2): the default mode is “Passive”. RAEM2 devices do not actively send data to the gateway. It is the gateway requires data from RAEM2 and RAEM2 replies with data. When multiple RAEM2 devices are transmitting data, RAEM2 send in sequence according to their designated numbers. (When a gateway corresponds to multiple RAEM2s, sending data from two or more RAEM2s simultaneously may cause interference issues)</p> <p>(9) Sampling interval:The interval stop time after each acquisition of a fixed-length signal, in microseconds (μs). The fixed length signal is collected again after the time is up.</p> <p>(10) Sampling length:The length of each sample, in microseconds (μs), is a set length of signal collected each time.</p> <p>(11) Sampling time:The number of times a fixed-length signal is collected.</p> <p>(12) Sampling state:Select sample start or stop. Indicates the current sampling state of the device.</p> <p>(13) Interval sampling mode: that is, after sampling for a period of time, suspend sampling for a period of time, and then resume sampling for a period of time, and the cycle is repeated.</p> <p>NOTE: Sleep time of Timing Sampling Type: The accuracy of the sleep time is ±3 minutes. Starting from the modification of the sleep time, if it is changed to 30 minutes, the first timing of the device will start from the current AE timing configuration time for 30 minutes (the device needs to interact with the gateway for about 3–4 minutes, so there is a deviation of 3–4 minutes in time). The more sub devices in the gateway, the greater the time deviation.</p> <p>(14) System clock (s): System clock, in seconds. The display format is YYYY-MM-DD HH:MM:SS.</p> <h1>2. Product Introduction</h1> <p>RAEM2 system combines acoustic emission sensor, battery, data acquisition and processing module and communication module in a small aluminum alloy cylinder. With some magnets at the bottom base, RAEM2 can be attracted to and coupled on the metal object surface. It not only supports various communication methods to the IoT Cloud, for instance 4G, or LoRa, but also supports local inspection through Bluetooth. The cloud platform can be used for remote data monitoring and dual-direction transmission and configurations. There are a variety of output ports and data communication methods available to choose based on the applications.</p> <p>The system is triggered by time. RAEM2 is suitable for long-term continuous unattended automatic data acquisition, processing and output. It can output amplitude, ASL, power, RMS, as well as waveform of the acoustic wave signal (The LoRa version of RAEM2 does not support sending waveform data).</p> <p>As of the date this document is written, the latest Bluetooth inspection software is V1.2.19. The Bluetooth APP is for short range local inspection purpose to quickly test the RAEM2.</p> <p>Bluetooth APP download address:<a href="https://www.blogger.com/blog/post/edit/4846769717482021329/3339670695828179779#">https://www.iot.ae-ndt.com/download/bleApp/ble1_2_19.apk</a></p> <p>There are currently two versions of RAEM2, 4G version and LoRa version respectively. The difference of the two versions is the long distance communication method to the Qingcheng Cloud Platform. All the rest of the two versions of RAEM2 are the same.</p> <p>RAEM2 (4G version) consists of 3 parts:</p> <p>l RAEM2 (AE sensor, signal acquisition and processing, data communication)</p> <p>l Cloud platform (cloud server, Bluetooth inspection software)</p> <p>l Client terminal (mobile phone, PC)</p> <p>RAEM2 (LoRa version) consists of 4 parts:</p> <p>l RAEM2 (AE sensor, signal acquisition and processing, data communication)</p> <p>l LoRa gateway</p> <p>l Cloud platform (cloud server, Bluetooth inspection software)</p> <p>l Client terminal (mobile phone, PC)</p> <p>RAEM2 main body is an aluminum alloy shell small cylinder. Inside there are data acquisition and processing modules, Bluetooth module and communication module.</p> <p>Time trigger acquisition is suitable for all kinds of continuous AE signal acquisition. After the scheduled sleep time is set, the device periodically starts and stops the sampling based on the schedule.</p> <p>The output data types include parameter (amplitude, RMS, power, ASL) and waveform data (LoRa version doesn’t support waveform), which can be uploaded to the cloud platform for display and analysis (Qingcheng Cloud platform, etc.), and the Bluetooth inspection APP developed by QingCheng can be used for locally inspection.</p> <p>RAEM2 currently does not have rating function. After data is uploaded to the cloud, it can be downloaded via the cloud platform in Excel format (simply click the “Download (To CSV)” to complete the download).</p> <h1>2.1. Hardware Introduction</h1> <p><img src="https://miro.medium.com/v2/resize:fit:1400/1*f3S3WUQ9sI42tavUB5h9MA.png" alt=""/></p> <p>Fig. 2–1 Diagram of RAEM2 system</p> <p>Figure 2–2 shows a basic hardware package of RAEM2, which includes a small RAEM2 cylinder with a magnetic base, a Bluetooth external antenna, a 4G/LoRa external antenna, a LoRa gateway kit (LoRa version of RAEM2 only) and 8.4V power charger.</p> <p>For the sensor replacement and installation flexibility, we make two types of RAEM2 cylinder, one with built-in integral sensor and the other type with external integral sensor. Customers can choose the built-in type or external type cylinder based on their testing requirements.</p> <p>RAEM2 with Internal Sensor</p> <p>OR</p> <p>RAEM2 with External Sensor</p> <p>8.4V Power Charger</p> <p>Bluetooth Antenna</p> <p>4G/LoRa Antenna</p> <ul><li>LoRa Gateway & its Accessories (LoRa version only)</li></ul> <p>RAEM2 with Internal Sensor</p> <p>OR</p> <p>RAEM2 with External Sensor</p> <p>8.4V Power Charger</p> <p>Bluetooth Antenna</p> <p>4G/LoRa Antenna</p> <ul><li>LoRa Gateway & its Accessories (LoRa version only)</li></ul> <p><img src="https://miro.medium.com/v2/resize:fit:940/1*406Po0mZF_Amb-4s54bFxA.png" alt=""/></p> <p>Fig. 2–2 RAEM2 with Internal Sensor Hardware Package</p> <p><img src="https://miro.medium.com/v2/resize:fit:1062/1*GHYABn48rMQ28P1rne-1ZQ.png" alt=""/><img src="https://miro.medium.com/v2/resize:fit:1098/1*jijGQUL5po_zLiDO6YXyVg.png" alt=""/></p> <p>Figure 2–3 and Figure 2–4 show the RAEM2 exterior and function introductions.</p> <p>u (Power) Switch: power switch ti turn the RAEM2 power on or off;</p> <p>u LED Indicators:</p> <p>n Power Indicator (Green LED): Indicates the power on or off state. After the power switch turns on, the power indicator is solidly green;</p> <p>n Status Indicator (Blue LED):</p> <p>[1] Sampling status: blue light is flashing quickly;</p> <p>[2] Stop sampling: blue light turns off;</p> <p>[3] Sending data: The blue light blinks slowly;</p> <p>u Charging Port/ Power Interface: the connector to plug in the charger to recharge the battery inside RAEM2;</p> <p>u Bluetooth antenna port: connects to Bluetooth antenna;</p> <p>u 4G/LoRa antenna port: Connects to 4G/LoRa antenna;</p> <p>u Magnetic Base: both internal sensor and external sensor types have the magnetic base;</p> <p>u Built-in Sensor: in the version of RAEM2 with internal sensor, the sensor is located at the center of the bottom surface.</p> <p>u AST: Auto sensor testing function is to test the RAEM2 sensitivity and coupling status. The small pop-out round object is the additional sensor to send out the elastic mechanical AE waves and the built-in sensor receives the waves to get the result data. AST function is only available in the sensor built-in version.</p> <p>u Sensor Interface: in the version of RAEM2 with external sensor, use the coaxial cable to connect the external sensor to the sensor interface of the RAEM2.</p> <p>RAEM2 with internal sensor:</p> <p>Fig. 2–3 RAEM2 Exterior with Built-in Sensor</p> <p><img src="https://miro.medium.com/v2/resize:fit:796/1*AZBW_jE0L2G-5wVIYosr4g.png" alt=""/><img src="https://miro.medium.com/v2/resize:fit:1214/1*KHy4sypMmpGR5_ZUdjhRCw.png" alt=""/></p> <p>RAEM2 with external sensor:</p> <p>Fig. 2–4 RAEM2 Exterior with External Sensor</p> <p>LoRa gateway:</p> <p>A single LoRa gateway can connect to up to 200 RAEM2 devices. The maximum communication range in an open, unobstructed environment is 10 km.</p> <p><img src="https://miro.medium.com/v2/resize:fit:1400/1*RREA2jWdfL8m0ud0WurIdA.png" alt=""/></p> <p>Fig. 2–5 LoRa Gateway</p> <h1>2.2. RAEM2 Technical Specifications</h1> <p>RAEM2</p> <p>Channel</p> <p>Single-channel</p> <p>Sampling Mode</p> <p>Interval sampling mode, Scheduled sampling mode and Continuous sampling mode</p> <p>(LoRa version RAEM2 only has timing sampling mode)</p> <p>Input Frequency</p> <p>10kHz-400KHz</p> <p>Sampling Accuracy</p> <p>16-bit</p> <p>Sampling Rate</p> <p>Optional 200k/s, 500k/s, 1000k/s, 2000k/s</p> <p>System Noise (Amplitude)</p> <p>Better than 40dB with built-in sensor</p> <p>Better than 30dB with external sensor</p> <p>Sensor</p> <p>Sensor resonant frequency at 150kHz (60kHz~400kHz) or 40kHz (15kHz~70kHz)</p> <p>Preamplifier Supply Voltage</p> <p>28V40dB / 12V34dB / 5V26dB</p> <p>Digital Filter</p> <p>128-order, free to set the low-pass, high-pass and band-pass filters from 0kHz to 1000kHz<br/><em>(The filter range is related to the sampling rate; the maximum frequency ≤ ½ sampling rate)</em></p> <p>Data Output</p> <p>Parameters (Amplitude, RMS, power, ASL), waveform<br/><em>(LoRa version doesn’t support waveform)</em></p> <p>Communication Modes</p> <p>4G or LoRa, RS485</p> <p>4G Supported Frequency Bands</p> <p>LTE-FDD:B1/B3/B5/B8</p> <p>LTE-TDD:B34/B38/B39/B40/B41</p> <p>On-site Inspection</p> <p>Bluetooth</p> <p>Bluetooth Range</p> <p>13 meters</p> <p>Operation Temperature</p> <p>-20℃ to 60℃</p> <p>Power Supply Mode</p> <p>There are various options available:</p> <p>1. External 8.4V DC power supply</p> <p>2. Internal rechargeable battery <a href="https://www.blogger.com/blog/post/edit/4846769717482021329/3339670695828179779#">([email protected])</a></p> <p>3. Built-in lithium-ion battery with low self-discharge rate ([email protected], non-rechargeable)</p> <p>Charging Voltage</p> <p>8.4V</p> <p>Protection Degree</p> <p>IP65</p> <p>Sampling Length (µs)</p> <p>At different sampling rates:</p> <p>2000Ksps:500us~15000us</p> <p>1000Ksps: 1000us~30000us</p> <p>500Ksps:2000us~60000us</p> <p>200Ksps:5000us~150000us</p> <p>Trigger Mode</p> <p>Time trigger</p> <p>Dynamic Range</p> <p>Built-in sensor version: 60dB</p> <p>External sensor version: 70dB</p> <p>Maximum Amplitude</p> <p>100 dB</p> <p>Timing Acquisition Mode Hibernation Time Accuracy</p> <p>±1min (LoRa version: ±3min)</p> <p>Timing Acquisition Mode Battery Life</p> <p>Theoretical measurement: once per day for 1 second:</p> <p>- 3 years (7000mAh Lithium-ion battery);</p> <p>- recharge every 3 months (3000mAh Rechargeable battery)</p> <p>Continuous Sampling Mode Battery Life</p> <p>15 hours (Rechargeable battery);</p> <p>24 hours (non-chargeable battery)</p> <p>Dimension<br/>(without antenna)</p> <p>Φ60mm diameter, height 105mm (with 150kHz sensor) / height 117mm (with 40kHz sensor)</p> <p>External sensor type: Φ60mm diameter, height 105mm</p> <p>Weight (including battery, magnet, antenna)</p> <p><500g</p> <p>LoRa Gateway</p> <p>Theoretical Maximum Number of RAEM2 Supported by a LoRa Gateway</p> <p>200</p> <p>Theoretical Maximum communication distance by a LoRa Gateway</p> <p>Up to 10 km at open area</p> <p>Communication method</p> <p>Ethernet cable, 4G</p> <p>Working frequency</p> <p>EU433, CN470–510, CN779–787, EU863–870, US902–928, AU915–928, AS923, KR920–923</p> <p>Table 2–1 RAEM2 Technical Specifications</p> <h1>3. Quick Operation Guide</h1> <h1>3.1. Quick Operation Steps</h1> <p><img src="https://miro.medium.com/v2/resize:fit:1400/1*8VRCUIlR_tcoe-t83uYCAg.png" alt=""/></p> <p>1. Finish the hardware connections of RAEM2:</p> <p>RAEM2 with internal sensor</p> <p>RAEM2 with external sensor</p> <p>Just need to connect the Bluetooth antenna and the 4G/LoRa antenna. (<em>see Figure 2–3</em>)</p> <p>① connect the Bluetooth antenna and the 4G/LoRa antenna;</p> <p>② Connect the external sensor to the “Sensor” port of RAEM2 using the coaxial cable A. (<em>see Figure 2–4</em>)</p> <p>LoRa Version</p> <p>Connect the LoRa gateway with the power adaptor to power and the Ethernet cable to gateway. Connect the antennas based on needs. The WiFi of the gateway is for gateway configuration only. For the control and data transmission of the gateway to RAEM2 it is suggested to use Ethernet (primary) or 4GB (contact us for instructions). (<em>See Figure 2–5</em>)</p> <p>4G Version</p> <p>Please contact us for detail 4G Data SIM card installation instructions.</p> <p>2.</p> <p>Power on the RAEM2 device first by pressing down the power switch button on the top surface of RAEM2. Then for LoRa version, power on the gateway by connecting it to the 12V/36W power adaptor.</p> <p>3. First time LoRa gateway connection and configuration: connect the computer to the gateway’s WiFi network (qc-gw-xxx) for the gateway configurations purpose only. The default password is 88888888. Open a browser and enter the URL <a href="https://www.blogger.com/blog/post/edit/4846769717482021329/3339670695828179779#">http://192.168.1.1/</a> to access the Qingcheng IoT Gateway page and add the desired RAEM2 devices to the gateway (see Chapter 5: Qingcheng IoT Gateway). <em>The RAEM2 devices should have been added to the gateway when going out from the factory</em>.</p> <p>4. For daily remote controls and data accessing, use Qingcheng IoT Cloud Platform. Open a browser and visit <a href="https://www.blogger.com/blog/post/edit/4846769717482021329/3339670695828179779#">http://cloud.ae-ndt.com/</a>, then log in to the Qingcheng IoT Cloud Platform using your account credentials ( detail operations refer to Chapter 6: Qingcheng IoT Cloud Platform).</p> <p>5. For short distance local inspection, connect RAEM2 to your smartphone Bluetooth APP. See Chapter 4 for details.</p> <h1>3.2. Operation Notes</h1> <h1>3.2.1. RAEM2 States</h1> <p>In the Qingcheng Cloud Platform, RAEM2 has three states: Wake up, Sleep, and Offline.</p> <p>· Sleep: The RAEM2 device can be in either the Wake up or Sleep state. (Note: RAEM2 has a very short online acquisition time. After the collection is complete, it enters sleep mode. So the state will mostly display Sleep. After pressing the Wake up button, the cloud platform status will display Wake Up.)</p> <p>· Wake up: Click the Wake up button. Once RAEM2 successfully awakened, the device state changes to Wake up. Otherwise, if the RAEM2 cannot wake up and display Offline, it means the RAEM2 is in special condition (see Offline state). This button can be used to confirm whether the RAEM2 device is in a special condition or not.</p> <p>·</p> <p>Offline: The RAEM2 device is not controlled by the gateway or the RAEM2 battery is dead.</p> <h1>3.2.2. RAEM2 Modifications</h1> <p>Configuration Modifications for single RAEM2 on Qingcheng IoT Cloud Platform (Parameter Configuration, Filter Configuration, Timing Configuration — see Chapter 6 for details):</p> <p>(1) Navigate to the Gateway Configuration page with the following steps: IoT Products → Devices, select the QCGW in the Product, and click Search → find the row of the desired gateway “qc_gw_xxx” and in the Action column and select Device Action.</p> <p>(2) Click Manual Control Sub Device button to release the gateway’s control over the RAEM2 device (wait until a message pop up in the top-right corner indicating “Gw Stop [OK]”).</p> <p>(3) In the RAEM2 device number column, click Device Action to enter the Device Configuration page for RAEM2.</p> <p>(4)</p> <p>Modify configurations: Click AE Parameter Config to make changes. After completing the modifications, click Submit and wait for 3–4 minutes until a success message appears in the top-right corner indicating the configuration has been successfully updated. Then, click Refresh Page.</p> <p>Configuration Modifications for a batch of RAEM2 on the Qingcheng IoT Cloud Platform (Parameter Configuration, Filter Configuration, Timing Configuration):</p> <p>1. Steps (1), (2), and (3) are identical to those in the section “Configuration Modifications for single RAEM2 on Qingcheng IoT Cloud Platform (Parameter Configuration, Filter Configuration, Timing Configuration).”</p> <p>2. Configuration Modifications:</p> <p>o Click AE Parameter Config to make the necessary changes.</p> <p>o After completing the modifications, click Copy Device Config, select the RAEM2 devices requiring batch configuration updates, and click Submit.</p> <p>o Wait for about 3–4 minutes until a success message appears in the top-right corner, indicating [Edit] AE Parameters/Timing/FFT Configuration [Success]!</p> <p>3. Wait until the success message is displayed in the top-right corner. Then, click Refresh Page.</p> <h1>3.2.3. RAEM2 Controls</h1> <p>Controlling of RAEM2 (Reboot, Wake up, Sleep, AST Test, Start Sampling, Stop Sampling, Refresh Config):</p> <p>1. Navigate to the Gateway Configuration page with the following steps: IoT Products → Devices, select the QCGW in the Product, and click Search → find the row of the desired gateway “qc_gw_xxx” and in the Action column and select Device Action.</p> <p>2. Use Manual Control Sub Device to release the gateway’s control over RAEM2. A message will pop up in the top-right corner indicating Gw stop OK.</p> <p>3. Select the RAEM2 device and perform operations such as Start Sampling, Stop Sampling, or other desired actions.</p> <p>o Wait for3–4 minutes until a notification appears in the top-right corner confirming the operation.</p> <p>o</p> <p>If the notification is missed, check the Device Notice Message section to verify the execution state.</p> <h1>3.2.4. Special Case Handling</h1> <p>Special Case Handling:</p> <p>Ø RAEM2 Displays “Offline”</p> <p>(1) On the Qingcheng IoT Cloud Platform’s Gateway Configuration page, click Manual Control Sub Device, then click Query Sub Device State.</p> <p>(2) If the device still shows Offline, select the offline RAEM2 device and click Wake up. If a message like “-” appears in the top-right corner, it indicates that the RAEM2 is not under gateway control or its battery is dead.</p> <p>(3) Reboot the RAEM2. If the RAEM2 power indicator does not stay green, charge the RAEM2 or replace its battery, then reboot the device again.</p> <p>(4) Repeat steps (1) and (2).</p> <p>Ø Replacing or Adding a New RAEM2</p> <p>(1) Connect to the gateway WiFi network (qc-gw-xxx) with your laptop. Open the Qingcheng IoT Gateway page (<a href="https://www.blogger.com/blog/post/edit/4846769717482021329/3339670695828179779#">http://192.168.1.1/</a> ), log in (no username or password is required by default), and navigate to Configuration Information → Gateway Configuration → Sub Device Management.</p> <p>(2) Update the RAEM2 device number and click Submit. If adding a new RAEM2 device, click Add Device, enter the new RAEM2 device number, and then click Submit.</p> <p>(3) Log in to the Qingcheng IoT Cloud Platform (<a href="https://www.blogger.com/blog/post/edit/4846769717482021329/3339670695828179779#">http://cloud.ae-ndt.com</a>) and add the device (refer to Chapter 6).</p> <p>Ø No Feedback Message Handling Method</p> <p>If there is no feedback message in Device Notice Message after 3–4 minutes for the wake-up or configuration modification operation,</p> <p>(1) click Automatic Control Sub Device, until the message Gw Started [Success!!] appears in Device Notice Message.</p> <p>(2) click Manual Control Sub Device, until the message Gw Stopped [Success!!] appears in Device Notice Message.</p> <p>(3) proceed with the RAEM2 operations.</p> <p>Fig. 3–1 LoRa Gateway Control Page</p> <h1>4.</h1> <h1>Local Inspection Through Bluetooth</h1> <h1>4.1. Bluetooth Connection</h1> <p>Turn on the Bluetooth on the phone. Press the power switch of the RAEM2, and open the APP on your phone, and connect the device as followed:</p> <p>Tap the icon ① to connect to Bluetooth. Tap the icon ② to search for devices. Find the desired device, and tap the icon ③ to connect. Wait for a moment until the device is connected to the APP. When the prompt “Connect Successful…” on the top of the screen is displayed, wait for a period of time. When the prompt “This set of data finish” appears, it indicates that the APP is now completely connected with RAEM2.</p> <p>Common function button:</p> <p>l RefreshConf: Read the latest configuration of RAEM2.</p> <p><img src="https://miro.medium.com/v2/resize:fit:692/1*iQGL8r5wzLrTqQDu_THxRQ.png" alt=""/><img src="https://miro.medium.com/v2/resize:fit:692/1*mpZgOA1Mhoysc_zAmmgzoQ.png" alt=""/><img src="https://miro.medium.com/v2/resize:fit:692/1*DcMYF8PTYMBqPcxs7dA1Yw.png" alt=""/></p> <p>Fig. 4–1 Bluetooth APP Start Interface</p> <h1>4.2.</h1> <h1>AST Test</h1> <p>Click the AST button, click Submit, wait for a period of time, and AST results will appear.</p> <p><img src="https://miro.medium.com/v2/resize:fit:712/1*2B9cPyLKH_BZzwjocEMwbA.png" alt=""/><img src="https://miro.medium.com/v2/resize:fit:700/1*u1wMZC7QPNbMfNXFxpFf-Q.png" alt=""/><img src="https://miro.medium.com/v2/resize:fit:712/1*U1RnH09Q98tuzNha_FNHkg.png" alt=""/></p> <p>Fig. 4–2 Bluetooth AST Function</p> <h1>4.3. AE Parameter Configuration</h1> <p>Click SampleConf to enter the parameter configuration page. You can modify the sampling rate, high-pass filter, low-pass filter, sampling mode, sampling length, sampling times and sampling interval. Click the Submit button when the modification is completed.</p> <p>If the sampling rate is modified to 1000k/s, click Submit and check whether the value is changed (or see if the system time is updated). If the value is changed, the modification is successful. Otherwise, you need to modify it again. The RAEM2 device needs to be rebooted after modification of sampling rate/sampling length/filter range.</p> <p>l Synchronize to Platform: to send the APP configurations to the Qingcheng Cloud Platform so that the configurations can be stored in the cloud platform and reapplied even disconnected from Bluetooth.</p> <p><img src="https://miro.medium.com/v2/resize:fit:712/1*OHKPlbkkp7zZ9ZpyQeu-mg.png" alt=""/><img src="https://miro.medium.com/v2/resize:fit:756/1*K_sn6Ca5Ixkg2Ipr57jM8w.png" alt=""/></p> <p>Fig. 4–3 APP Sample Configuration</p> <h1>4.4. AE Timing Setup</h1> <p>l (4G Version) RAEM2 Timing Setup:</p> <p>Click TimingConf button to open the timing setting page, you can modify the sampling mode. Click Interval button to set the sleep time. Click Submit after the setting is complete.</p> <p>l (LoRa Version) RAEM2 Timing Setup:</p> <p>The latest configuration of RAEM2 is actively retrieved by the LoRa gateway from the cloud. Since the LoRa gateway has not yet implemented the functionality to obtain the sleep time from the Bluetooth app, any changes made via the Bluetooth app cannot take effect. To ensure the settings are successfully applied, it is recommended to modify the sleep time directly on the cloud platform.</p> <p><img src="https://miro.medium.com/v2/resize:fit:712/1*8gD8PUH20auR0Hk-U2mgtA.png" alt=""/><img src="https://miro.medium.com/v2/resize:fit:712/1*QN2OhrIyadoStrsNT9iATw.png" alt=""/></p> <p>Fig. 4–4 APP Timing Configuration</p> <h1>4.5. Refresh Configuration</h1> <p>Click RefreshConf button to refresh the configurations.</p> <p>Fig. 4–5 APP Refresh Configuration</p> <h1>4.6. Parameters</h1> <p>The Parameters page allows you to view real-time or historical parameter data: Real-time data can be viewed by selecting the “Auto Refresh” and “Current Sample” buttons. Historical data can be accessed by selecting a start and end time.</p> <p>Click on the XXX points total buttons (10, 20, 50, 100, 200, 500, 1000) to adjust the scale of the parameter curve display.</p> <p>Clicking on a coordinate point in the graph will display details such as arrival time, amplitude, ASL, power, and RMS parameter values.</p> <p>Fig. 4–6 APP AE Parameters</p> <p>Button Descriptions:</p> <p>l Parameters: Options include amplitude, ASL, power, and RMS.</p> <p>l Pick Date: Allows you to view historical parameter data within a specified time range by selecting a start and end time.</p> <p>l Auto Refresh: Automatically update parameter data in real time.</p> <p>l Current sample: Enable to only display the latest acquisition cycle data. Disable to display all data.</p> <p>l Start sample: starts data sampling of the RAEM2 device.</p> <p>l Stop sample: Stops data sampling of the RAEM2 device.</p> <p>Note: After RAEM2 finishes the last cycle of acquisition, you must click Stop sample before clicking Start sample again.</p> <p>l Delete Data: Delete the selected data.</p> <p>l Save Image: save the current displaying graph as a reference image stored at the bottom of the page.</p> <h1>4.7. Language Switch/Send Data to Cloud</h1> <p>Fig. 4–7 APP Language and Cloud Sync</p> <h1>5. Qingcheng IoT Gateway</h1> <p>First, power on the RAEM2, and then power the gateway. Once the gateway is powered on, it will automatically operate.</p> <p>If the network is functioning properly, the gateway will appear as Online on the Qingcheng IoT Cloud Platform. After approximately 5 minutes, refresh the current page, and the powered-on RAEM2 will display as Sleep.</p> <p>Fig. 5–1 Qingcheng IoT Cloud Platform interface</p> <p>Connect computer or smartphone to the gateway’s WiFi network named qc_gw_xxx (e.g., qc_gw_002). The default network password is 88888888.</p> <p>Fig. 5–2 WiFi Hotspot of Gateway</p> <p>Open a web browser and enter the URL: <a href="https://www.blogger.com/blog/post/edit/4846769717482021329/3339670695828179779#">http://192.168.1.1/</a></p> <p>User name: demo</p> <p>Password: 123456</p> <p>Fig. 5–3 Qingcheng IoT Gateway Login Interface</p> <h1>5.1. Gateway Configuration</h1> <p>After logging in, click Config Info — Gateway Config to modify the gateway’s basic config, manage Sub Devices, and configure APN config.</p> <h1>5.1.1. Basic Config</h1> <p>After entering this page, you can modify the gateway WiFi SSID and password.</p> <p>Fig. 5–4 Qingcheng IoT Gateway Basic Information Page</p> <h1>5.1.2. Sub Devices</h1> <p>Add or remove RAEM2 devices controlled by the current gateway.</p> <p>Operate procedures: Click Add Device. Enter the information of the new RAEM2, then click Submit.</p> <p>❗ Note: Ensure the RAEM2 device number is entered correctly.</p> <p>Fig. 5–5 Qingcheng IoT Gateway Sub-devices Page</p> <h1>5.1.3. APN Config</h1> <p>APN Address (Required): Enter the carrier’s APN address for the gateway to access the network, e.g., cmnet for China Mobile.</p> <p>Auth Type (Required): Enter the APN authentication type provided by the carrier, e.g., “pap”.</p> <p>User (Optional): Provided by the carrier (required when the gateway connects to a private cellular network).</p> <p>Password (Optional): Provided by the carrier (required when the gateway connects to a private cellular network).</p> <p>Fig. 5–6 Qingcheng IoT Gateway APN Configuration</p> <h1>6. Qingcheng IoT Cloud Platform</h1> <p>Qingcheng Internet of Things Cloud Platform is a cloud platform developed for our own IoT acoustic emission products. Customers can log in to the platform to remotely check and modify the device configurations in real time, as well as real-time display of AE waveform, parameters, and the rating levels, alarms, and reports, etc.</p> <p>Log in to the Qingcheng IoT cloud platform (<a href="https://www.blogger.com/blog/post/edit/4846769717482021329/3339670695828179779#">http://cloud.ae-ndt.com</a>) and input the username and password. At present, the cloud platform does not support users to register their own accounts. All account registration needs to be operated through Qingcheng Ltd. Please contact us for user registration and login information.</p> <p>Fig. 6–1 Login interface of QingCheng Cloud Platform</p> <p>After login, you can convert to Chinese/English, change the user interface, and change the password.</p> <p>Fig. 6–2 Basic Profile Menu Example</p> <h1>6.1. IoT Product</h1> <h1>6.1.1. Device Groups</h1> <p>Group the devices to facilitate subsequent management of the devices. You can add groups through the device groups page to manage devices in groups, such as storage tank bottom testing or some localization group testing.</p> <p>The operation is as follows: click [Add], fill in the “Name”, “Parent”, and “Department” information (Note: When creating a new parent, the “Parent” column does not need to be filled in). “Purpose” can be “Default” or “AE Location Analysis”. Choose “Default” in general.</p> <p>Fig. 6–3 Device Group “Add” window</p> <p>Fig. 6–4 Device Group page of Qingcheng IoT cloud platform</p> <p>l Bind Device: Binding devices into this group for group managements.</p> <p>l Bind Alarm scene: After grouping devices and binding alarm scenarios, users can receive alarm information for the grouped devices in this alarm scenario.</p> <h1>6.1.2. Devices</h1> <p>Devices page lists all the IoT AE devices under this account. Users can search for desired devices through different search items, such as SN., Product, Device Group, Product Type, or State to start filtering searches. And the following table lists all devices on the current platform.</p> <p>Fig. 6–5 Device page</p> <p>Click +Add to add a new device.</p> <p>l Series Number: Fill in the device SN. on the product label (required)</p> <p>l Name: User-defined (required)</p> <p>l Channel No.: User-defined (required)</p> <p>l Department: Select the department which the device belongs. (Required)</p> <p>l Product Name: Select the product (required)</p> <p>l Device group: Select group which the newly added device belongs (required)</p> <p>l Data store: Select the server which the data is stored. (Required)</p> <p>l Server Connection: Select the server which the device is connected. (Required)</p> <p>Fig. 6–6 Add Device page</p> <p>After a new device creation, it will show up a new row for the created device. Under the “Action” column on the right, click “Edit” to modify the device information above.</p> <p>Enter the Gateway Configuration page for specific operations: IoT product → Device Select QCGW in Product and click Search → Device Action.</p> <p>Fig. 6–7 Device list page</p> <h1>6.1.3. Gateway Configuration Page</h1> <h2>6.1.3.1. Buttons Associated with Gateway</h2> <p>Auto Control Sub Device: The gateway automatically controls the RAEM2 to wake up for data acquisition and automatically enters sleep mode.</p> <p>Manual Control Sub Device: Disables the gateway’s control over the RAEM2. After disabling the control, the RAEM2’s configuration can be modified (no matter in wake-up or sleep mode), and operations like waking up and AST testing can be performed.</p> <p>Gw Reboot: Reboot the gateway and wait for 3 minutes until gateway successfully reboot.</p> <p>Query Sub Device State: Refresh the RAEM2’s state information (there is no need to click “Manual Control Sub Device” before clicking this button).</p> <p>Device Notice Message: Query the notification messages from the gateway and all RAEM2 devices under it. Press the [Device Notice Message] button to confirm whether the modified configurations or commands executed by the button press have taken effect.</p> <h2>6.1.3.2. Buttons associated with RAEM2 device</h2> <p>[Reboot] [Wake up] [Sleep] [Start Sampling] [Stop Sampling] [AST Test] [Refresh Page]</p> <p>AST Test: Pressing this button will trigger an AST test on the RAEM2. The test results can be viewed on the IoT Data → AE Data page.</p> <p>Refresh Page: Refresh the current page.</p> <p>Fig. 6–8 Gateway configuration page</p> <p>Click the Device Action button in the device number column to enter the RAEM2 Device Configuration page.</p> <h1>6.1.4. Device Configuration Page</h1> <p>Operational Procedures:</p> <p>1) Enter the Gateway Configuration page for specific operations: IoT product → Device Select QCGW and click Search → Device Action.</p> <p>Fig. 6–9 Device list page</p> <p>2) Click Manual Control Sub Device to unlink the gateway’s control over the RAEM2. After a while, a message prompt will pop up in the upper-right corner to show if the gateway stops controls or not. If no messages pop up due to some web page or network reasons, click the “Device Notice Message” button to check all the messages.</p> <p>Fig. 6–10 Manual Control Sub Device</p> <p>3) In the RAEM2 list, click Device Action to go into the RAEM2 Device Configuration page.</p> <p>Fig. 6–11 Gateway configuration page</p> <p>Query State: Query the RAEM2 state information (e.g., whether the current state is sleep, wake up, or offline).</p> <p>Refresh Page: Retrieve the latest configuration information for the RAEM2. It has the same effects as the web page refresh button.</p> <p>Fig. 6–12 Device Configuration Page</p> <p>Ø AE Parameter config</p> <p>· Sampling Rate: The sampling rate refers to the number of samplings points from the analog voltage signal to digital signals per second, measured in thousand per second (k/s), representing the number of sample points per second (e.g., 1000 k/s, or 1 MHz).</p> <p>· Sampling Mode: “Passive Mode” means that the RAEM2 does not actively send data to the gateway. When multiple RAEM2 devices are sending data, they transmit in sequence according to their device number.</p> <p>· Sampling Length: The length of each sample, measured in microseconds (μs), referring to the length of the signal collected each time.</p> <p>· Sampling Times: The number of fixed-length signals collected each time the device is woken up.</p> <p>· Sampling Interval: The interval duration after each fixed-length signal sampling, measured in microseconds (μs). After this interval ends, the system will reinitiate the fixed-length signal sampling.</p> <p>· Enable Sending Parameters: Indicates whether parameters should be sent to the current IoT cloud platform. This is enabled by default.</p> <p>· System Time: The system clock, measured in seconds. The display format is: YYYY-MM-DD HH:MM:SS.</p> <p>· Copy Device Config: Updates the configuration information from the current page to the selected RAEM2 devices (i.e., batch modification of RAEM2 configurations).</p> <p>Ø AE Filter Config</p> <p>· Enable Filter: The filter can be enabled or disabled by toggling the filter enable switch.</p> <p>· High-Pass Filter: High-pass refers to the lower frequency limit in the frequency domain. Signals with a frequency lower than this threshold cannot pass through.</p> <p>· Low-Pass Filter: Low-pass refers to the upper frequency limit in the frequency domain. Signals with a frequency higher than this threshold cannot pass through.</p> <p>· System Time: The system clock, measured in seconds. The display format is: YYYY-MM-DD HH:MM:SS.</p> <p>· Copy Device Config: When devices are selected and submitted, the configuration of the selected devices will be synchronized and updated.</p> <p>Ø AE Timing Config</p> <p>· Timing Sampling Type: After setting the time, the device will automatically enter sleep mode. Once the sleep is complete, the device will automatically wake up to continue sampling.</p> <p>· Sleep Time (s): The shortest timed sleep duration can be set to 3 minutes (i.e., 180 seconds). The timer starts after the device time is modified. For example, if it is set to 30 minutes, the device will begin counting 30 minutes from the time of the current AE timed configuration (Note: The device needs to interact with the gateway for approximately 2–3 minutes, so there may be a 2–3 minutes time deviation).</p> <p>4) Configuration Operational Procedures:(see Figure 6–12)</p> <p>① Click AE Parameter Config / AE Filter Config / AE Timing Config, make the necessary changes;</p> <p>② then click Submit.</p> <p>③ After a short wait, a prompt will appear in the upper-right corner. If you missed the notification message, click Device Notice Message to check it.</p> <p>④ Once confirmed, click Refresh Page to check whether the page parameters have been successfully updated. If not, repeat the above steps.</p> <h1>6.2. IoT Data</h1> <h1>6.2.1. AE Data</h1> <p>AE Data page displays a time chart of a specific parameter change for a certain device. You can access this page by clicking IoT Data → AE Data in the left sidebar of the platform, or by clicking the View Data button on the right side of the Devices page to enter the device’s AE Data page. By default, all parameters are displayed in separate time-related charts.</p> <p>After entering the page, select RAEM2 in the top bar under Product, and choose the device based on the device number under Device. Once completed, click Search.</p> <p>❗Note: Historical data queries can be filtered by selecting the Created At time.</p> <p>Fig. 6–13 Display of Multiple Parameters for RAEM2 Device</p> <p>When the mouse is moved over the line, the corresponding voltage value and time for the horizontal and vertical coordinates will be displayed.</p> <p>Fig. 6–14 Display of AMP Parameter for RAEM2 Device</p> <p>The buttons in the upper right corner in both parameter graphs and waveform graphs are the functions to modify the graphs, which are Regional Zoom In, Regional Zoom Out, Data Table, Line Chart, Bar Chart, Restore, and Save as Image.</p> <p>l Regional Zoom In: Click “Regional Zoom-in” button, then use the mouse to pressure down and drag a rectangle area in the graph. Once releasing the mouse, only the selected area (in time domain) of the graph will be displayed.</p> <p>l Regional Zoom Out: Click “Regional Zoom-out” button, the graph will restored to the previous zooming stage.</p> <p>l Data Table: list all the data points in table list.</p> <p>l Switch to line chart: display data in line chart.</p> <p>l Switch to bar chart: display data in bar chart.</p> <p>l Restore: Restore to default state.</p> <p>l Save as Image: You can save the image to your computer.</p> <p>(1) Data Download Procedure</p> <p>l Download (To CSV): Download the AE data locally in CSV format.</p> <p>Steps: [Product] Select “RAEM1”, [Device] Select the device number that needs to download data, [Creation Time] select the creation time of the data that needs to be downloaded, and click [Download (To CSV)]. In the pop-up window, click “OK” to start the download of data. Once finished, it will show up as a CSV file with all parameters from the selected time frame of the device.</p> <p>l Download (To SWAE): not available for RAEM2.</p> <p>(2) Data deletion operation</p> <p>Click AE Data, select the Product, Device, Created time, click Delete, then you can delete the data of the selected device during this period.</p> <h1>6.2.2. Correlogram</h1> <p>Correlation graph refers to a type of relationship graph that uses two or more acoustic emission parameters as horizontal and vertical coordinates to draw correlation curves, distribution point graphs, line graphs, etc., to characterize acoustic emission signals. It is a major application tool for analyzing parameter data.</p> <p>+ Add Graph: Add additional correlation graph;</p> <p>Save Settings: Save all existing settings, including devices, time frame, points, and all the correlation graphs setup.</p> <p>Restore Settings: Restore all settings previously saved;</p> <p>Points: The maximum number of points displayed in the relevant chart can be selected from 100, 200, 500, 1000, 2000, 5000, 10000, and 20000;</p> <p>Statistics mode: There are two statistical methods to choose from: maximum value and average value;</p> <p>Display mode: includes three display modes: line, bar, or scatter graphs;</p> <p>[X] axis: The X-axis parameters include arrival time, amplitude (AMP) (dB), ASL (dB), energy (KpJ), RMS (mV), duration (us), counts, rise time (us), rise counts, peak frequency (KHz), centroid frequency (KHz), and 5 partial power spectrum segments;</p> <p>[X] Range: Optional [X] Custom or [X] Auto;</p> <p>l [X] Custom: Filter out values that are not within this range based on the maximum and minimum values entered by the user;</p> <p>l [X] Auto: The coordinate display range of the relevant graph will be automatically adjusted according to the data distribution situation;</p> <p>[Y] axis: The Y-axis parameters include amplitude (AMP) (dB), ASL (dB), energy (KpJ), RMS (mV), duration (us), counts, rise time (us), rise counts, peak frequency (KHz), centroid frequency (KHz), and 5 partial power spectrum segments;</p> <p>[Y] Range: Optional [Y] Custom or [Y] Auto;</p> <p>l [Y] Custom: Filter out values that are not within this range based on the maximum and minimum values entered by the user;</p> <p>l [Y] Auto: The coordinate display range of the relevant graph will be automatically adjusted according to the data distribution situation.</p> <p>Operation steps:</p> <p>Select [Product] and [Device] → Select the time frame [Created At] → Select [Points] → [Add Graph] if needed. Select [Statistics Mode] according to specific needs (e.g. Maximum) → Select [Display Mode] → select [X] axis parameter (e.g. Arrival time) → select [X] Range Auto. select [Y] axis parameter → select [Y] Range Auto. → After finish settings, click [Start Statistics] to obtain and display data. If you want to save and restore all these settings later, click [Save Settings] to save and click [Restore Settings] to restore.</p> <p>Fig. 6–15 Correlogram page of the cloud platform</p> <h1>6.3. IoT Tool</h1> <h1>6.3.1. AST Function</h1> <p>AST (Auto Sensor Testing) is to test the RAEM2 sensitivity and coupling status after installation. The function principle is to make the sending sensor (the small pop-out round surface at the bottom of RAEM2) to make a mechanical (elastic) wave which can be propagated through the tested material to the receiver sensor (the internal or external sensor of RAEM2). Based on the received wave amplitude (dB), we can decide how the sensor sensitivity and the coupling status are. AST replaces the manual pencil lead breaking testing and make the remote monitoring available and flexible. But please note that AST test only works when the device has an AST sensor built-in, such as RAEM2, BWM1 series.</p> <p>After the RAEM2 device is woken up and in manual control, the AST test can be performed.</p> <p>① Click on [IoT Tool] → [AST Test].</p> <p>② Select the device that need to be tested, after clicking [Submit].</p> <p>③ Please wait a moment to [Get Result].</p> <p>l Time Interval (s): The interval in seconds for sending the AST test.</p> <p>l Device Group: By checking this option, you can filter devices and only display the devices within the selected group.</p> <p>l Get Result: You can obtain the most recent AST results.</p> <p><img src="https://miro.medium.com/v2/resize:fit:1400/1*k-I5GUtzPci_C5Q7aEjz6Q.png" alt=""/></p> <p>Fig. 6–16 AST page and testing results</p> <p> <br/> <br/></p> </html> |
| json metadata | {"tags":["raem2"],"image":["https://miro.medium.com/v2/resize:fit:1400/1*VTYdzYB0gOoTmD-kiD6KWw.png","https://miro.medium.com/v2/resize:fit:1400/1*DN4Z2vbG5bmLGFwrBg63OA.png","https://miro.medium.com/v2/resize:fit:1400/1*l0jAC4ZGhMLsNfT8UgRcDA.png","https://miro.medium.com/v2/resize:fit:1400/1*f3S3WUQ9sI42tavUB5h9MA.png","https://miro.medium.com/v2/resize:fit:940/1*406Po0mZF_Amb-4s54bFxA.png","https://miro.medium.com/v2/resize:fit:1062/1*GHYABn48rMQ28P1rne-1ZQ.png","https://miro.medium.com/v2/resize:fit:1098/1*jijGQUL5po_zLiDO6YXyVg.png","https://miro.medium.com/v2/resize:fit:796/1*AZBW_jE0L2G-5wVIYosr4g.png","https://miro.medium.com/v2/resize:fit:1214/1*KHy4sypMmpGR5_ZUdjhRCw.png","https://miro.medium.com/v2/resize:fit:1400/1*RREA2jWdfL8m0ud0WurIdA.png","https://miro.medium.com/v2/resize:fit:1400/1*8VRCUIlR_tcoe-t83uYCAg.png","https://miro.medium.com/v2/resize:fit:692/1*iQGL8r5wzLrTqQDu_THxRQ.png","https://miro.medium.com/v2/resize:fit:692/1*mpZgOA1Mhoysc_zAmmgzoQ.png","https://miro.medium.com/v2/resize:fit:692/1*DcMYF8PTYMBqPcxs7dA1Yw.png","https://miro.medium.com/v2/resize:fit:712/1*2B9cPyLKH_BZzwjocEMwbA.png","https://miro.medium.com/v2/resize:fit:700/1*u1wMZC7QPNbMfNXFxpFf-Q.png","https://miro.medium.com/v2/resize:fit:712/1*U1RnH09Q98tuzNha_FNHkg.png","https://miro.medium.com/v2/resize:fit:712/1*OHKPlbkkp7zZ9ZpyQeu-mg.png","https://miro.medium.com/v2/resize:fit:756/1*K_sn6Ca5Ixkg2Ipr57jM8w.png","https://miro.medium.com/v2/resize:fit:712/1*8gD8PUH20auR0Hk-U2mgtA.png","https://miro.medium.com/v2/resize:fit:712/1*QN2OhrIyadoStrsNT9iATw.png","https://miro.medium.com/v2/resize:fit:1400/1*k-I5GUtzPci_C5Q7aEjz6Q.png"],"links":["https://www.blogger.com/blog/post/edit/4846769717482021329/3339670695828179779#"],"app":"steemit/0.2","format":"html"} |
| parent author | |
| parent permlink | raem2 |
| permlink | raem2-user-s-manual-operation-guide-qawrums-ltd |
| title | RAEM2 USER’S MANUAL Operation Guide - Qawrums Ltd |
| Transaction Info | Block #91588549/Trx a321ffe4d92f276017407fa4a1d23af01c947ae6 |
View Raw JSON Data
{
"block": 91588549,
"op": [
"comment",
{
"author": "barrylee",
"body": "<html>\n<p>\r<br/>Qawrums Ltd — RAEM2 USER’S MANUAL Operation Guide</p>\n<p>RAEM 2 Acoustic Wave (<a href=\"https://www.blogger.com/blog/post/edit/4846769717482021329/3339670695828179779#\">Acoustic Emission</a>) Monitoring System, RAEM2 is an all-in-one condition monitoring system, combining acoustic emission (AE) sensor, battery, data acquisition and process module and communication modules in a small aluminium alloy cylinder.</p>\n<p><img src=\"https://miro.medium.com/v2/resize:fit:1400/1*VTYdzYB0gOoTmD-kiD6KWw.png\" alt=\"\"/></p>\n<p>V1.2.0</p>\n<p>2024/12/20</p>\n<p>Table of Content</p>\n<p><a href=\"https://www.blogger.com/blog/post/edit/4846769717482021329/3339670695828179779#\">1. Technical Background</a></p>\n<p><a href=\"https://www.blogger.com/blog/post/edit/4846769717482021329/3339670695828179779#\">1.1. Acoustic Emission Technology Introduction</a></p>\n<p><a href=\"https://www.blogger.com/blog/post/edit/4846769717482021329/3339670695828179779#\">1.2. Main Purpose of Acoustic Emission Testing</a></p>\n<p><a href=\"https://www.blogger.com/blog/post/edit/4846769717482021329/3339670695828179779#\">1.3. Characteristics of Acoustic Emission Testing</a></p>\n<p><a href=\"https://www.blogger.com/blog/post/edit/4846769717482021329/3339670695828179779#\">1.4. Applications of Acoustic Emission Technology</a></p>\n<p><a href=\"https://www.blogger.com/blog/post/edit/4846769717482021329/3339670695828179779#\">1.5. Key Terms of Acoustic Emission Technology</a></p>\n<p><a href=\"https://www.blogger.com/blog/post/edit/4846769717482021329/3339670695828179779#\">1.6. Key Terms in RAEM2 System</a></p>\n<p><a href=\"https://www.blogger.com/blog/post/edit/4846769717482021329/3339670695828179779#\">2. Product Introduction</a></p>\n<p><a href=\"https://www.blogger.com/blog/post/edit/4846769717482021329/3339670695828179779#\">2.1. Hardware Introduction</a></p>\n<p><a href=\"https://www.blogger.com/blog/post/edit/4846769717482021329/3339670695828179779#\">2.2. RAEM2 Technical Specifications</a></p>\n<p><a href=\"https://www.blogger.com/blog/post/edit/4846769717482021329/3339670695828179779#\">3. Quick Operation Guide</a></p>\n<p><a href=\"https://www.blogger.com/blog/post/edit/4846769717482021329/3339670695828179779#\">3.1. Quick Operation Steps</a></p>\n<p><a href=\"https://www.blogger.com/blog/post/edit/4846769717482021329/3339670695828179779#\">3.2. Operation Notes</a></p>\n<p><a href=\"https://www.blogger.com/blog/post/edit/4846769717482021329/3339670695828179779#\">3.2.1. RAEM2 States</a></p>\n<p><a href=\"https://www.blogger.com/blog/post/edit/4846769717482021329/3339670695828179779#\">3.2.2. RAEM2 Modifications</a></p>\n<p><a href=\"https://www.blogger.com/blog/post/edit/4846769717482021329/3339670695828179779#\">3.2.3. RAEM2 Controls</a></p>\n<p><a href=\"https://www.blogger.com/blog/post/edit/4846769717482021329/3339670695828179779#\">3.2.4. Special Case Handling</a></p>\n<p><a href=\"https://www.blogger.com/blog/post/edit/4846769717482021329/3339670695828179779#\">4. Local Inspection Through Bluetooth</a></p>\n<p><a href=\"https://www.blogger.com/blog/post/edit/4846769717482021329/3339670695828179779#\">4.1. Bluetooth Connection</a></p>\n<p><a href=\"https://www.blogger.com/blog/post/edit/4846769717482021329/3339670695828179779#\">4.2. AST Test</a></p>\n<p><a href=\"https://www.blogger.com/blog/post/edit/4846769717482021329/3339670695828179779#\">4.3. AE Parameter Configuration</a></p>\n<p><a href=\"https://www.blogger.com/blog/post/edit/4846769717482021329/3339670695828179779#\">4.4. AE Timing Setup</a></p>\n<p><a href=\"https://www.blogger.com/blog/post/edit/4846769717482021329/3339670695828179779#\">4.5. Refresh Configuration</a></p>\n<p><a href=\"https://www.blogger.com/blog/post/edit/4846769717482021329/3339670695828179779#\">4.6. Parameters</a></p>\n<p><a href=\"https://www.blogger.com/blog/post/edit/4846769717482021329/3339670695828179779#\">4.7. Language Switch/Send Data to Cloud</a></p>\n<p><a href=\"https://www.blogger.com/blog/post/edit/4846769717482021329/3339670695828179779#\">5. Qingcheng IoT Gateway</a></p>\n<p><a href=\"https://www.blogger.com/blog/post/edit/4846769717482021329/3339670695828179779#\">5.1. Gateway Configuration</a></p>\n<p><a href=\"https://www.blogger.com/blog/post/edit/4846769717482021329/3339670695828179779#\">5.1.1. Basic Config</a></p>\n<p><a href=\"https://www.blogger.com/blog/post/edit/4846769717482021329/3339670695828179779#\">5.1.2. Sub Devices</a></p>\n<p><a href=\"https://www.blogger.com/blog/post/edit/4846769717482021329/3339670695828179779#\">5.1.3. APN Config</a></p>\n<p><a href=\"https://www.blogger.com/blog/post/edit/4846769717482021329/3339670695828179779#\">6. Qingcheng IoT Cloud Platform</a></p>\n<p><a href=\"https://www.blogger.com/blog/post/edit/4846769717482021329/3339670695828179779#\">6.1. IoT Product</a></p>\n<p><a href=\"https://www.blogger.com/blog/post/edit/4846769717482021329/3339670695828179779#\">6.1.1. Device Groups</a></p>\n<p><a href=\"https://www.blogger.com/blog/post/edit/4846769717482021329/3339670695828179779#\">6.1.2. Devices</a></p>\n<p><a href=\"https://www.blogger.com/blog/post/edit/4846769717482021329/3339670695828179779#\">6.1.3. Gateway Configuration Page</a></p>\n<p><a href=\"https://www.blogger.com/blog/post/edit/4846769717482021329/3339670695828179779#\">6.1.4. Device Configuration Page</a></p>\n<p><a href=\"https://www.blogger.com/blog/post/edit/4846769717482021329/3339670695828179779#\">6.2. IoT Data</a></p>\n<p><a href=\"https://www.blogger.com/blog/post/edit/4846769717482021329/3339670695828179779#\">6.2.1. AE Data</a></p>\n<p><a href=\"https://www.blogger.com/blog/post/edit/4846769717482021329/3339670695828179779#\">6.2.2. Correlogram</a></p>\n<p><a href=\"https://www.blogger.com/blog/post/edit/4846769717482021329/3339670695828179779#\">6.3. IoT Tool</a></p>\n<p><a href=\"https://www.blogger.com/blog/post/edit/4846769717482021329/3339670695828179779#\">6.3.1. AST Function</a></p>\n<h1>1. Technical Background</h1>\n<h1>1.1. Acoustic Emission Technology Introduction</h1>\n<p>Acoustic emission (AE) is the phenomenon of transient elastic waves generated by the rapid release of energy from local sources in materials, sometimes also known as stress wave emission. The acoustic emission testing technology is the acoustic detection method by receiving and analyzing the acoustic emission signals to evaluate the material performances or structural integrity. The deformation and crack propagation of materials under stress are important mechanisms of structural failure. The source directly related to deformation and fracture mechanism is called acoustic emission source.</p>\n<p>The principle of acoustic emission detection is shown in Figure 1–1. The elastic waves emitted from the acoustic emission source finally propagate to the surface of the material, causing the surface displacement that can be detected by the acoustic emission sensor. The sensor converts the mechanical vibration of the material into an electrical signal, which is then amplified, processed, and recorded. By analyzing and inferring the recorded acoustic emission signals, the mechanism of the acoustic emission of the material is understood.</p>\n<p><img src=\"https://miro.medium.com/v2/resize:fit:1400/1*DN4Z2vbG5bmLGFwrBg63OA.png\" alt=\"\"/></p>\n<p>Fig. 1–1 Block diagram of acoustic emission testing principle</p>\n<h1>1.2. Main Purpose of Acoustic Emission Testing</h1>\n<p>l Locate the acoustic emission source.</p>\n<p>l Analyze the properties of the acoustic emission source.</p>\n<p>l Determine the time and load of the AE occurrence.</p>\n<p>l Assess the severity of the acoustic emission source.</p>\n<h1>1.3. Characteristics of Acoustic Emission Testing</h1>\n<p>The discovery of each acoustic emission source indicates the application of AE system. The AE testing method is different from other conventional NDT methods in many aspects:</p>\n<p>l It is a dynamic detection method. The detected energy comes from the object itself, not from the detection instrument.</p>\n<p>l It is sensitive to linear defects and can detect the movement of the defects under external structural stress.</p>\n<p>l It can detect and evaluate the state of the defects in the whole structure.</p>\n<p>l The system can provide real-time or continuous information of the defects changing with the external variables, such as load.</p>\n<p>l The requirement of approaching the detected objects is not high.</p>\n<p>l It can be used for inspection of pressure vessels in service.</p>\n<p>l When used in pressure tests of pressure vessels, it can prevent catastrophic failure of the inspected object caused by unknown discontinuous defects and limit its maximum working pressure.</p>\n<p>l It is suitable for object detection with complex geometry.</p>\n<p>By finding the hidden defects, even in some unreachable parts of the structure, the spread of the damages can be prevented. That is the main purpose of the AE detection/monitoring.</p>\n<h1>1.4. Applications of Acoustic Emission Technology</h1>\n<p>Currently acoustic emission technology has been applied in many fields, including the following aspects:</p>\n<p>l The petrochemical industry</p>\n<p>l The power industry</p>\n<p>l Material test</p>\n<p>l Civil Engineering</p>\n<p>l The aerospace and aviation industry</p>\n<p>l Metal Process</p>\n<p>l The transportation industry</p>\n<p>Main application of RAEM2:</p>\n<p>l Steady state acoustic emission signal acquisition. Once the steady state signal is generated, it will not disappear, such as bearing wear, pipeline valve leakage, tool wear, etc.</p>\n<p>l Time parameters RMS, ASL, power, applicable to fault diagnosis, condition monitoring and other steady state acoustic emission signal monitoring and detection;</p>\n<p>l Interval sampling mode or continuous sampling mode can be set according to application requirements, and the change of parameters over time is the main criteria of the judgement of the faults;</p>\n<p>l Low power consumption, suitable for long-term monitoring of applications without external power supply, the use of lithium-ion battery power supply can work for up to 3 years (Interval sampling mode with wake up once a day, 1 second each time);</p>\n<p>l Typical applications: fault diagnosis and monitoring of rotating machinery (bearings, tool machining, gear boxes, etc.), wear, lubrication state, etc. Leakage monitoring of pipes, valves and containers; Damage monitoring of continuous damage signals, such as serious damage of wind turbine blades.</p>\n<p><img src=\"https://miro.medium.com/v2/resize:fit:1400/1*l0jAC4ZGhMLsNfT8UgRcDA.png\" alt=\"\"/></p>\n<p>Fig. 1–2 Block diagram of RAEM2 monitoring system</p>\n<h1>1.5. Key Terms of Acoustic Emission Technology</h1>\n<p>(1) Starting point of AE signal: the starting point of an AE signal recognized by the system processor, is usually when the amplitude begins to exceed the threshold.</p>\n<p>(2) End point of AE signal: the end point of the AE signal, which is usually defined as the last time that the signal amplitude crosses the threshold.</p>\n<p>(3) Duration: the time interval between the beginning and the end of the acoustic emission signal.</p>\n<p>(4) Rise time: the time interval between the starting point of AE signal and the peak of the AE signal.</p>\n<p>(5) Sensor array: a combination of two or more sensors placed on a component to detect and determine the position of the source in the array.</p>\n<p>(6) Attenuation: the decrease of the AE amplitude per unit distance, usually expressed in dB per unit distance.</p>\n<p>(7) Average Signal Level (ASL): the time average logarithmic value of the acoustic emission signal after rectification. The amplitude of the acoustic emission signal is measured in logarithmic scale, in unit of dB. At the input of the pre-amplifiers, 0dB = 1μV.</p>\n<p>(8) RMS: Root mean square. The effective average value of the signal amplitude, in unit of V.</p>\n<p>(9) Channel: a complete acoustic emission channel consists of a sensor, a pre-amplifier or an impedance matching transformer, a filter, a secondary amplifier, a connection cable and a signal detector or processor.</p>\n<p>(10) Counts: also known as ring-down counts. In the selected detection interval, the number of times the AE signal crosses the present threshold.</p>\n<p>(11) Event: a local material change giving rise to acoustic emission.</p>\n<p>(12) Event count: the number of events that can be detected by the AE instrument.</p>\n<p>(13) Couplant: the material filled between the contact surface of the sensor and test structure, which can improve the ability of sound power passing through the interface in the process of acoustic emission monitoring.</p>\n<p>(14) Decibel (dB): logarithmic measurement value of AE signal amplitude referring to 1μV, dB = 20lg(A/1μV), where A is the amplitude voltage value of the measured AE signal.</p>\n<p>(15) Dynamic range: the decibel difference between the overload level and the minimum signal level (usually determined by one or more factors in the noise level, low-level distortion, interference, or resolution level) in a system or sensor.</p>\n<p>(16) Effective sound velocity: the sound velocity calculated based on arrival time and distance determined by the artificial acoustic emission signal, for the use of source location.</p>\n<p>(17) Burst acoustic emission: the qualitative description of the discrete signals related to an independent acoustic emission event in the material.</p>\n<p>(18) Continuous acoustic emission: the qualitative description of the continuous signal level produced by the rapid occurrence of acoustic emission events.</p>\n<p>(19) Energy: elastic energy released by acoustic emission events.</p>\n<p>(20) Threshold: the threshold value for monitoring the triggered AE signal.</p>\n<p>(21) Monitoring area: part of the structure monitored by AE sensors.</p>\n<p>(22) Detection range: the part of the test object evaluated by acoustic emission technology.</p>\n<p>(23) Felicity effect: the presence of AE at stress levels below the maximum previously experienced.</p>\n<p>(24) Felicity ratio: the ratio of the stress at presence to the maximum stress applied last time.</p>\n<p>(25) Floating threshold: a dynamic threshold established by the time average of the amplitude of the input signal.</p>\n<p>(26) Hit: any signal that exceeds the threshold and causes a system channel to collect data.</p>\n<p>(27) Kaiser effect: under a fixed sensitivity, there is no detectable AE signal before the stress level is exceeded.</p>\n<h1>1.6. Key Terms in RAEM2 System</h1>\n<p>(1) Sampling rate: also known as sampling speed, the number of sampling points per second of analog voltage signal acquired by the ADC module; for example, 10MSPS, means 10M (=106) points per second.</p>\n<p>(2) Sampling accuracy: the sampling accuracy determines the minimum resolution of the signal within the input voltage range. For example, in the 20Vpp input range, the 16-bit sampling accuracy means that the voltage of 20V is divided into 216 units, i.e., the step is about 0.305 mV. The higher the accuracy, the higher the resolution of the signal.</p>\n<p>(3) AST: automatic sensor testing, which refers to the technology that the sensor transmits a mechanical pulse signal under a voltage excitation, and it is received by the adjacent sensors to evaluate the sensitivity of adjacent sensors.</p>\n<p>(4) ADC: analog to digital conversion, i.e., analog voltage signal is converted into digital signal.</p>\n<p>(5) Analog filter: filter applied in the analog circuit. The product uses 4th order Butterworth analog filter before ADC.</p>\n<p>(6) Pre-amplifier: amplifies the weak voltage signal output from the sensor and applies impedance transformation, to adapt to the electronic amplification circuit for long-distance signal transmission, and outputs analog signals.</p>\n<p>(7) IoT: Internet of Things.</p>\n<p>(8) Sampling Mode (LoRa version RAEM2): the default mode is “Passive”. RAEM2 devices do not actively send data to the gateway. It is the gateway requires data from RAEM2 and RAEM2 replies with data. When multiple RAEM2 devices are transmitting data, RAEM2 send in sequence according to their designated numbers. (When a gateway corresponds to multiple RAEM2s, sending data from two or more RAEM2s simultaneously may cause interference issues)</p>\n<p>(9) Sampling interval:The interval stop time after each acquisition of a fixed-length signal, in microseconds (μs). The fixed length signal is collected again after the time is up.</p>\n<p>(10) Sampling length:The length of each sample, in microseconds (μs), is a set length of signal collected each time.</p>\n<p>(11) Sampling time:The number of times a fixed-length signal is collected.</p>\n<p>(12) Sampling state:Select sample start or stop. Indicates the current sampling state of the device.</p>\n<p>(13) Interval sampling mode: that is, after sampling for a period of time, suspend sampling for a period of time, and then resume sampling for a period of time, and the cycle is repeated.</p>\n<p>NOTE: Sleep time of Timing Sampling Type: The accuracy of the sleep time is ±3 minutes. Starting from the modification of the sleep time, if it is changed to 30 minutes, the first timing of the device will start from the current AE timing configuration time for 30 minutes (the device needs to interact with the gateway for about 3–4 minutes, so there is a deviation of 3–4 minutes in time). The more sub devices in the gateway, the greater the time deviation.</p>\n<p>(14) System clock (s): System clock, in seconds. The display format is YYYY-MM-DD HH:MM:SS.</p>\n<h1>2. Product Introduction</h1>\n<p>RAEM2 system combines acoustic emission sensor, battery, data acquisition and processing module and communication module in a small aluminum alloy cylinder. With some magnets at the bottom base, RAEM2 can be attracted to and coupled on the metal object surface. It not only supports various communication methods to the IoT Cloud, for instance 4G, or LoRa, but also supports local inspection through Bluetooth. The cloud platform can be used for remote data monitoring and dual-direction transmission and configurations. There are a variety of output ports and data communication methods available to choose based on the applications.</p>\n<p>The system is triggered by time. RAEM2 is suitable for long-term continuous unattended automatic data acquisition, processing and output. It can output amplitude, ASL, power, RMS, as well as waveform of the acoustic wave signal (The LoRa version of RAEM2 does not support sending waveform data).</p>\n<p>As of the date this document is written, the latest Bluetooth inspection software is V1.2.19. The Bluetooth APP is for short range local inspection purpose to quickly test the RAEM2.</p>\n<p>Bluetooth APP download address:<a href=\"https://www.blogger.com/blog/post/edit/4846769717482021329/3339670695828179779#\">https://www.iot.ae-ndt.com/download/bleApp/ble1_2_19.apk</a></p>\n<p>There are currently two versions of RAEM2, 4G version and LoRa version respectively. The difference of the two versions is the long distance communication method to the Qingcheng Cloud Platform. All the rest of the two versions of RAEM2 are the same.</p>\n<p>RAEM2 (4G version) consists of 3 parts:</p>\n<p>l RAEM2 (AE sensor, signal acquisition and processing, data communication)</p>\n<p>l Cloud platform (cloud server, Bluetooth inspection software)</p>\n<p>l Client terminal (mobile phone, PC)</p>\n<p>RAEM2 (LoRa version) consists of 4 parts:</p>\n<p>l RAEM2 (AE sensor, signal acquisition and processing, data communication)</p>\n<p>l LoRa gateway</p>\n<p>l Cloud platform (cloud server, Bluetooth inspection software)</p>\n<p>l Client terminal (mobile phone, PC)</p>\n<p>RAEM2 main body is an aluminum alloy shell small cylinder. Inside there are data acquisition and processing modules, Bluetooth module and communication module.</p>\n<p>Time trigger acquisition is suitable for all kinds of continuous AE signal acquisition. After the scheduled sleep time is set, the device periodically starts and stops the sampling based on the schedule.</p>\n<p>The output data types include parameter (amplitude, RMS, power, ASL) and waveform data (LoRa version doesn’t support waveform), which can be uploaded to the cloud platform for display and analysis (Qingcheng Cloud platform, etc.), and the Bluetooth inspection APP developed by QingCheng can be used for locally inspection.</p>\n<p>RAEM2 currently does not have rating function. After data is uploaded to the cloud, it can be downloaded via the cloud platform in Excel format (simply click the “Download (To CSV)” to complete the download).</p>\n<h1>2.1. Hardware Introduction</h1>\n<p><img src=\"https://miro.medium.com/v2/resize:fit:1400/1*f3S3WUQ9sI42tavUB5h9MA.png\" alt=\"\"/></p>\n<p>Fig. 2–1 Diagram of RAEM2 system</p>\n<p>Figure 2–2 shows a basic hardware package of RAEM2, which includes a small RAEM2 cylinder with a magnetic base, a Bluetooth external antenna, a 4G/LoRa external antenna, a LoRa gateway kit (LoRa version of RAEM2 only) and 8.4V power charger.</p>\n<p>For the sensor replacement and installation flexibility, we make two types of RAEM2 cylinder, one with built-in integral sensor and the other type with external integral sensor. Customers can choose the built-in type or external type cylinder based on their testing requirements.</p>\n<p>RAEM2 with Internal Sensor</p>\n<p>OR</p>\n<p>RAEM2 with External Sensor</p>\n<p>8.4V Power Charger</p>\n<p>Bluetooth Antenna</p>\n<p>4G/LoRa Antenna</p>\n<ul><li>LoRa Gateway & its Accessories (LoRa version only)</li></ul>\n<p>RAEM2 with Internal Sensor</p>\n<p>OR</p>\n<p>RAEM2 with External Sensor</p>\n<p>8.4V Power Charger</p>\n<p>Bluetooth Antenna</p>\n<p>4G/LoRa Antenna</p>\n<ul><li>LoRa Gateway & its Accessories (LoRa version only)</li></ul>\n<p><img src=\"https://miro.medium.com/v2/resize:fit:940/1*406Po0mZF_Amb-4s54bFxA.png\" alt=\"\"/></p>\n<p>Fig. 2–2 RAEM2 with Internal Sensor Hardware Package</p>\n<p><img src=\"https://miro.medium.com/v2/resize:fit:1062/1*GHYABn48rMQ28P1rne-1ZQ.png\" alt=\"\"/><img src=\"https://miro.medium.com/v2/resize:fit:1098/1*jijGQUL5po_zLiDO6YXyVg.png\" alt=\"\"/></p>\n<p>Figure 2–3 and Figure 2–4 show the RAEM2 exterior and function introductions.</p>\n<p>u (Power) Switch: power switch ti turn the RAEM2 power on or off;</p>\n<p>u LED Indicators:</p>\n<p>n Power Indicator (Green LED): Indicates the power on or off state. After the power switch turns on, the power indicator is solidly green;</p>\n<p>n Status Indicator (Blue LED):</p>\n<p>[1] Sampling status: blue light is flashing quickly;</p>\n<p>[2] Stop sampling: blue light turns off;</p>\n<p>[3] Sending data: The blue light blinks slowly;</p>\n<p>u Charging Port/ Power Interface: the connector to plug in the charger to recharge the battery inside RAEM2;</p>\n<p>u Bluetooth antenna port: connects to Bluetooth antenna;</p>\n<p>u 4G/LoRa antenna port: Connects to 4G/LoRa antenna;</p>\n<p>u Magnetic Base: both internal sensor and external sensor types have the magnetic base;</p>\n<p>u Built-in Sensor: in the version of RAEM2 with internal sensor, the sensor is located at the center of the bottom surface.</p>\n<p>u AST: Auto sensor testing function is to test the RAEM2 sensitivity and coupling status. The small pop-out round object is the additional sensor to send out the elastic mechanical AE waves and the built-in sensor receives the waves to get the result data. AST function is only available in the sensor built-in version.</p>\n<p>u Sensor Interface: in the version of RAEM2 with external sensor, use the coaxial cable to connect the external sensor to the sensor interface of the RAEM2.</p>\n<p>RAEM2 with internal sensor:</p>\n<p>Fig. 2–3 RAEM2 Exterior with Built-in Sensor</p>\n<p><img src=\"https://miro.medium.com/v2/resize:fit:796/1*AZBW_jE0L2G-5wVIYosr4g.png\" alt=\"\"/><img src=\"https://miro.medium.com/v2/resize:fit:1214/1*KHy4sypMmpGR5_ZUdjhRCw.png\" alt=\"\"/></p>\n<p>RAEM2 with external sensor:</p>\n<p>Fig. 2–4 RAEM2 Exterior with External Sensor</p>\n<p>LoRa gateway:</p>\n<p>A single LoRa gateway can connect to up to 200 RAEM2 devices. The maximum communication range in an open, unobstructed environment is 10 km.</p>\n<p><img src=\"https://miro.medium.com/v2/resize:fit:1400/1*RREA2jWdfL8m0ud0WurIdA.png\" alt=\"\"/></p>\n<p>Fig. 2–5 LoRa Gateway</p>\n<h1>2.2. RAEM2 Technical Specifications</h1>\n<p>RAEM2</p>\n<p>Channel</p>\n<p>Single-channel</p>\n<p>Sampling Mode</p>\n<p>Interval sampling mode, Scheduled sampling mode and Continuous sampling mode</p>\n<p>(LoRa version RAEM2 only has timing sampling mode)</p>\n<p>Input Frequency</p>\n<p>10kHz-400KHz</p>\n<p>Sampling Accuracy</p>\n<p>16-bit</p>\n<p>Sampling Rate</p>\n<p>Optional 200k/s, 500k/s, 1000k/s, 2000k/s</p>\n<p>System Noise (Amplitude)</p>\n<p>Better than 40dB with built-in sensor</p>\n<p>Better than 30dB with external sensor</p>\n<p>Sensor</p>\n<p>Sensor resonant frequency at 150kHz (60kHz~400kHz) or 40kHz (15kHz~70kHz)</p>\n<p>Preamplifier Supply Voltage</p>\n<p>28V40dB / 12V34dB / 5V26dB</p>\n<p>Digital Filter</p>\n<p>128-order, free to set the low-pass, high-pass and band-pass filters from 0kHz to 1000kHz<br/><em>(The filter range is related to the sampling rate; the maximum frequency ≤ ½ sampling rate)</em></p>\n<p>Data Output</p>\n<p>Parameters (Amplitude, RMS, power, ASL), waveform<br/><em>(LoRa version doesn’t support waveform)</em></p>\n<p>Communication Modes</p>\n<p>4G or LoRa, RS485</p>\n<p>4G Supported Frequency Bands</p>\n<p>LTE-FDD:B1/B3/B5/B8</p>\n<p>LTE-TDD:B34/B38/B39/B40/B41</p>\n<p>On-site Inspection</p>\n<p>Bluetooth</p>\n<p>Bluetooth Range</p>\n<p>13 meters</p>\n<p>Operation Temperature</p>\n<p>-20℃ to 60℃</p>\n<p>Power Supply Mode</p>\n<p>There are various options available:</p>\n<p>1. External 8.4V DC power supply</p>\n<p>2. Internal rechargeable battery <a href=\"https://www.blogger.com/blog/post/edit/4846769717482021329/3339670695828179779#\">([email protected])</a></p>\n<p>3. Built-in lithium-ion battery with low self-discharge rate ([email protected], non-rechargeable)</p>\n<p>Charging Voltage</p>\n<p>8.4V</p>\n<p>Protection Degree</p>\n<p>IP65</p>\n<p>Sampling Length (µs)</p>\n<p>At different sampling rates:</p>\n<p>2000Ksps:500us~15000us</p>\n<p>1000Ksps: 1000us~30000us</p>\n<p>500Ksps:2000us~60000us</p>\n<p>200Ksps:5000us~150000us</p>\n<p>Trigger Mode</p>\n<p>Time trigger</p>\n<p>Dynamic Range</p>\n<p>Built-in sensor version: 60dB</p>\n<p>External sensor version: 70dB</p>\n<p>Maximum Amplitude</p>\n<p>100 dB</p>\n<p>Timing Acquisition Mode Hibernation Time Accuracy</p>\n<p>±1min (LoRa version: ±3min)</p>\n<p>Timing Acquisition Mode Battery Life</p>\n<p>Theoretical measurement: once per day for 1 second:</p>\n<p>- 3 years (7000mAh Lithium-ion battery);</p>\n<p>- recharge every 3 months (3000mAh Rechargeable battery)</p>\n<p>Continuous Sampling Mode Battery Life</p>\n<p>15 hours (Rechargeable battery);</p>\n<p>24 hours (non-chargeable battery)</p>\n<p>Dimension<br/>(without antenna)</p>\n<p>Φ60mm diameter, height 105mm (with 150kHz sensor) / height 117mm (with 40kHz sensor)</p>\n<p>External sensor type: Φ60mm diameter, height 105mm</p>\n<p>Weight (including battery, magnet, antenna)</p>\n<p><500g</p>\n<p>LoRa Gateway</p>\n<p>Theoretical Maximum Number of RAEM2 Supported by a LoRa Gateway</p>\n<p>200</p>\n<p>Theoretical Maximum communication distance by a LoRa Gateway</p>\n<p>Up to 10 km at open area</p>\n<p>Communication method</p>\n<p>Ethernet cable, 4G</p>\n<p>Working frequency</p>\n<p>EU433, CN470–510, CN779–787, EU863–870, US902–928, AU915–928, AS923, KR920–923</p>\n<p>Table 2–1 RAEM2 Technical Specifications</p>\n<h1>3. Quick Operation Guide</h1>\n<h1>3.1. Quick Operation Steps</h1>\n<p><img src=\"https://miro.medium.com/v2/resize:fit:1400/1*8VRCUIlR_tcoe-t83uYCAg.png\" alt=\"\"/></p>\n<p>1. Finish the hardware connections of RAEM2:</p>\n<p>RAEM2 with internal sensor</p>\n<p>RAEM2 with external sensor</p>\n<p>Just need to connect the Bluetooth antenna and the 4G/LoRa antenna. (<em>see Figure 2–3</em>)</p>\n<p>① connect the Bluetooth antenna and the 4G/LoRa antenna;</p>\n<p>② Connect the external sensor to the “Sensor” port of RAEM2 using the coaxial cable A. (<em>see Figure 2–4</em>)</p>\n<p>LoRa Version</p>\n<p>Connect the LoRa gateway with the power adaptor to power and the Ethernet cable to gateway. Connect the antennas based on needs. The WiFi of the gateway is for gateway configuration only. For the control and data transmission of the gateway to RAEM2 it is suggested to use Ethernet (primary) or 4GB (contact us for instructions). (<em>See Figure 2–5</em>)</p>\n<p>4G Version</p>\n<p>Please contact us for detail 4G Data SIM card installation instructions.</p>\n<p>2.</p>\n<p>Power on the RAEM2 device first by pressing down the power switch button on the top surface of RAEM2. Then for LoRa version, power on the gateway by connecting it to the 12V/36W power adaptor.</p>\n<p>3. First time LoRa gateway connection and configuration: connect the computer to the gateway’s WiFi network (qc-gw-xxx) for the gateway configurations purpose only. The default password is 88888888. Open a browser and enter the URL <a href=\"https://www.blogger.com/blog/post/edit/4846769717482021329/3339670695828179779#\">http://192.168.1.1/</a> to access the Qingcheng IoT Gateway page and add the desired RAEM2 devices to the gateway (see Chapter 5: Qingcheng IoT Gateway). <em>The RAEM2 devices should have been added to the gateway when going out from the factory</em>.</p>\n<p>4. For daily remote controls and data accessing, use Qingcheng IoT Cloud Platform. Open a browser and visit <a href=\"https://www.blogger.com/blog/post/edit/4846769717482021329/3339670695828179779#\">http://cloud.ae-ndt.com/</a>, then log in to the Qingcheng IoT Cloud Platform using your account credentials ( detail operations refer to Chapter 6: Qingcheng IoT Cloud Platform).</p>\n<p>5. For short distance local inspection, connect RAEM2 to your smartphone Bluetooth APP. See Chapter 4 for details.</p>\n<h1>3.2. Operation Notes</h1>\n<h1>3.2.1. RAEM2 States</h1>\n<p>In the Qingcheng Cloud Platform, RAEM2 has three states: Wake up, Sleep, and Offline.</p>\n<p>· Sleep: The RAEM2 device can be in either the Wake up or Sleep state. (Note: RAEM2 has a very short online acquisition time. After the collection is complete, it enters sleep mode. So the state will mostly display Sleep. After pressing the Wake up button, the cloud platform status will display Wake Up.)</p>\n<p>· Wake up: Click the Wake up button. Once RAEM2 successfully awakened, the device state changes to Wake up. Otherwise, if the RAEM2 cannot wake up and display Offline, it means the RAEM2 is in special condition (see Offline state). This button can be used to confirm whether the RAEM2 device is in a special condition or not.</p>\n<p>·</p>\n<p>Offline: The RAEM2 device is not controlled by the gateway or the RAEM2 battery is dead.</p>\n<h1>3.2.2. RAEM2 Modifications</h1>\n<p>Configuration Modifications for single RAEM2 on Qingcheng IoT Cloud Platform (Parameter Configuration, Filter Configuration, Timing Configuration — see Chapter 6 for details):</p>\n<p>(1) Navigate to the Gateway Configuration page with the following steps: IoT Products → Devices, select the QCGW in the Product, and click Search → find the row of the desired gateway “qc_gw_xxx” and in the Action column and select Device Action.</p>\n<p>(2) Click Manual Control Sub Device button to release the gateway’s control over the RAEM2 device (wait until a message pop up in the top-right corner indicating “Gw Stop [OK]”).</p>\n<p>(3) In the RAEM2 device number column, click Device Action to enter the Device Configuration page for RAEM2.</p>\n<p>(4)</p>\n<p>Modify configurations: Click AE Parameter Config to make changes. After completing the modifications, click Submit and wait for 3–4 minutes until a success message appears in the top-right corner indicating the configuration has been successfully updated. Then, click Refresh Page.</p>\n<p>Configuration Modifications for a batch of RAEM2 on the Qingcheng IoT Cloud Platform (Parameter Configuration, Filter Configuration, Timing Configuration):</p>\n<p>1. Steps (1), (2), and (3) are identical to those in the section “Configuration Modifications for single RAEM2 on Qingcheng IoT Cloud Platform (Parameter Configuration, Filter Configuration, Timing Configuration).”</p>\n<p>2. Configuration Modifications:</p>\n<p>o Click AE Parameter Config to make the necessary changes.</p>\n<p>o After completing the modifications, click Copy Device Config, select the RAEM2 devices requiring batch configuration updates, and click Submit.</p>\n<p>o Wait for about 3–4 minutes until a success message appears in the top-right corner, indicating [Edit] AE Parameters/Timing/FFT Configuration [Success]!</p>\n<p>3. Wait until the success message is displayed in the top-right corner. Then, click Refresh Page.</p>\n<h1>3.2.3. RAEM2 Controls</h1>\n<p>Controlling of RAEM2 (Reboot, Wake up, Sleep, AST Test, Start Sampling, Stop Sampling, Refresh Config):</p>\n<p>1. Navigate to the Gateway Configuration page with the following steps: IoT Products → Devices, select the QCGW in the Product, and click Search → find the row of the desired gateway “qc_gw_xxx” and in the Action column and select Device Action.</p>\n<p>2. Use Manual Control Sub Device to release the gateway’s control over RAEM2. A message will pop up in the top-right corner indicating Gw stop OK.</p>\n<p>3. Select the RAEM2 device and perform operations such as Start Sampling, Stop Sampling, or other desired actions.</p>\n<p>o Wait for3–4 minutes until a notification appears in the top-right corner confirming the operation.</p>\n<p>o</p>\n<p>If the notification is missed, check the Device Notice Message section to verify the execution state.</p>\n<h1>3.2.4. Special Case Handling</h1>\n<p>Special Case Handling:</p>\n<p>Ø RAEM2 Displays “Offline”</p>\n<p>(1) On the Qingcheng IoT Cloud Platform’s Gateway Configuration page, click Manual Control Sub Device, then click Query Sub Device State.</p>\n<p>(2) If the device still shows Offline, select the offline RAEM2 device and click Wake up. If a message like “-” appears in the top-right corner, it indicates that the RAEM2 is not under gateway control or its battery is dead.</p>\n<p>(3) Reboot the RAEM2. If the RAEM2 power indicator does not stay green, charge the RAEM2 or replace its battery, then reboot the device again.</p>\n<p>(4) Repeat steps (1) and (2).</p>\n<p>Ø Replacing or Adding a New RAEM2</p>\n<p>(1) Connect to the gateway WiFi network (qc-gw-xxx) with your laptop. Open the Qingcheng IoT Gateway page (<a href=\"https://www.blogger.com/blog/post/edit/4846769717482021329/3339670695828179779#\">http://192.168.1.1/</a> ), log in (no username or password is required by default), and navigate to Configuration Information → Gateway Configuration → Sub Device Management.</p>\n<p>(2) Update the RAEM2 device number and click Submit. If adding a new RAEM2 device, click Add Device, enter the new RAEM2 device number, and then click Submit.</p>\n<p>(3) Log in to the Qingcheng IoT Cloud Platform (<a href=\"https://www.blogger.com/blog/post/edit/4846769717482021329/3339670695828179779#\">http://cloud.ae-ndt.com</a>) and add the device (refer to Chapter 6).</p>\n<p>Ø No Feedback Message Handling Method</p>\n<p>If there is no feedback message in Device Notice Message after 3–4 minutes for the wake-up or configuration modification operation,</p>\n<p>(1) click Automatic Control Sub Device, until the message Gw Started [Success!!] appears in Device Notice Message.</p>\n<p>(2) click Manual Control Sub Device, until the message Gw Stopped [Success!!] appears in Device Notice Message.</p>\n<p>(3) proceed with the RAEM2 operations.</p>\n<p>Fig. 3–1 LoRa Gateway Control Page</p>\n<h1>4.</h1>\n<h1>Local Inspection Through Bluetooth</h1>\n<h1>4.1. Bluetooth Connection</h1>\n<p>Turn on the Bluetooth on the phone. Press the power switch of the RAEM2, and open the APP on your phone, and connect the device as followed:</p>\n<p>Tap the icon ① to connect to Bluetooth. Tap the icon ② to search for devices. Find the desired device, and tap the icon ③ to connect. Wait for a moment until the device is connected to the APP. When the prompt “Connect Successful…” on the top of the screen is displayed, wait for a period of time. When the prompt “This set of data finish” appears, it indicates that the APP is now completely connected with RAEM2.</p>\n<p>Common function button:</p>\n<p>l RefreshConf: Read the latest configuration of RAEM2.</p>\n<p><img src=\"https://miro.medium.com/v2/resize:fit:692/1*iQGL8r5wzLrTqQDu_THxRQ.png\" alt=\"\"/><img src=\"https://miro.medium.com/v2/resize:fit:692/1*mpZgOA1Mhoysc_zAmmgzoQ.png\" alt=\"\"/><img src=\"https://miro.medium.com/v2/resize:fit:692/1*DcMYF8PTYMBqPcxs7dA1Yw.png\" alt=\"\"/></p>\n<p>Fig. 4–1 Bluetooth APP Start Interface</p>\n<h1>4.2.</h1>\n<h1>AST Test</h1>\n<p>Click the AST button, click Submit, wait for a period of time, and AST results will appear.</p>\n<p><img src=\"https://miro.medium.com/v2/resize:fit:712/1*2B9cPyLKH_BZzwjocEMwbA.png\" alt=\"\"/><img src=\"https://miro.medium.com/v2/resize:fit:700/1*u1wMZC7QPNbMfNXFxpFf-Q.png\" alt=\"\"/><img src=\"https://miro.medium.com/v2/resize:fit:712/1*U1RnH09Q98tuzNha_FNHkg.png\" alt=\"\"/></p>\n<p>Fig. 4–2 Bluetooth AST Function</p>\n<h1>4.3. AE Parameter Configuration</h1>\n<p>Click SampleConf to enter the parameter configuration page. You can modify the sampling rate, high-pass filter, low-pass filter, sampling mode, sampling length, sampling times and sampling interval. Click the Submit button when the modification is completed.</p>\n<p>If the sampling rate is modified to 1000k/s, click Submit and check whether the value is changed (or see if the system time is updated). If the value is changed, the modification is successful. Otherwise, you need to modify it again. The RAEM2 device needs to be rebooted after modification of sampling rate/sampling length/filter range.</p>\n<p>l Synchronize to Platform: to send the APP configurations to the Qingcheng Cloud Platform so that the configurations can be stored in the cloud platform and reapplied even disconnected from Bluetooth.</p>\n<p><img src=\"https://miro.medium.com/v2/resize:fit:712/1*OHKPlbkkp7zZ9ZpyQeu-mg.png\" alt=\"\"/><img src=\"https://miro.medium.com/v2/resize:fit:756/1*K_sn6Ca5Ixkg2Ipr57jM8w.png\" alt=\"\"/></p>\n<p>Fig. 4–3 APP Sample Configuration</p>\n<h1>4.4. AE Timing Setup</h1>\n<p>l (4G Version) RAEM2 Timing Setup:</p>\n<p>Click TimingConf button to open the timing setting page, you can modify the sampling mode. Click Interval button to set the sleep time. Click Submit after the setting is complete.</p>\n<p>l (LoRa Version) RAEM2 Timing Setup:</p>\n<p>The latest configuration of RAEM2 is actively retrieved by the LoRa gateway from the cloud. Since the LoRa gateway has not yet implemented the functionality to obtain the sleep time from the Bluetooth app, any changes made via the Bluetooth app cannot take effect. To ensure the settings are successfully applied, it is recommended to modify the sleep time directly on the cloud platform.</p>\n<p><img src=\"https://miro.medium.com/v2/resize:fit:712/1*8gD8PUH20auR0Hk-U2mgtA.png\" alt=\"\"/><img src=\"https://miro.medium.com/v2/resize:fit:712/1*QN2OhrIyadoStrsNT9iATw.png\" alt=\"\"/></p>\n<p>Fig. 4–4 APP Timing Configuration</p>\n<h1>4.5. Refresh Configuration</h1>\n<p>Click RefreshConf button to refresh the configurations.</p>\n<p>Fig. 4–5 APP Refresh Configuration</p>\n<h1>4.6. Parameters</h1>\n<p>The Parameters page allows you to view real-time or historical parameter data: Real-time data can be viewed by selecting the “Auto Refresh” and “Current Sample” buttons. Historical data can be accessed by selecting a start and end time.</p>\n<p>Click on the XXX points total buttons (10, 20, 50, 100, 200, 500, 1000) to adjust the scale of the parameter curve display.</p>\n<p>Clicking on a coordinate point in the graph will display details such as arrival time, amplitude, ASL, power, and RMS parameter values.</p>\n<p>Fig. 4–6 APP AE Parameters</p>\n<p>Button Descriptions:</p>\n<p>l Parameters: Options include amplitude, ASL, power, and RMS.</p>\n<p>l Pick Date: Allows you to view historical parameter data within a specified time range by selecting a start and end time.</p>\n<p>l Auto Refresh: Automatically update parameter data in real time.</p>\n<p>l Current sample: Enable to only display the latest acquisition cycle data. Disable to display all data.</p>\n<p>l Start sample: starts data sampling of the RAEM2 device.</p>\n<p>l Stop sample: Stops data sampling of the RAEM2 device.</p>\n<p>Note: After RAEM2 finishes the last cycle of acquisition, you must click Stop sample before clicking Start sample again.</p>\n<p>l Delete Data: Delete the selected data.</p>\n<p>l Save Image: save the current displaying graph as a reference image stored at the bottom of the page.</p>\n<h1>4.7. Language Switch/Send Data to Cloud</h1>\n<p>Fig. 4–7 APP Language and Cloud Sync</p>\n<h1>5. Qingcheng IoT Gateway</h1>\n<p>First, power on the RAEM2, and then power the gateway. Once the gateway is powered on, it will automatically operate.</p>\n<p>If the network is functioning properly, the gateway will appear as Online on the Qingcheng IoT Cloud Platform. After approximately 5 minutes, refresh the current page, and the powered-on RAEM2 will display as Sleep.</p>\n<p>Fig. 5–1 Qingcheng IoT Cloud Platform interface</p>\n<p>Connect computer or smartphone to the gateway’s WiFi network named qc_gw_xxx (e.g., qc_gw_002). The default network password is 88888888.</p>\n<p>Fig. 5–2 WiFi Hotspot of Gateway</p>\n<p>Open a web browser and enter the URL: <a href=\"https://www.blogger.com/blog/post/edit/4846769717482021329/3339670695828179779#\">http://192.168.1.1/</a></p>\n<p>User name: demo</p>\n<p>Password: 123456</p>\n<p>Fig. 5–3 Qingcheng IoT Gateway Login Interface</p>\n<h1>5.1. Gateway Configuration</h1>\n<p>After logging in, click Config Info — Gateway Config to modify the gateway’s basic config, manage Sub Devices, and configure APN config.</p>\n<h1>5.1.1. Basic Config</h1>\n<p>After entering this page, you can modify the gateway WiFi SSID and password.</p>\n<p>Fig. 5–4 Qingcheng IoT Gateway Basic Information Page</p>\n<h1>5.1.2. Sub Devices</h1>\n<p>Add or remove RAEM2 devices controlled by the current gateway.</p>\n<p>Operate procedures: Click Add Device. Enter the information of the new RAEM2, then click Submit.</p>\n<p>❗ Note: Ensure the RAEM2 device number is entered correctly.</p>\n<p>Fig. 5–5 Qingcheng IoT Gateway Sub-devices Page</p>\n<h1>5.1.3. APN Config</h1>\n<p>APN Address (Required): Enter the carrier’s APN address for the gateway to access the network, e.g., cmnet for China Mobile.</p>\n<p>Auth Type (Required): Enter the APN authentication type provided by the carrier, e.g., “pap”.</p>\n<p>User (Optional): Provided by the carrier (required when the gateway connects to a private cellular network).</p>\n<p>Password (Optional): Provided by the carrier (required when the gateway connects to a private cellular network).</p>\n<p>Fig. 5–6 Qingcheng IoT Gateway APN Configuration</p>\n<h1>6. Qingcheng IoT Cloud Platform</h1>\n<p>Qingcheng Internet of Things Cloud Platform is a cloud platform developed for our own IoT acoustic emission products. Customers can log in to the platform to remotely check and modify the device configurations in real time, as well as real-time display of AE waveform, parameters, and the rating levels, alarms, and reports, etc.</p>\n<p>Log in to the Qingcheng IoT cloud platform (<a href=\"https://www.blogger.com/blog/post/edit/4846769717482021329/3339670695828179779#\">http://cloud.ae-ndt.com</a>) and input the username and password. At present, the cloud platform does not support users to register their own accounts. All account registration needs to be operated through Qingcheng Ltd. Please contact us for user registration and login information.</p>\n<p>Fig. 6–1 Login interface of QingCheng Cloud Platform</p>\n<p>After login, you can convert to Chinese/English, change the user interface, and change the password.</p>\n<p>Fig. 6–2 Basic Profile Menu Example</p>\n<h1>6.1. IoT Product</h1>\n<h1>6.1.1. Device Groups</h1>\n<p>Group the devices to facilitate subsequent management of the devices. You can add groups through the device groups page to manage devices in groups, such as storage tank bottom testing or some localization group testing.</p>\n<p>The operation is as follows: click [Add], fill in the “Name”, “Parent”, and “Department” information (Note: When creating a new parent, the “Parent” column does not need to be filled in). “Purpose” can be “Default” or “AE Location Analysis”. Choose “Default” in general.</p>\n<p>Fig. 6–3 Device Group “Add” window</p>\n<p>Fig. 6–4 Device Group page of Qingcheng IoT cloud platform</p>\n<p>l Bind Device: Binding devices into this group for group managements.</p>\n<p>l Bind Alarm scene: After grouping devices and binding alarm scenarios, users can receive alarm information for the grouped devices in this alarm scenario.</p>\n<h1>6.1.2. Devices</h1>\n<p>Devices page lists all the IoT AE devices under this account. Users can search for desired devices through different search items, such as SN., Product, Device Group, Product Type, or State to start filtering searches. And the following table lists all devices on the current platform.</p>\n<p>Fig. 6–5 Device page</p>\n<p>Click +Add to add a new device.</p>\n<p>l Series Number: Fill in the device SN. on the product label (required)</p>\n<p>l Name: User-defined (required)</p>\n<p>l Channel No.: User-defined (required)</p>\n<p>l Department: Select the department which the device belongs. (Required)</p>\n<p>l Product Name: Select the product (required)</p>\n<p>l Device group: Select group which the newly added device belongs (required)</p>\n<p>l Data store: Select the server which the data is stored. (Required)</p>\n<p>l Server Connection: Select the server which the device is connected. (Required)</p>\n<p>Fig. 6–6 Add Device page</p>\n<p>After a new device creation, it will show up a new row for the created device. Under the “Action” column on the right, click “Edit” to modify the device information above.</p>\n<p>Enter the Gateway Configuration page for specific operations: IoT product → Device Select QCGW in Product and click Search → Device Action.</p>\n<p>Fig. 6–7 Device list page</p>\n<h1>6.1.3. Gateway Configuration Page</h1>\n<h2>6.1.3.1. Buttons Associated with Gateway</h2>\n<p>Auto Control Sub Device: The gateway automatically controls the RAEM2 to wake up for data acquisition and automatically enters sleep mode.</p>\n<p>Manual Control Sub Device: Disables the gateway’s control over the RAEM2. After disabling the control, the RAEM2’s configuration can be modified (no matter in wake-up or sleep mode), and operations like waking up and AST testing can be performed.</p>\n<p>Gw Reboot: Reboot the gateway and wait for 3 minutes until gateway successfully reboot.</p>\n<p>Query Sub Device State: Refresh the RAEM2’s state information (there is no need to click “Manual Control Sub Device” before clicking this button).</p>\n<p>Device Notice Message: Query the notification messages from the gateway and all RAEM2 devices under it. Press the [Device Notice Message] button to confirm whether the modified configurations or commands executed by the button press have taken effect.</p>\n<h2>6.1.3.2. Buttons associated with RAEM2 device</h2>\n<p>[Reboot] [Wake up] [Sleep] [Start Sampling] [Stop Sampling] [AST Test] [Refresh Page]</p>\n<p>AST Test: Pressing this button will trigger an AST test on the RAEM2. The test results can be viewed on the IoT Data → AE Data page.</p>\n<p>Refresh Page: Refresh the current page.</p>\n<p>Fig. 6–8 Gateway configuration page</p>\n<p>Click the Device Action button in the device number column to enter the RAEM2 Device Configuration page.</p>\n<h1>6.1.4. Device Configuration Page</h1>\n<p>Operational Procedures:</p>\n<p>1) Enter the Gateway Configuration page for specific operations: IoT product → Device Select QCGW and click Search → Device Action.</p>\n<p>Fig. 6–9 Device list page</p>\n<p>2) Click Manual Control Sub Device to unlink the gateway’s control over the RAEM2. After a while, a message prompt will pop up in the upper-right corner to show if the gateway stops controls or not. If no messages pop up due to some web page or network reasons, click the “Device Notice Message” button to check all the messages.</p>\n<p>Fig. 6–10 Manual Control Sub Device</p>\n<p>3) In the RAEM2 list, click Device Action to go into the RAEM2 Device Configuration page.</p>\n<p>Fig. 6–11 Gateway configuration page</p>\n<p>Query State: Query the RAEM2 state information (e.g., whether the current state is sleep, wake up, or offline).</p>\n<p>Refresh Page: Retrieve the latest configuration information for the RAEM2. It has the same effects as the web page refresh button.</p>\n<p>Fig. 6–12 Device Configuration Page</p>\n<p>Ø AE Parameter config</p>\n<p>· Sampling Rate: The sampling rate refers to the number of samplings points from the analog voltage signal to digital signals per second, measured in thousand per second (k/s), representing the number of sample points per second (e.g., 1000 k/s, or 1 MHz).</p>\n<p>· Sampling Mode: “Passive Mode” means that the RAEM2 does not actively send data to the gateway. When multiple RAEM2 devices are sending data, they transmit in sequence according to their device number.</p>\n<p>· Sampling Length: The length of each sample, measured in microseconds (μs), referring to the length of the signal collected each time.</p>\n<p>· Sampling Times: The number of fixed-length signals collected each time the device is woken up.</p>\n<p>· Sampling Interval: The interval duration after each fixed-length signal sampling, measured in microseconds (μs). After this interval ends, the system will reinitiate the fixed-length signal sampling.</p>\n<p>· Enable Sending Parameters: Indicates whether parameters should be sent to the current IoT cloud platform. This is enabled by default.</p>\n<p>· System Time: The system clock, measured in seconds. The display format is: YYYY-MM-DD HH:MM:SS.</p>\n<p>· Copy Device Config: Updates the configuration information from the current page to the selected RAEM2 devices (i.e., batch modification of RAEM2 configurations).</p>\n<p>Ø AE Filter Config</p>\n<p>· Enable Filter: The filter can be enabled or disabled by toggling the filter enable switch.</p>\n<p>· High-Pass Filter: High-pass refers to the lower frequency limit in the frequency domain. Signals with a frequency lower than this threshold cannot pass through.</p>\n<p>· Low-Pass Filter: Low-pass refers to the upper frequency limit in the frequency domain. Signals with a frequency higher than this threshold cannot pass through.</p>\n<p>· System Time: The system clock, measured in seconds. The display format is: YYYY-MM-DD HH:MM:SS.</p>\n<p>· Copy Device Config: When devices are selected and submitted, the configuration of the selected devices will be synchronized and updated.</p>\n<p>Ø AE Timing Config</p>\n<p>· Timing Sampling Type: After setting the time, the device will automatically enter sleep mode. Once the sleep is complete, the device will automatically wake up to continue sampling.</p>\n<p>· Sleep Time (s): The shortest timed sleep duration can be set to 3 minutes (i.e., 180 seconds). The timer starts after the device time is modified. For example, if it is set to 30 minutes, the device will begin counting 30 minutes from the time of the current AE timed configuration (Note: The device needs to interact with the gateway for approximately 2–3 minutes, so there may be a 2–3 minutes time deviation).</p>\n<p>4) Configuration Operational Procedures:(see Figure 6–12)</p>\n<p>① Click AE Parameter Config / AE Filter Config / AE Timing Config, make the necessary changes;</p>\n<p>② then click Submit.</p>\n<p>③ After a short wait, a prompt will appear in the upper-right corner. If you missed the notification message, click Device Notice Message to check it.</p>\n<p>④ Once confirmed, click Refresh Page to check whether the page parameters have been successfully updated. If not, repeat the above steps.</p>\n<h1>6.2. IoT Data</h1>\n<h1>6.2.1. AE Data</h1>\n<p>AE Data page displays a time chart of a specific parameter change for a certain device. You can access this page by clicking IoT Data → AE Data in the left sidebar of the platform, or by clicking the View Data button on the right side of the Devices page to enter the device’s AE Data page. By default, all parameters are displayed in separate time-related charts.</p>\n<p>After entering the page, select RAEM2 in the top bar under Product, and choose the device based on the device number under Device. Once completed, click Search.</p>\n<p>❗Note: Historical data queries can be filtered by selecting the Created At time.</p>\n<p>Fig. 6–13 Display of Multiple Parameters for RAEM2 Device</p>\n<p>When the mouse is moved over the line, the corresponding voltage value and time for the horizontal and vertical coordinates will be displayed.</p>\n<p>Fig. 6–14 Display of AMP Parameter for RAEM2 Device</p>\n<p>The buttons in the upper right corner in both parameter graphs and waveform graphs are the functions to modify the graphs, which are Regional Zoom In, Regional Zoom Out, Data Table, Line Chart, Bar Chart, Restore, and Save as Image.</p>\n<p>l Regional Zoom In: Click “Regional Zoom-in” button, then use the mouse to pressure down and drag a rectangle area in the graph. Once releasing the mouse, only the selected area (in time domain) of the graph will be displayed.</p>\n<p>l Regional Zoom Out: Click “Regional Zoom-out” button, the graph will restored to the previous zooming stage.</p>\n<p>l Data Table: list all the data points in table list.</p>\n<p>l Switch to line chart: display data in line chart.</p>\n<p>l Switch to bar chart: display data in bar chart.</p>\n<p>l Restore: Restore to default state.</p>\n<p>l Save as Image: You can save the image to your computer.</p>\n<p>(1) Data Download Procedure</p>\n<p>l Download (To CSV): Download the AE data locally in CSV format.</p>\n<p>Steps: [Product] Select “RAEM1”, [Device] Select the device number that needs to download data, [Creation Time] select the creation time of the data that needs to be downloaded, and click [Download (To CSV)]. In the pop-up window, click “OK” to start the download of data. Once finished, it will show up as a CSV file with all parameters from the selected time frame of the device.</p>\n<p>l Download (To SWAE): not available for RAEM2.</p>\n<p>(2) Data deletion operation</p>\n<p>Click AE Data, select the Product, Device, Created time, click Delete, then you can delete the data of the selected device during this period.</p>\n<h1>6.2.2. Correlogram</h1>\n<p>Correlation graph refers to a type of relationship graph that uses two or more acoustic emission parameters as horizontal and vertical coordinates to draw correlation curves, distribution point graphs, line graphs, etc., to characterize acoustic emission signals. It is a major application tool for analyzing parameter data.</p>\n<p>+ Add Graph: Add additional correlation graph;</p>\n<p>Save Settings: Save all existing settings, including devices, time frame, points, and all the correlation graphs setup.</p>\n<p>Restore Settings: Restore all settings previously saved;</p>\n<p>Points: The maximum number of points displayed in the relevant chart can be selected from 100, 200, 500, 1000, 2000, 5000, 10000, and 20000;</p>\n<p>Statistics mode: There are two statistical methods to choose from: maximum value and average value;</p>\n<p>Display mode: includes three display modes: line, bar, or scatter graphs;</p>\n<p>[X] axis: The X-axis parameters include arrival time, amplitude (AMP) (dB), ASL (dB), energy (KpJ), RMS (mV), duration (us), counts, rise time (us), rise counts, peak frequency (KHz), centroid frequency (KHz), and 5 partial power spectrum segments;</p>\n<p>[X] Range: Optional [X] Custom or [X] Auto;</p>\n<p>l [X] Custom: Filter out values that are not within this range based on the maximum and minimum values entered by the user;</p>\n<p>l [X] Auto: The coordinate display range of the relevant graph will be automatically adjusted according to the data distribution situation;</p>\n<p>[Y] axis: The Y-axis parameters include amplitude (AMP) (dB), ASL (dB), energy (KpJ), RMS (mV), duration (us), counts, rise time (us), rise counts, peak frequency (KHz), centroid frequency (KHz), and 5 partial power spectrum segments;</p>\n<p>[Y] Range: Optional [Y] Custom or [Y] Auto;</p>\n<p>l [Y] Custom: Filter out values that are not within this range based on the maximum and minimum values entered by the user;</p>\n<p>l [Y] Auto: The coordinate display range of the relevant graph will be automatically adjusted according to the data distribution situation.</p>\n<p>Operation steps:</p>\n<p>Select [Product] and [Device] → Select the time frame [Created At] → Select [Points] → [Add Graph] if needed. Select [Statistics Mode] according to specific needs (e.g. Maximum) → Select [Display Mode] → select [X] axis parameter (e.g. Arrival time) → select [X] Range Auto. select [Y] axis parameter → select [Y] Range Auto. → After finish settings, click [Start Statistics] to obtain and display data. If you want to save and restore all these settings later, click [Save Settings] to save and click [Restore Settings] to restore.</p>\n<p>Fig. 6–15 Correlogram page of the cloud platform</p>\n<h1>6.3. IoT Tool</h1>\n<h1>6.3.1. AST Function</h1>\n<p>AST (Auto Sensor Testing) is to test the RAEM2 sensitivity and coupling status after installation. The function principle is to make the sending sensor (the small pop-out round surface at the bottom of RAEM2) to make a mechanical (elastic) wave which can be propagated through the tested material to the receiver sensor (the internal or external sensor of RAEM2). Based on the received wave amplitude (dB), we can decide how the sensor sensitivity and the coupling status are. AST replaces the manual pencil lead breaking testing and make the remote monitoring available and flexible. But please note that AST test only works when the device has an AST sensor built-in, such as RAEM2, BWM1 series.</p>\n<p>After the RAEM2 device is woken up and in manual control, the AST test can be performed.</p>\n<p>① Click on [IoT Tool] → [AST Test].</p>\n<p>② Select the device that need to be tested, after clicking [Submit].</p>\n<p>③ Please wait a moment to [Get Result].</p>\n<p>l Time Interval (s): The interval in seconds for sending the AST test.</p>\n<p>l Device Group: By checking this option, you can filter devices and only display the devices within the selected group.</p>\n<p>l Get Result: You can obtain the most recent AST results.</p>\n<p><img src=\"https://miro.medium.com/v2/resize:fit:1400/1*k-I5GUtzPci_C5Q7aEjz6Q.png\" alt=\"\"/></p>\n<p>Fig. 6–16 AST page and testing results</p>\n<p>\r<br/>\r<br/></p>\n</html>",
"json_metadata": "{\"tags\":[\"raem2\"],\"image\":[\"https://miro.medium.com/v2/resize:fit:1400/1*VTYdzYB0gOoTmD-kiD6KWw.png\",\"https://miro.medium.com/v2/resize:fit:1400/1*DN4Z2vbG5bmLGFwrBg63OA.png\",\"https://miro.medium.com/v2/resize:fit:1400/1*l0jAC4ZGhMLsNfT8UgRcDA.png\",\"https://miro.medium.com/v2/resize:fit:1400/1*f3S3WUQ9sI42tavUB5h9MA.png\",\"https://miro.medium.com/v2/resize:fit:940/1*406Po0mZF_Amb-4s54bFxA.png\",\"https://miro.medium.com/v2/resize:fit:1062/1*GHYABn48rMQ28P1rne-1ZQ.png\",\"https://miro.medium.com/v2/resize:fit:1098/1*jijGQUL5po_zLiDO6YXyVg.png\",\"https://miro.medium.com/v2/resize:fit:796/1*AZBW_jE0L2G-5wVIYosr4g.png\",\"https://miro.medium.com/v2/resize:fit:1214/1*KHy4sypMmpGR5_ZUdjhRCw.png\",\"https://miro.medium.com/v2/resize:fit:1400/1*RREA2jWdfL8m0ud0WurIdA.png\",\"https://miro.medium.com/v2/resize:fit:1400/1*8VRCUIlR_tcoe-t83uYCAg.png\",\"https://miro.medium.com/v2/resize:fit:692/1*iQGL8r5wzLrTqQDu_THxRQ.png\",\"https://miro.medium.com/v2/resize:fit:692/1*mpZgOA1Mhoysc_zAmmgzoQ.png\",\"https://miro.medium.com/v2/resize:fit:692/1*DcMYF8PTYMBqPcxs7dA1Yw.png\",\"https://miro.medium.com/v2/resize:fit:712/1*2B9cPyLKH_BZzwjocEMwbA.png\",\"https://miro.medium.com/v2/resize:fit:700/1*u1wMZC7QPNbMfNXFxpFf-Q.png\",\"https://miro.medium.com/v2/resize:fit:712/1*U1RnH09Q98tuzNha_FNHkg.png\",\"https://miro.medium.com/v2/resize:fit:712/1*OHKPlbkkp7zZ9ZpyQeu-mg.png\",\"https://miro.medium.com/v2/resize:fit:756/1*K_sn6Ca5Ixkg2Ipr57jM8w.png\",\"https://miro.medium.com/v2/resize:fit:712/1*8gD8PUH20auR0Hk-U2mgtA.png\",\"https://miro.medium.com/v2/resize:fit:712/1*QN2OhrIyadoStrsNT9iATw.png\",\"https://miro.medium.com/v2/resize:fit:1400/1*k-I5GUtzPci_C5Q7aEjz6Q.png\"],\"links\":[\"https://www.blogger.com/blog/post/edit/4846769717482021329/3339670695828179779#\"],\"app\":\"steemit/0.2\",\"format\":\"html\"}",
"parent_author": "",
"parent_permlink": "raem2",
"permlink": "raem2-user-s-manual-operation-guide-qawrums-ltd",
"title": "RAEM2 USER’S MANUAL Operation Guide - Qawrums Ltd"
}
],
"op_in_trx": 0,
"timestamp": "2024-12-27T05:41:06",
"trx_id": "a321ffe4d92f276017407fa4a1d23af01c947ae6",
"trx_in_block": 4,
"virtual_op": 0
}2024/12/20 20:13:42
2024/12/20 20:13:42
| delegatee | barrylee |
| delegator | steem |
| vesting shares | 16906.590303 VESTS |
| Transaction Info | Block #91404868/Trx fcf9ff5bcb4006d03445c6369740b58084b2f80b |
View Raw JSON Data
{
  "block": 91404868,
  "op": [
    "delegate_vesting_shares",
    {
      "delegatee": "barrylee",
      "delegator": "steem",
      "vesting_shares": "16906.590303 VESTS"
    }
  ],
  "op_in_trx": 0,
  "timestamp": "2024-12-20T20:13:42",
  "trx_id": "fcf9ff5bcb4006d03445c6369740b58084b2f80b",
  "trx_in_block": 0,
  "virtual_op": 0
}barryleepublished a new post: challenges-and-responses-of-acoustic-emission-testing-technology2024/12/06 10:37:45
barryleepublished a new post: challenges-and-responses-of-acoustic-emission-testing-technology
2024/12/06 10:37:45
| author | barrylee |
| body | <html> <p>Challenges and Responses of Acoustic Emission Testing Technology</p> <ol><li>Challenges Brought by the Development of Special Applications in Various Industries</li></ol> <p><img src="https://miro.medium.com/v2/resize:fit:1400/1*9gvEagdtvG6GeZBoixraXA.jpeg" alt=""/></p> <p>(1) Challenges from Advances in <a href="https://www.aendt.com/blog/acoustic-emission-testing.html">Acoustic Emission Testing</a> Methods</p> <p>Currently, most acoustic emission testing systems are effective instruments for periodic and inspection testing, and they have been widely applied in various industries. This testing method is characterized by its ability to quickly complete the entire testing process within a few hours through manually controllable loading. Once the testing is completed, no further testing is performed until the next scheduled cycle. This approach, suitable for periodic testing, is not applicable for equipment that cannot be subjected to manual loading or requires long-term monitoring. Particularly in applications requiring remote long-term real-time monitoring, there has been a lack of suitable products. For example, in long-term monitoring applications such as mines, tunnels, wind power generation, bridges, and complete sets of equipment in enterprises, monitoring operations need to be conducted from monitoring rooms that are far away from the measurement points, typically over 1,000 meters away. In these long-term real-time monitoring applications, the existing methods mainly rely on a computer acting as the main unit for the acoustic emission device, using the internet or other remote networks, with another computer acting as a client for operation. This method requires placing a computer on-site, and frequent manual operations on the client computer are necessary. Although this dual-computer communication solution can address some issues, its usage is limited in many scenarios. For instance, environments such as mines, bridges, tunnels, and those with radioactive, high-temperature, or toxic conditions are unsuitable for personnel operation. Additionally, some on-site environments may lack power supply or stable locations, making it impractical to place computers. Faced with these application challenges, there is an urgent need for the market to quickly develop a suitable remote acoustic emission monitoring system for long-term monitoring.</p> <p>Response Measures: Government and industry management agencies should provide necessary policy encouragement and financial investment. Research institutions and instrument manufacturers should increase manpower and financial investment to develop applicable technologies and equipment for remote long-term monitoring.</p> <p>(2) Challenges from the Diversity of Physical Conditions of Testing Objects</p> <p><img src="https://miro.medium.com/v2/resize:fit:1400/1*HdcYDBwiTDHoeumi6vWxPA.jpeg" alt=""/></p> <p>For <a href="https://www.aendt.com/blog/acoustic-emission-testing.html">acoustic emission testing</a> of superconducting materials, research needs to be conducted in ultra-low temperature environments, while high-temperature environments in petrochemical and metallurgy testing also pose challenges to testing instruments. For the testing of micro devices, miniaturization of sensors is essential. For high-speed particles, bullets, and other strong impact sources, low-sensitivity sensors are required. Instruments used in underwater or oil-immersed environments need to have enhanced protection levels. For holes or tanks deeper than 100 meters, the main unit of the instrument must meet the necessary intrinsic safety and explosion-proof standards. In applications involving high-voltage equipment, electrical isolation is required between the equipment operated by personnel and the on-site testing equipment to ensure operator safety. For some machining equipment, high-speed fluid devices, and equipment with rapidly changing loads, the inherent mechanical or electromagnetic noise levels are already very high, making it extremely difficult to separate effective signals related to internal defect propagation. These special application requirements cannot be fulfilled using traditional acoustic emission testing technologies and general instruments.</p> <p>Response Measures: Develop specialized testing equipment for different applications and strengthen technical exchanges within the industry. After classifying and summarizing similar industry applications, research shared acoustic emission testing technologies to avoid isolated efforts in various applications and promote communication through technical exchanges to enhance testing technology in related industries.</p> <p>2. Challenges from the Lack of Application Standards<br/>In the field of non-destructive testing, <a href="https://aendt.com/blog/acoustic-emission-testing.html">acoustic emission</a> is a unique passive testing method characterized by its principles. The vast differences in signal source conditions across various industries make it difficult to adopt a unified standard for different applications. This has led to a significant lack of necessary standards for acoustic emission testing in various industries, which has become a major obstacle to the widespread application of acoustic emission technology. Currently published acoustic emission testing standards primarily focus on special inspection industries, covering only pressure vessels, gas cylinders, atmospheric storage tanks, and composite materials. The research conducted by universities and research institutions on various testing and evaluation methods is mostly limited to theoretical studies, with few that can be applied in engineering.</p> <p>Response Measures: For applications in various industries, relevant experts should be organized by industry associations to summarize commonalities in all applications and classify them, then develop standards based on these classifications. As the number of standards increases, efforts should be made to enhance the effective coverage of standards across industries with fewer standards. The aim should be to quickly improve testing standards for various applications to pave the way for the engineering application of acoustic emission testing technology across industries.</p> <p>3. The Conflict Between Testing Costs and Popularization<br/>The cost of acoustic emission testing systems has been difficult to reduce effectively, resulting in high instrument prices that have not allowed for the same scale effects seen in other non-destructive testing instruments. This has hindered the widespread adoption and affordability of acoustic emission technology in various sectors. Moreover, for periodic and inspection testing, extensive time is required for setting up instruments, including scaffolding and wiring, which occupies much of the testing process, leading to prolonged downtime for operations and increased time costs for companies. Additionally, the substantial investigation and analysis required before and after testing needs to be managed by certified technical personnel, which adds to labor costs as many staff members must be involved in the process.</p> <p>Response Measures: To mitigate these costs, enterprises can adopt long-term monitoring systems where an initial setup covers multiple monitoring points, thus reducing the cost per unit. Specifically, integrating acoustic emission monitoring systems with other monitoring equipment during the design and manufacturing stages can streamline operations. By building in automated detection and alarm systems, routine operations can be managed by a single staff member.</p> <p>4. Awareness and Popularization Challenges of Acoustic Emission Technology<br/>As of now, the Special Equipment Non-Destructive Testing Personnel Qualification Examination Committee of the General Administration of Quality Supervision, Inspection and Quarantine of China has conducted multiple training sessions for Level II and III acoustic emission testing personnel since 2002, with nearly 700 individuals obtaining Level II and III certification. However, these professionals contribute only minimally to the overall awareness and dissemination of acoustic emission technology.</p> <p>In universities, while there are research projects related to acoustic emission, most focus on core technologies that are not inherently acoustic emission based. Instead, acoustic emission is often used merely as a supplementary tool for enhancing project evaluation. The number of researchers focusing directly on acoustic emission technology in higher education institutions and research organizations is very limited, with scarce funding allocated to such research.</p> <p>Currently, within enterprises and testing institutions, most technical personnel engaged in acoustic emission testing research lack formal training and educational background in relevant fields, leading to many research efforts being basic and still in the learning phase. These issues hinder the effective promotion of acoustic emission testing technology in China.</p> <p>Response Measures: Address these challenges at the foundational level by incorporating acoustic emission testing into the educational curriculum. Reform educational materials to include acoustic emission testing as an essential component of non-destructive testing, placing it on par with radiography, ultrasonics, and other disciplines in higher education. Furthermore, increasing government and corporate investments in acoustic emission-related testing projects will stimulate research and development efforts in institutions and colleges.</p> <p><strong>Key Players in the Acoustic Emission Testing Equipment Market in China</strong><br/>Qawrums Ltd. <a href="https://www.aendt.com/">https://www.aendt.com</a></p> <p>Leading manufacturer of acoustic emission testing equipment.<br/>Offers a range of AE testing equipment, including sensors, amplifiers, and data acquisition systems.<br/>Applications include materials testing, non-destructive testing (NDT), and structural health monitoring.<br/>China Representative of Physical Acoustics Corporation (PAC)</p> <p><strong>Provides AE sensors, instruments, and software for various applications.<br/>Applications include materials testing, structural health monitoring, and leak detection.</strong><br/>PAC is a globally recognized company in the AE testing equipment market, and the representative office in China likely provides localized support and services.<br/>QingCheng Ltd. <a href="https://ae-ndt.com/">https://ae-ndt.com</a></p> <p>Provides AE testing equipment and services for various applications.<br/>Applications include materials testing, structural health monitoring, and NDT.<br/>Vallen Systeme</p> <p>Develops and manufactures AE testing equipment, including sensors, instruments, and software for various industries, including aerospace, automotive, and energy.</p> <p> <br/> </p> </html> |
| json metadata | {"tags":["application"],"image":["https://miro.medium.com/v2/resize:fit:1400/1*9gvEagdtvG6GeZBoixraXA.jpeg","https://miro.medium.com/v2/resize:fit:1400/1*HdcYDBwiTDHoeumi6vWxPA.jpeg"],"links":["https://www.aendt.com/blog/acoustic-emission-testing.html","https://aendt.com/blog/acoustic-emission-testing.html","https://www.aendt.com/","https://ae-ndt.com/"],"app":"steemit/0.2","format":"html"} |
| parent author | |
| parent permlink | application |
| permlink | challenges-and-responses-of-acoustic-emission-testing-technology |
| title | Challenges and Responses of Acoustic Emission Testing Technology |
| Transaction Info | Block #90991137/Trx c891b02299a4656443d9a71c9b55e742badb8bff |
View Raw JSON Data
{
  "block": 90991137,
  "op": [
    "comment",
    {
      "author": "barrylee",
      "body": "<html>\n<p>Challenges and Responses of Acoustic Emission Testing Technology</p>\n<ol><li>Challenges Brought by the Development of Special Applications in Various Industries</li></ol>\n<p><img src=\"https://miro.medium.com/v2/resize:fit:1400/1*9gvEagdtvG6GeZBoixraXA.jpeg\" alt=\"\"/></p>\n<p>(1) Challenges from Advances in <a href=\"https://www.aendt.com/blog/acoustic-emission-testing.html\">Acoustic Emission Testing</a> Methods</p>\n<p>Currently, most acoustic emission testing systems are effective instruments for periodic and inspection testing, and they have been widely applied in various industries. This testing method is characterized by its ability to quickly complete the entire testing process within a few hours through manually controllable loading. Once the testing is completed, no further testing is performed until the next scheduled cycle. This approach, suitable for periodic testing, is not applicable for equipment that cannot be subjected to manual loading or requires long-term monitoring. Particularly in applications requiring remote long-term real-time monitoring, there has been a lack of suitable products. For example, in long-term monitoring applications such as mines, tunnels, wind power generation, bridges, and complete sets of equipment in enterprises, monitoring operations need to be conducted from monitoring rooms that are far away from the measurement points, typically over 1,000 meters away. In these long-term real-time monitoring applications, the existing methods mainly rely on a computer acting as the main unit for the acoustic emission device, using the internet or other remote networks, with another computer acting as a client for operation. This method requires placing a computer on-site, and frequent manual operations on the client computer are necessary. Although this dual-computer communication solution can address some issues, its usage is limited in many scenarios. For instance, environments such as mines, bridges, tunnels, and those with radioactive, high-temperature, or toxic conditions are unsuitable for personnel operation. Additionally, some on-site environments may lack power supply or stable locations, making it impractical to place computers. Faced with these application challenges, there is an urgent need for the market to quickly develop a suitable remote acoustic emission monitoring system for long-term monitoring.</p>\n<p>Response Measures: Government and industry management agencies should provide necessary policy encouragement and financial investment. Research institutions and instrument manufacturers should increase manpower and financial investment to develop applicable technologies and equipment for remote long-term monitoring.</p>\n<p>(2) Challenges from the Diversity of Physical Conditions of Testing Objects</p>\n<p><img src=\"https://miro.medium.com/v2/resize:fit:1400/1*HdcYDBwiTDHoeumi6vWxPA.jpeg\" alt=\"\"/></p>\n<p>For <a href=\"https://www.aendt.com/blog/acoustic-emission-testing.html\">acoustic emission testing</a> of superconducting materials, research needs to be conducted in ultra-low temperature environments, while high-temperature environments in petrochemical and metallurgy testing also pose challenges to testing instruments. For the testing of micro devices, miniaturization of sensors is essential. For high-speed particles, bullets, and other strong impact sources, low-sensitivity sensors are required. Instruments used in underwater or oil-immersed environments need to have enhanced protection levels. For holes or tanks deeper than 100 meters, the main unit of the instrument must meet the necessary intrinsic safety and explosion-proof standards. In applications involving high-voltage equipment, electrical isolation is required between the equipment operated by personnel and the on-site testing equipment to ensure operator safety. For some machining equipment, high-speed fluid devices, and equipment with rapidly changing loads, the inherent mechanical or electromagnetic noise levels are already very high, making it extremely difficult to separate effective signals related to internal defect propagation. These special application requirements cannot be fulfilled using traditional acoustic emission testing technologies and general instruments.</p>\n<p>Response Measures: Develop specialized testing equipment for different applications and strengthen technical exchanges within the industry. After classifying and summarizing similar industry applications, research shared acoustic emission testing technologies to avoid isolated efforts in various applications and promote communication through technical exchanges to enhance testing technology in related industries.</p>\n<p>2. Challenges from the Lack of Application Standards<br/>In the field of non-destructive testing, <a href=\"https://aendt.com/blog/acoustic-emission-testing.html\">acoustic emission</a> is a unique passive testing method characterized by its principles. The vast differences in signal source conditions across various industries make it difficult to adopt a unified standard for different applications. This has led to a significant lack of necessary standards for acoustic emission testing in various industries, which has become a major obstacle to the widespread application of acoustic emission technology. Currently published acoustic emission testing standards primarily focus on special inspection industries, covering only pressure vessels, gas cylinders, atmospheric storage tanks, and composite materials. The research conducted by universities and research institutions on various testing and evaluation methods is mostly limited to theoretical studies, with few that can be applied in engineering.</p>\n<p>Response Measures: For applications in various industries, relevant experts should be organized by industry associations to summarize commonalities in all applications and classify them, then develop standards based on these classifications. As the number of standards increases, efforts should be made to enhance the effective coverage of standards across industries with fewer standards. The aim should be to quickly improve testing standards for various applications to pave the way for the engineering application of acoustic emission testing technology across industries.</p>\n<p>3. The Conflict Between Testing Costs and Popularization<br/>The cost of acoustic emission testing systems has been difficult to reduce effectively, resulting in high instrument prices that have not allowed for the same scale effects seen in other non-destructive testing instruments. This has hindered the widespread adoption and affordability of acoustic emission technology in various sectors. Moreover, for periodic and inspection testing, extensive time is required for setting up instruments, including scaffolding and wiring, which occupies much of the testing process, leading to prolonged downtime for operations and increased time costs for companies. Additionally, the substantial investigation and analysis required before and after testing needs to be managed by certified technical personnel, which adds to labor costs as many staff members must be involved in the process.</p>\n<p>Response Measures: To mitigate these costs, enterprises can adopt long-term monitoring systems where an initial setup covers multiple monitoring points, thus reducing the cost per unit. Specifically, integrating acoustic emission monitoring systems with other monitoring equipment during the design and manufacturing stages can streamline operations. By building in automated detection and alarm systems, routine operations can be managed by a single staff member.</p>\n<p>4. Awareness and Popularization Challenges of Acoustic Emission Technology<br/>As of now, the Special Equipment Non-Destructive Testing Personnel Qualification Examination Committee of the General Administration of Quality Supervision, Inspection and Quarantine of China has conducted multiple training sessions for Level II and III acoustic emission testing personnel since 2002, with nearly 700 individuals obtaining Level II and III certification. However, these professionals contribute only minimally to the overall awareness and dissemination of acoustic emission technology.</p>\n<p>In universities, while there are research projects related to acoustic emission, most focus on core technologies that are not inherently acoustic emission based. Instead, acoustic emission is often used merely as a supplementary tool for enhancing project evaluation. The number of researchers focusing directly on acoustic emission technology in higher education institutions and research organizations is very limited, with scarce funding allocated to such research.</p>\n<p>Currently, within enterprises and testing institutions, most technical personnel engaged in acoustic emission testing research lack formal training and educational background in relevant fields, leading to many research efforts being basic and still in the learning phase. These issues hinder the effective promotion of acoustic emission testing technology in China.</p>\n<p>Response Measures: Address these challenges at the foundational level by incorporating acoustic emission testing into the educational curriculum. Reform educational materials to include acoustic emission testing as an essential component of non-destructive testing, placing it on par with radiography, ultrasonics, and other disciplines in higher education. Furthermore, increasing government and corporate investments in acoustic emission-related testing projects will stimulate research and development efforts in institutions and colleges.</p>\n<p><strong>Key Players in the Acoustic Emission Testing Equipment Market in China</strong><br/>Qawrums Ltd. <a href=\"https://www.aendt.com/\">https://www.aendt.com</a></p>\n<p>Leading manufacturer of acoustic emission testing equipment.<br/>Offers a range of AE testing equipment, including sensors, amplifiers, and data acquisition systems.<br/>Applications include materials testing, non-destructive testing (NDT), and structural health monitoring.<br/>China Representative of Physical Acoustics Corporation (PAC)</p>\n<p><strong>Provides AE sensors, instruments, and software for various applications.<br/>Applications include materials testing, structural health monitoring, and leak detection.</strong><br/>PAC is a globally recognized company in the AE testing equipment market, and the representative office in China likely provides localized support and services.<br/>QingCheng Ltd. <a href=\"https://ae-ndt.com/\">https://ae-ndt.com</a></p>\n<p>Provides AE testing equipment and services for various applications.<br/>Applications include materials testing, structural health monitoring, and NDT.<br/>Vallen Systeme</p>\n<p>Develops and manufactures AE testing equipment, including sensors, instruments, and software for various industries, including aerospace, automotive, and energy.</p>\n<p>\r<br/>\r</p>\n</html>",
      "json_metadata": "{\"tags\":[\"application\"],\"image\":[\"https://miro.medium.com/v2/resize:fit:1400/1*9gvEagdtvG6GeZBoixraXA.jpeg\",\"https://miro.medium.com/v2/resize:fit:1400/1*HdcYDBwiTDHoeumi6vWxPA.jpeg\"],\"links\":[\"https://www.aendt.com/blog/acoustic-emission-testing.html\",\"https://aendt.com/blog/acoustic-emission-testing.html\",\"https://www.aendt.com/\",\"https://ae-ndt.com/\"],\"app\":\"steemit/0.2\",\"format\":\"html\"}",
      "parent_author": "",
      "parent_permlink": "application",
      "permlink": "challenges-and-responses-of-acoustic-emission-testing-technology",
      "title": "Challenges and Responses of Acoustic Emission Testing Technology"
    }
  ],
  "op_in_trx": 0,
  "timestamp": "2024-12-06T10:37:45",
  "trx_id": "c891b02299a4656443d9a71c9b55e742badb8bff",
  "trx_in_block": 2,
  "virtual_op": 0
}2024/11/15 10:30:39
2024/11/15 10:30:39
| author | barrylee |
| body | <html> <p>Acoustic Emission (AE) Testing Market — A Global and Regional Analysis: Focus on End-use Industry, Equipment Type, Service, and Region — Analysis and Forecast, 2024–2034</p> <p>The global <a href="https://www.aendt.com/blog/acoustic-emission-testing.html">acoustic emission testing</a> market is on a growth trajectory, influenced by several critical factors and market dynamics. Considering the optimistic scenario the market is valued at $395.21 million in 2024 and is expected to grow at a CAGR of 6.64% to reach $751.97 million by 2034. This market expansion is primarily driven by the increasing demand for non-destructive testing techniques in various sectors such as infrastructure, oil and gas, and manufacturing, where acoustic emission testing plays a vital role in structural health monitoring and defect detection.</p> <p><img src="https://miro.medium.com/v2/resize:fit:1200/0*kLtcKBl_shiOquLX.png" alt=""/></p> <p>Innovations in sensor technology and the development of advanced acoustic emission testing equipment are key contributors to market growth. These advancements facilitate more accurate, reliable, and efficient monitoring of structural integrity, aiding in the early detection of faults and preventing potential failures. The integration of AI and machine learning algorithms further enhances the capabilities of acoustic emission testing systems, enabling predictive maintenance and real-time analytics.</p> <p>Regulatory standards and safety regulations also significantly impact market progression. Stricter safety norms across industries necessitate regular inspection and maintenance of assets, propelling the adoption of acoustic emission testing methods. These regulations ensure operational safety and compliance, driving the need for advanced testing solutions.</p> <p>The digital transformation of the industrial sector, along with increased investments in maintenance 4.0 technologies, highlights the potential for substantial growth in the acoustic emission testing market. As industries move towards more sophisticated and automated testing methods to optimize operational efficiency and ensure safety, the demand for acoustic emission testing solutions is expected to see robust growth, underlined by the need for innovative and effective non-destructive testing methods.</p> <h1>Market Segmentation</h1> <h1>Segmentation 1: by End Use Industry</h1> <ul><li>Chemical and Petrochemical</li><li>Oil and Gas</li><li>Energy and Power</li><li>Automotive</li><li>Food and Beverages</li><li>Healthcare</li><li>Aerospace</li><li>Others</li></ul> <h1>Segmentation 2: by Equipment Type</h1> <ul><li>Sensors</li><li>Amplifiers</li><li>Detection Instruments</li><li>Calibrators</li><li>Others</li></ul> <h1>Segmentation 3: by Service</h1> <ul><li>Inspection</li><li>Calibration</li></ul> <h1>Segmentation 4: by Region</h1> <ul><li>North America</li><li>Europe</li><li>Asia-Pacific</li><li>Rest-of-the-World</li></ul> <h1>Key Market Players and Competition Synopsis</h1> <p>The companies that are profiled in the global acoustic emission testing market have been selected based on input gathered from primary experts and analyzing company coverage, product portfolio, and market penetration.</p> <h1>Some of the prominent companies in this market are:</h1> <ul><li>TÜV Rheinland</li><li>PARKER HANNIFIN CORP</li><li>Vallen Systeme GmbH</li><li>Qawrums Ltd</li><li>GENERAL ELECTRIC</li><li>MISTRAS Group</li><li>KRN Services</li></ul> <h1>Key Questions Answered in this Report:</h1> <ul><li>What are the main factors driving the demand for acoustic emission testing market?</li><li>What are the major patents filed by the companies active in the global acoustic emission testing market?</li><li>Who are the key players in the global acoustic emission testing market, and what are their respective market shares?</li><li>What partnerships or collaborations are prominent among stakeholders in the global acoustic emission testing market?</li><li>What are the strategies adopted by the key companies to gain a competitive edge in acoustic emission testing industry?</li><li>What is the futuristic outlook for the acoustic emission testing market in terms of growth potential?</li><li>What is the current estimation of the global acoustic emission testing market, and what growth trajectory is projected from 2024 to 2034?</li><li>Which application, and product segment is expected to lead the market over the forecast period (2024–2034)?</li><li>What could be the impact of growing end-use industries in the global acoustic emission testing market?</li><li>Which regions demonstrate the highest adoption rates for global acoustic emission testing market, and what factors contribute to their leadership?</li></ul> <h1>Table of Contents</h1> <p><strong>Executive Summary</strong></p> <p><strong>Scope and Definition</strong></p> <p><strong>Market/Product Definition</strong></p> <p><strong>Key Questions Answered</strong></p> <p><strong>Analysis and Forecast Note</strong></p> <p><strong>1. Markets: Industry Outlook</strong></p> <ol><li>1 Trends: Current and Future Impact Assessment<br/>1.1.1 Increasing Integration of Advanced Technologies<br/>1.1.2 Increased Demand in Renewable Energy Sector<br/>1.2 Supply Chain Overview<br/>1.2.1 Value Chain Analysis<br/>1.2.2 Market Map<br/>1.3 R&D Review<br/>1.3.1 Patent Filing Trend by Country, by Company<br/>1.4 Regulatory Landscape<br/>1.5 Stakeholder Analysis<br/>1.5.1 Use Case<br/>1.5.2 End User and Buying Criteria<br/>1.6 Impact Analysis for Key Global Events<br/>1.7 Market Dynamics Overview<br/>1.7.1 Market Drivers<br/>1.7.2 Market Restraints<br/>1.7.3 Market Opportunities</li></ol> <p><strong>2. Global Acoustic Emission Testing Market by Application</strong></p> <p>2.1 Application Segmentation<br/>2.2 Application Summary<br/>2.3 Global Acoustic Emission Testing Market by End Use Industry<br/>2.3.1 Chemical and Petrochemical<br/>2.3.2 Oil and Gas<br/>2.3.3 Energy and Power<br/>2.3.4 Automotive<br/>2.3.5 Food and Beverages<br/>2.3.6 Healthcare<br/>2.3.7 Aerospace<br/>2.3.8 Others</p> <p><strong>3. Global Acoustic Emission Testing Market by Products</strong></p> <p>3.1 Product Segmentation<br/>3.2 Product Summary<br/>3.3 Global Acoustic Emission Testing Market by Equipment Type<br/>3.3.1 Sensors<br/>3.3.2 Amplifiers<br/>3.3.3 Detection Instruments<br/>3.3.4 Calibrators<br/>3.3.5 Others<br/>3.4 Global Acoustic Emission Testing Market by Service<br/>3.4.1 Inspection<br/>3.4.2 Calibration</p> <p><strong>4. Global Acoustic Emission Testing Market by Region</strong></p> <p>4.1 Global Acoustic Emission Testing Market — by Region<br/>4.2 North America<br/>4.2.1 Regional Overview<br/>4.2.2 Driving Factors for Market Growth<br/>4.2.3 Factors Challenging the Market<br/>4.2.4 Application<br/>4.2.5 Product<br/>4.2.6 U.S.<br/>4.2.6.1 Market by Application<br/>4.2.6.2 Market by Product<br/>4.2.7 Canada<br/>4.2.7.1 Market by Application<br/>4.2.7.2 Market by Product<br/>4.2.8 Mexico<br/>4.2.8.1 Market by Application<br/>4.2.8.2 Market by Product<br/>4.3 Europe<br/>4.3.1 Regional Overview<br/>4.3.2 Driving Factors for Market Growth<br/>4.3.3 Factors Challenging the Market<br/>4.3.4 Application<br/>4.3.5 Product<br/>4.3.6 Germany<br/>4.3.6.1 Market by Application<br/>4.3.6.2 Market by Product<br/>4.3.7 France<br/>4.3.7.1 Market by Application<br/>4.3.7.2 Market by Product<br/>4.3.8 Italy<br/>4.3.8.1 Market by Application<br/>4.3.8.2 Market by Product<br/>4.3.9 Spain<br/>4.3.9.1 Market by Application<br/>4.3.9.2 Market by Product<br/>4.3.10 U.K.<br/>4.3.10.1 Market by Application<br/>4.3.10.2 Market by Product<br/>4.3.11 Rest-of-Europe<br/>4.3.11.1 Market by Application<br/>4.3.11.2 Market by Product<br/>4.4 Asia-Pacific<br/>4.4.1 Regional Overview<br/>4.4.2 Driving Factors for Market Growth<br/>4.4.3 Factors Challenging the Market<br/>4.4.4 Application<br/>4.4.5 Product<br/>4.4.6 China<br/>4.4.6.1 Market by Application<br/>4.4.6.2 Market by Product<br/>4.4.7 Japan<br/>4.4.7.1 Market by Application<br/>4.4.7.2 Market by Product<br/>4.4.8 India<br/>4.4.8.1 Market by Application<br/>4.4.8.2 Market by Product<br/>4.4.9 South Korea<br/>4.4.9.1 Market by Application<br/>4.4.9.2 Market by Product<br/>4.4.10 Rest-of-Asia-Pacific<br/>4.4.10.1 Market by Application<br/>4.4.10.2 Market by Product<br/>4.5 Rest-of-the-World<br/>4.5.1 Regional Overview<br/>4.5.2 Driving Factors for Market Growth<br/>4.5.3 Factors Challenging the Market<br/>4.5.4 Application<br/>4.5.5 Product<br/>4.5.6 South America<br/>4.5.6.1 Market by Application<br/>4.5.6.2 Market by Product<br/>4.5.7 Middle East and Africa<br/>4.5.7.1 Market by Application<br/>4.5.7.2 Market by Product</p> <p><strong>5. Companies Profiled</strong></p> <p>5.1 Next Frontiers<br/>5.2 Geographic Assessment<br/>5.2.1 MISTRAS Group<br/>5.2.1.1 Overview<br/>5.2.1.2 Top Products/Product Portfolio<br/>5.2.1.3 Top Competitors<br/>5.2.1.4 Target Customers<br/>5.2.1.5 Key Personnel<br/>5.2.1.6 Analyst View<br/>5.2.1.7 Market Share<br/>5.2.2 GENERAL ELECTRIC<br/>5.2.2.1 Overview<br/>5.2.2.2 Top Products/Product Portfolio<br/>5.2.2.3 Top Competitors<br/>5.2.2.4 Target Customers<br/>5.2.2.5 Key Personnel<br/>5.2.2.6 Analyst View<br/>5.2.2.7 Market Share<br/>5.2.3 PARKER HANNIFIN CORP<br/>5.2.3.1 Overview<br/>5.2.3.2 Top Products/Product Portfolio<br/>5.2.3.3 Top Competitors<br/>5.2.3.4 Target Customers<br/>5.2.3.5 Key Personnel<br/>5.2.3.6 Analyst View<br/>5.2.3.7 Market Share<br/>5.2.4 QAWRUMS LTD<br/>5.2.4.1 Overview<br/>5.2.4.2 Top Products/Product Portfolio<br/>5.2.4.3 Top Competitors<br/>5.2.4.4 Target Customers<br/>5.2.4.5 Key Personnel<br/>5.2.4.6 Analyst View<br/>5.2.4.7 Market Share<br/>5.2.5 Vallen Systeme GmbH<br/>5.2.5.1 Overview<br/>5.2.5.2 Top Products/Product Portfolio<br/>5.2.5.3 Top Competitors<br/>5.2.5.4 Target Customers<br/>5.2.5.5 Key Personnel<br/>5.2.5.6 Analyst View<br/>5.2.5.7 Market Share<br/>5.2.6 KRN Services<br/>5.2.6.1 Overview<br/>5.2.6.2 Top Products/Product Portfolio<br/>5.2.6.3 Top Competitors<br/>5.2.6.4 Target Customers<br/>5.2.6.5 Key Personnel<br/>5.2.6.6 Analyst View<br/>5.2.6.7 Market Share<br/>5.2.7 TÜV Rheinland<br/>5.2.7.1 Overview<br/>5.2.7.2 Top Products/Product Portfolio<br/>5.2.7.3 Top Competitors<br/>5.2.7.4 Target Customers<br/>5.2.7.5 Key Personnel<br/>5.2.7.6 Analyst View<br/>5.2.7.7 Market Share<br/>5.2.8 Arudra Engineers Pvt.Lrd.<br/>5.2.8.1 Overview<br/>5.2.8.2 Top Products/Product Portfolio<br/>5.2.8.3 Top Competitors<br/>5.2.8.4 Target Customers<br/>5.2.8.5 Key Personnel<br/>5.2.8.6 Analyst View<br/>5.2.8.7 Market Share<br/>5.2.9 Stress Engineering Services, Inc<br/>5.2.9.1 Overview<br/>5.2.9.2 Top Products/Product Portfolio<br/>5.2.9.3 Top Competitors<br/>5.2.9.4 Target Customers<br/>5.2.9.5 Key Personnel<br/>5.2.9.6 Analyst View<br/>5.2.9.7 Market Share<br/>5.2.10 FIBA Technologies, Inc.<br/>5.2.10.1 Overview<br/>5.2.10.2 Top Products/Product Portfolio<br/>5.2.10.3 Top Competitors<br/>5.2.10.4 Target Customers<br/>5.2.10.5 Key Personnel<br/>5.2.10.6 Analyst View<br/>5.2.10.7 Market Share<br/>5.2.11 Acuren<br/>5.2.11.1 Overview<br/>5.2.11.2 Top Products/Product Portfolio<br/>5.2.11.3 Top Competitors<br/>5.2.11.4 Target Customers<br/>5.2.11.5 Key Personnel<br/>5.2.11.6 Analyst View<br/>5.2.11.7 Market Share<br/>5.2.12 IRISNDT<br/>5.2.12.1 Overview<br/>5.2.12.2 Top Products/Product Portfolio<br/>5.2.12.3 Top Competitors<br/>5.2.12.4 Target Customers<br/>5.2.12.5 Key Personnel<br/>5.2.12.6 Analyst View<br/>5.2.12.7 Market Share<br/>5.2.13 Blue Star Engineering & Electronics Ltd.<br/>5.2.13.1 Overview<br/>5.2.13.2 Top Products/Product Portfolio<br/>5.2.13.3 Top Competitors<br/>5.2.13.4 Target Customers<br/>5.2.13.5 Key Personnel<br/>5.2.13.6 Analyst View<br/>5.2.13.7 Market Share<br/>5.2.14 RTE Akustik + Prüftechnik GmbH<br/>5.2.14.1 Overview<br/>5.2.14.2 Top Products/Product Portfolio<br/>5.2.14.3 Top Competitors<br/>5.2.14.4 Target Customers<br/>5.2.14.5 Key Personnel<br/>5.2.14.6 Analyst View<br/>5.2.14.7 Market Share<br/>5.2.15 Swiss Approval International<br/>5.2.15.1 Overview<br/>5.2.15.2 Top Products/Product Portfolio<br/>5.2.15.3 Top Competitors<br/>5.2.15.4 Target Customers<br/>5.2.15.5 Key Personnel<br/>5.2.15.6 Analyst View<br/>5.2.15.7 Market Share<br/>5.2.16 Others</p> <p><strong>6. Research Methodology</strong></p> <h1>Companies Mentioned</h1> <ul><li>MISTRAS Group</li><li>GENERAL ELECTRIC</li><li>PARKER HANNIFIN CORP</li><li>QAWRUMS LTD</li><li>Vallen Systeme GmbH</li><li>KRN Services</li><li>TÜV Rheinland</li><li>Arudra Engineers Pvt.Lrd.</li><li>Stress Engineering Services, Inc</li><li>FIBA Technologies, Inc.</li><li>Acuren</li><li>IRISNDT</li><li>Blue Star Engineering & Electronics Ltd.</li><li>RTE Akustik + Prüftechnik GmbH</li><li>Swiss Approval International</li></ul> <h1>Table Information</h1> <p>Report AttributeDetailsNo. of Pages100PublishedMay 2024Forecast Period2024–2034Estimated Market Value ( USD ) in 2024$ 395.21 MillionForecasted Market Value ( USD ) by 2034$ 751.97 MillionCompound Annual Growth Rate6.6%Regions CoveredGlobalNo. of Companies Mentioned15</p> <h1>Related Topics</h1> <ul><li><a href="https://www.aendt.com/blog/acousic-emission-testing.html">Acoustic Emission Test</a></li><li><a href="https://www.aendt.com/">Acoustic Emission</a></li><li><a href="https://www.researchandmarkets.com/categories/engineering#rtc">Engineering</a></li></ul> <h1>Related Reports</h1> <p><img src="https://miro.medium.com/v2/resize:fit:120/0*C-dTsSx1P7-MQ3aL.jpg" alt=""/></p> <h1><a href="https://www.researchandmarkets.com/report/acoustic-emission-test#rela0-5968666">Acoustic Emission Testing Market by Component, Source Location Techniques, Services, Application — Global Forecast 2025–2030</a></h1> <p><img src="https://miro.medium.com/v2/resize:fit:120/0*UbJBRlDX5Xr6LGs6.jpg" alt=""/></p> <h1><a href="https://www.researchandmarkets.com/reports/5929174/acoustic-emission-testing-market-report-trends#rela1-5968666">Acoustic Emission Testing Market Report: Trends, Forecast and Competitive Analysis to 2030</a></h1> <p><img src="https://miro.medium.com/v2/resize:fit:120/0*7tEKF7kGQP9guaNK.jpg" alt=""/></p> <h1><a href="https://www.researchandmarkets.com/reports/4804536/acoustic-emission-testing-global-strategic#rela2-5968666">Acoustic Emission Testing — Global Strategic Business Report</a></h1> <p><img src="https://miro.medium.com/v2/resize:fit:120/0*WoOrHfG3VTRf3mOJ.jpg" alt=""/></p> <h1><a href="https://www.researchandmarkets.com/report/non-destructive-testing#rela3-5968666">NDT and Inspection Market by Technique (Ultrasonic Testing, Visual, Magnetic Particle, Liquid Penetration, Eddy-Current, Radiographic, Acoustic Emission), Service, Method, Vertical, Application and Region — Forecast to 2029</a></h1> <p><img src="https://miro.medium.com/v2/resize:fit:120/0*mOBnEv5H21N905fZ.jpg" alt=""/></p> <h1><a href="https://www.researchandmarkets.com/reports/5914732/global-forecast-acoustic-emission-testing#rela4-5968666">2024 Global Forecast for Acoustic Emission Testing Market (2025–2030 Outlook)-High Tech & Emerging Markets Report</a></h1> <p> <br/> <br/></p> </html> |
| json metadata | {"tags":["market"],"image":["https://miro.medium.com/v2/resize:fit:1200/0*kLtcKBl_shiOquLX.png","https://miro.medium.com/v2/resize:fit:120/0*C-dTsSx1P7-MQ3aL.jpg","https://miro.medium.com/v2/resize:fit:120/0*UbJBRlDX5Xr6LGs6.jpg","https://miro.medium.com/v2/resize:fit:120/0*7tEKF7kGQP9guaNK.jpg","https://miro.medium.com/v2/resize:fit:120/0*WoOrHfG3VTRf3mOJ.jpg","https://miro.medium.com/v2/resize:fit:120/0*mOBnEv5H21N905fZ.jpg"],"links":["https://www.aendt.com/blog/acoustic-emission-testing.html","https://www.aendt.com/blog/acousic-emission-testing.html","https://www.aendt.com/","https://www.researchandmarkets.com/categories/engineering#rtc","https://www.researchandmarkets.com/report/acoustic-emission-test#rela0-5968666","https://www.researchandmarkets.com/reports/5929174/acoustic-emission-testing-market-report-trends#rela1-5968666","https://www.researchandmarkets.com/reports/4804536/acoustic-emission-testing-global-strategic#rela2-5968666","https://www.researchandmarkets.com/report/non-destructive-testing#rela3-5968666","https://www.researchandmarkets.com/reports/5914732/global-forecast-acoustic-emission-testing#rela4-5968666"],"app":"steemit/0.2","format":"html"} |
| parent author | |
| parent permlink | market |
| permlink | acoustic-emission-ae-testing-market-a-global-and-regional-analysis-focus-on-end-use-industry-equipment-type-service-and-region |
| title | Acoustic Emission (AE) Testing Market — A Global and Regional Analysis: Focus on End-use Industry, Equipment Type, Service, and Region — Analysis and Forecast, 2024–2034 |
| Transaction Info | Block #90387624/Trx ca3c9980b2a4a795611909146c29c23e5da13b87 |
View Raw JSON Data
{
"block": 90387624,
"op": [
"comment",
{
"author": "barrylee",
"body": "<html>\n<p>Acoustic Emission (AE) Testing Market — A Global and Regional Analysis: Focus on End-use Industry, Equipment Type, Service, and Region — Analysis and Forecast, 2024–2034</p>\n<p>The global <a href=\"https://www.aendt.com/blog/acoustic-emission-testing.html\">acoustic emission testing</a> market is on a growth trajectory, influenced by several critical factors and market dynamics. Considering the optimistic scenario the market is valued at $395.21 million in 2024 and is expected to grow at a CAGR of 6.64% to reach $751.97 million by 2034. This market expansion is primarily driven by the increasing demand for non-destructive testing techniques in various sectors such as infrastructure, oil and gas, and manufacturing, where acoustic emission testing plays a vital role in structural health monitoring and defect detection.</p>\n<p><img src=\"https://miro.medium.com/v2/resize:fit:1200/0*kLtcKBl_shiOquLX.png\" alt=\"\"/></p>\n<p>Innovations in sensor technology and the development of advanced acoustic emission testing equipment are key contributors to market growth. These advancements facilitate more accurate, reliable, and efficient monitoring of structural integrity, aiding in the early detection of faults and preventing potential failures. The integration of AI and machine learning algorithms further enhances the capabilities of acoustic emission testing systems, enabling predictive maintenance and real-time analytics.</p>\n<p>Regulatory standards and safety regulations also significantly impact market progression. Stricter safety norms across industries necessitate regular inspection and maintenance of assets, propelling the adoption of acoustic emission testing methods. These regulations ensure operational safety and compliance, driving the need for advanced testing solutions.</p>\n<p>The digital transformation of the industrial sector, along with increased investments in maintenance 4.0 technologies, highlights the potential for substantial growth in the acoustic emission testing market. As industries move towards more sophisticated and automated testing methods to optimize operational efficiency and ensure safety, the demand for acoustic emission testing solutions is expected to see robust growth, underlined by the need for innovative and effective non-destructive testing methods.</p>\n<h1>Market Segmentation</h1>\n<h1>Segmentation 1: by End Use Industry</h1>\n<ul><li>Chemical and Petrochemical</li><li>Oil and Gas</li><li>Energy and Power</li><li>Automotive</li><li>Food and Beverages</li><li>Healthcare</li><li>Aerospace</li><li>Others</li></ul>\n<h1>Segmentation 2: by Equipment Type</h1>\n<ul><li>Sensors</li><li>Amplifiers</li><li>Detection Instruments</li><li>Calibrators</li><li>Others</li></ul>\n<h1>Segmentation 3: by Service</h1>\n<ul><li>Inspection</li><li>Calibration</li></ul>\n<h1>Segmentation 4: by Region</h1>\n<ul><li>North America</li><li>Europe</li><li>Asia-Pacific</li><li>Rest-of-the-World</li></ul>\n<h1>Key Market Players and Competition Synopsis</h1>\n<p>The companies that are profiled in the global acoustic emission testing market have been selected based on input gathered from primary experts and analyzing company coverage, product portfolio, and market penetration.</p>\n<h1>Some of the prominent companies in this market are:</h1>\n<ul><li>TÜV Rheinland</li><li>PARKER HANNIFIN CORP</li><li>Vallen Systeme GmbH</li><li>Qawrums Ltd</li><li>GENERAL ELECTRIC</li><li>MISTRAS Group</li><li>KRN Services</li></ul>\n<h1>Key Questions Answered in this Report:</h1>\n<ul><li>What are the main factors driving the demand for acoustic emission testing market?</li><li>What are the major patents filed by the companies active in the global acoustic emission testing market?</li><li>Who are the key players in the global acoustic emission testing market, and what are their respective market shares?</li><li>What partnerships or collaborations are prominent among stakeholders in the global acoustic emission testing market?</li><li>What are the strategies adopted by the key companies to gain a competitive edge in acoustic emission testing industry?</li><li>What is the futuristic outlook for the acoustic emission testing market in terms of growth potential?</li><li>What is the current estimation of the global acoustic emission testing market, and what growth trajectory is projected from 2024 to 2034?</li><li>Which application, and product segment is expected to lead the market over the forecast period (2024–2034)?</li><li>What could be the impact of growing end-use industries in the global acoustic emission testing market?</li><li>Which regions demonstrate the highest adoption rates for global acoustic emission testing market, and what factors contribute to their leadership?</li></ul>\n<h1>Table of Contents</h1>\n<p><strong>Executive Summary</strong></p>\n<p><strong>Scope and Definition</strong></p>\n<p><strong>Market/Product Definition</strong></p>\n<p><strong>Key Questions Answered</strong></p>\n<p><strong>Analysis and Forecast Note</strong></p>\n<p><strong>1. Markets: Industry Outlook</strong></p>\n<ol><li>1 Trends: Current and Future Impact Assessment<br/>1.1.1 Increasing Integration of Advanced Technologies<br/>1.1.2 Increased Demand in Renewable Energy Sector<br/>1.2 Supply Chain Overview<br/>1.2.1 Value Chain Analysis<br/>1.2.2 Market Map<br/>1.3 R&D Review<br/>1.3.1 Patent Filing Trend by Country, by Company<br/>1.4 Regulatory Landscape<br/>1.5 Stakeholder Analysis<br/>1.5.1 Use Case<br/>1.5.2 End User and Buying Criteria<br/>1.6 Impact Analysis for Key Global Events<br/>1.7 Market Dynamics Overview<br/>1.7.1 Market Drivers<br/>1.7.2 Market Restraints<br/>1.7.3 Market Opportunities</li></ol>\n<p><strong>2. Global Acoustic Emission Testing Market by Application</strong></p>\n<p>2.1 Application Segmentation<br/>2.2 Application Summary<br/>2.3 Global Acoustic Emission Testing Market by End Use Industry<br/>2.3.1 Chemical and Petrochemical<br/>2.3.2 Oil and Gas<br/>2.3.3 Energy and Power<br/>2.3.4 Automotive<br/>2.3.5 Food and Beverages<br/>2.3.6 Healthcare<br/>2.3.7 Aerospace<br/>2.3.8 Others</p>\n<p><strong>3. Global Acoustic Emission Testing Market by Products</strong></p>\n<p>3.1 Product Segmentation<br/>3.2 Product Summary<br/>3.3 Global Acoustic Emission Testing Market by Equipment Type<br/>3.3.1 Sensors<br/>3.3.2 Amplifiers<br/>3.3.3 Detection Instruments<br/>3.3.4 Calibrators<br/>3.3.5 Others<br/>3.4 Global Acoustic Emission Testing Market by Service<br/>3.4.1 Inspection<br/>3.4.2 Calibration</p>\n<p><strong>4. Global Acoustic Emission Testing Market by Region</strong></p>\n<p>4.1 Global Acoustic Emission Testing Market — by Region<br/>4.2 North America<br/>4.2.1 Regional Overview<br/>4.2.2 Driving Factors for Market Growth<br/>4.2.3 Factors Challenging the Market<br/>4.2.4 Application<br/>4.2.5 Product<br/>4.2.6 U.S.<br/>4.2.6.1 Market by Application<br/>4.2.6.2 Market by Product<br/>4.2.7 Canada<br/>4.2.7.1 Market by Application<br/>4.2.7.2 Market by Product<br/>4.2.8 Mexico<br/>4.2.8.1 Market by Application<br/>4.2.8.2 Market by Product<br/>4.3 Europe<br/>4.3.1 Regional Overview<br/>4.3.2 Driving Factors for Market Growth<br/>4.3.3 Factors Challenging the Market<br/>4.3.4 Application<br/>4.3.5 Product<br/>4.3.6 Germany<br/>4.3.6.1 Market by Application<br/>4.3.6.2 Market by Product<br/>4.3.7 France<br/>4.3.7.1 Market by Application<br/>4.3.7.2 Market by Product<br/>4.3.8 Italy<br/>4.3.8.1 Market by Application<br/>4.3.8.2 Market by Product<br/>4.3.9 Spain<br/>4.3.9.1 Market by Application<br/>4.3.9.2 Market by Product<br/>4.3.10 U.K.<br/>4.3.10.1 Market by Application<br/>4.3.10.2 Market by Product<br/>4.3.11 Rest-of-Europe<br/>4.3.11.1 Market by Application<br/>4.3.11.2 Market by Product<br/>4.4 Asia-Pacific<br/>4.4.1 Regional Overview<br/>4.4.2 Driving Factors for Market Growth<br/>4.4.3 Factors Challenging the Market<br/>4.4.4 Application<br/>4.4.5 Product<br/>4.4.6 China<br/>4.4.6.1 Market by Application<br/>4.4.6.2 Market by Product<br/>4.4.7 Japan<br/>4.4.7.1 Market by Application<br/>4.4.7.2 Market by Product<br/>4.4.8 India<br/>4.4.8.1 Market by Application<br/>4.4.8.2 Market by Product<br/>4.4.9 South Korea<br/>4.4.9.1 Market by Application<br/>4.4.9.2 Market by Product<br/>4.4.10 Rest-of-Asia-Pacific<br/>4.4.10.1 Market by Application<br/>4.4.10.2 Market by Product<br/>4.5 Rest-of-the-World<br/>4.5.1 Regional Overview<br/>4.5.2 Driving Factors for Market Growth<br/>4.5.3 Factors Challenging the Market<br/>4.5.4 Application<br/>4.5.5 Product<br/>4.5.6 South America<br/>4.5.6.1 Market by Application<br/>4.5.6.2 Market by Product<br/>4.5.7 Middle East and Africa<br/>4.5.7.1 Market by Application<br/>4.5.7.2 Market by Product</p>\n<p><strong>5. Companies Profiled</strong></p>\n<p>5.1 Next Frontiers<br/>5.2 Geographic Assessment<br/>5.2.1 MISTRAS Group<br/>5.2.1.1 Overview<br/>5.2.1.2 Top Products/Product Portfolio<br/>5.2.1.3 Top Competitors<br/>5.2.1.4 Target Customers<br/>5.2.1.5 Key Personnel<br/>5.2.1.6 Analyst View<br/>5.2.1.7 Market Share<br/>5.2.2 GENERAL ELECTRIC<br/>5.2.2.1 Overview<br/>5.2.2.2 Top Products/Product Portfolio<br/>5.2.2.3 Top Competitors<br/>5.2.2.4 Target Customers<br/>5.2.2.5 Key Personnel<br/>5.2.2.6 Analyst View<br/>5.2.2.7 Market Share<br/>5.2.3 PARKER HANNIFIN CORP<br/>5.2.3.1 Overview<br/>5.2.3.2 Top Products/Product Portfolio<br/>5.2.3.3 Top Competitors<br/>5.2.3.4 Target Customers<br/>5.2.3.5 Key Personnel<br/>5.2.3.6 Analyst View<br/>5.2.3.7 Market Share<br/>5.2.4 QAWRUMS LTD<br/>5.2.4.1 Overview<br/>5.2.4.2 Top Products/Product Portfolio<br/>5.2.4.3 Top Competitors<br/>5.2.4.4 Target Customers<br/>5.2.4.5 Key Personnel<br/>5.2.4.6 Analyst View<br/>5.2.4.7 Market Share<br/>5.2.5 Vallen Systeme GmbH<br/>5.2.5.1 Overview<br/>5.2.5.2 Top Products/Product Portfolio<br/>5.2.5.3 Top Competitors<br/>5.2.5.4 Target Customers<br/>5.2.5.5 Key Personnel<br/>5.2.5.6 Analyst View<br/>5.2.5.7 Market Share<br/>5.2.6 KRN Services<br/>5.2.6.1 Overview<br/>5.2.6.2 Top Products/Product Portfolio<br/>5.2.6.3 Top Competitors<br/>5.2.6.4 Target Customers<br/>5.2.6.5 Key Personnel<br/>5.2.6.6 Analyst View<br/>5.2.6.7 Market Share<br/>5.2.7 TÜV Rheinland<br/>5.2.7.1 Overview<br/>5.2.7.2 Top Products/Product Portfolio<br/>5.2.7.3 Top Competitors<br/>5.2.7.4 Target Customers<br/>5.2.7.5 Key Personnel<br/>5.2.7.6 Analyst View<br/>5.2.7.7 Market Share<br/>5.2.8 Arudra Engineers Pvt.Lrd.<br/>5.2.8.1 Overview<br/>5.2.8.2 Top Products/Product Portfolio<br/>5.2.8.3 Top Competitors<br/>5.2.8.4 Target Customers<br/>5.2.8.5 Key Personnel<br/>5.2.8.6 Analyst View<br/>5.2.8.7 Market Share<br/>5.2.9 Stress Engineering Services, Inc<br/>5.2.9.1 Overview<br/>5.2.9.2 Top Products/Product Portfolio<br/>5.2.9.3 Top Competitors<br/>5.2.9.4 Target Customers<br/>5.2.9.5 Key Personnel<br/>5.2.9.6 Analyst View<br/>5.2.9.7 Market Share<br/>5.2.10 FIBA Technologies, Inc.<br/>5.2.10.1 Overview<br/>5.2.10.2 Top Products/Product Portfolio<br/>5.2.10.3 Top Competitors<br/>5.2.10.4 Target Customers<br/>5.2.10.5 Key Personnel<br/>5.2.10.6 Analyst View<br/>5.2.10.7 Market Share<br/>5.2.11 Acuren<br/>5.2.11.1 Overview<br/>5.2.11.2 Top Products/Product Portfolio<br/>5.2.11.3 Top Competitors<br/>5.2.11.4 Target Customers<br/>5.2.11.5 Key Personnel<br/>5.2.11.6 Analyst View<br/>5.2.11.7 Market Share<br/>5.2.12 IRISNDT<br/>5.2.12.1 Overview<br/>5.2.12.2 Top Products/Product Portfolio<br/>5.2.12.3 Top Competitors<br/>5.2.12.4 Target Customers<br/>5.2.12.5 Key Personnel<br/>5.2.12.6 Analyst View<br/>5.2.12.7 Market Share<br/>5.2.13 Blue Star Engineering & Electronics Ltd.<br/>5.2.13.1 Overview<br/>5.2.13.2 Top Products/Product Portfolio<br/>5.2.13.3 Top Competitors<br/>5.2.13.4 Target Customers<br/>5.2.13.5 Key Personnel<br/>5.2.13.6 Analyst View<br/>5.2.13.7 Market Share<br/>5.2.14 RTE Akustik + Prüftechnik GmbH<br/>5.2.14.1 Overview<br/>5.2.14.2 Top Products/Product Portfolio<br/>5.2.14.3 Top Competitors<br/>5.2.14.4 Target Customers<br/>5.2.14.5 Key Personnel<br/>5.2.14.6 Analyst View<br/>5.2.14.7 Market Share<br/>5.2.15 Swiss Approval International<br/>5.2.15.1 Overview<br/>5.2.15.2 Top Products/Product Portfolio<br/>5.2.15.3 Top Competitors<br/>5.2.15.4 Target Customers<br/>5.2.15.5 Key Personnel<br/>5.2.15.6 Analyst View<br/>5.2.15.7 Market Share<br/>5.2.16 Others</p>\n<p><strong>6. Research Methodology</strong></p>\n<h1>Companies Mentioned</h1>\n<ul><li>MISTRAS Group</li><li>GENERAL ELECTRIC</li><li>PARKER HANNIFIN CORP</li><li>QAWRUMS LTD</li><li>Vallen Systeme GmbH</li><li>KRN Services</li><li>TÜV Rheinland</li><li>Arudra Engineers Pvt.Lrd.</li><li>Stress Engineering Services, Inc</li><li>FIBA Technologies, Inc.</li><li>Acuren</li><li>IRISNDT</li><li>Blue Star Engineering & Electronics Ltd.</li><li>RTE Akustik + Prüftechnik GmbH</li><li>Swiss Approval International</li></ul>\n<h1>Table Information</h1>\n<p>Report AttributeDetailsNo. of Pages100PublishedMay 2024Forecast Period2024–2034Estimated Market Value ( USD ) in 2024$ 395.21 MillionForecasted Market Value ( USD ) by 2034$ 751.97 MillionCompound Annual Growth Rate6.6%Regions CoveredGlobalNo. of Companies Mentioned15</p>\n<h1>Related Topics</h1>\n<ul><li><a href=\"https://www.aendt.com/blog/acousic-emission-testing.html\">Acoustic Emission Test</a></li><li><a href=\"https://www.aendt.com/\">Acoustic Emission</a></li><li><a href=\"https://www.researchandmarkets.com/categories/engineering#rtc\">Engineering</a></li></ul>\n<h1>Related Reports</h1>\n<p><img src=\"https://miro.medium.com/v2/resize:fit:120/0*C-dTsSx1P7-MQ3aL.jpg\" alt=\"\"/></p>\n<h1><a href=\"https://www.researchandmarkets.com/report/acoustic-emission-test#rela0-5968666\">Acoustic Emission Testing Market by Component, Source Location Techniques, Services, Application — Global Forecast 2025–2030</a></h1>\n<p><img src=\"https://miro.medium.com/v2/resize:fit:120/0*UbJBRlDX5Xr6LGs6.jpg\" alt=\"\"/></p>\n<h1><a href=\"https://www.researchandmarkets.com/reports/5929174/acoustic-emission-testing-market-report-trends#rela1-5968666\">Acoustic Emission Testing Market Report: Trends, Forecast and Competitive Analysis to 2030</a></h1>\n<p><img src=\"https://miro.medium.com/v2/resize:fit:120/0*7tEKF7kGQP9guaNK.jpg\" alt=\"\"/></p>\n<h1><a href=\"https://www.researchandmarkets.com/reports/4804536/acoustic-emission-testing-global-strategic#rela2-5968666\">Acoustic Emission Testing — Global Strategic Business Report</a></h1>\n<p><img src=\"https://miro.medium.com/v2/resize:fit:120/0*WoOrHfG3VTRf3mOJ.jpg\" alt=\"\"/></p>\n<h1><a href=\"https://www.researchandmarkets.com/report/non-destructive-testing#rela3-5968666\">NDT and Inspection Market by Technique (Ultrasonic Testing, Visual, Magnetic Particle, Liquid Penetration, Eddy-Current, Radiographic, Acoustic Emission), Service, Method, Vertical, Application and Region — Forecast to 2029</a></h1>\n<p><img src=\"https://miro.medium.com/v2/resize:fit:120/0*mOBnEv5H21N905fZ.jpg\" alt=\"\"/></p>\n<h1><a href=\"https://www.researchandmarkets.com/reports/5914732/global-forecast-acoustic-emission-testing#rela4-5968666\">2024 Global Forecast for Acoustic Emission Testing Market (2025–2030 Outlook)-High Tech & Emerging Markets Report</a></h1>\n<p>\r<br/>\r<br/></p>\n</html>",
"json_metadata": "{\"tags\":[\"market\"],\"image\":[\"https://miro.medium.com/v2/resize:fit:1200/0*kLtcKBl_shiOquLX.png\",\"https://miro.medium.com/v2/resize:fit:120/0*C-dTsSx1P7-MQ3aL.jpg\",\"https://miro.medium.com/v2/resize:fit:120/0*UbJBRlDX5Xr6LGs6.jpg\",\"https://miro.medium.com/v2/resize:fit:120/0*7tEKF7kGQP9guaNK.jpg\",\"https://miro.medium.com/v2/resize:fit:120/0*WoOrHfG3VTRf3mOJ.jpg\",\"https://miro.medium.com/v2/resize:fit:120/0*mOBnEv5H21N905fZ.jpg\"],\"links\":[\"https://www.aendt.com/blog/acoustic-emission-testing.html\",\"https://www.aendt.com/blog/acousic-emission-testing.html\",\"https://www.aendt.com/\",\"https://www.researchandmarkets.com/categories/engineering#rtc\",\"https://www.researchandmarkets.com/report/acoustic-emission-test#rela0-5968666\",\"https://www.researchandmarkets.com/reports/5929174/acoustic-emission-testing-market-report-trends#rela1-5968666\",\"https://www.researchandmarkets.com/reports/4804536/acoustic-emission-testing-global-strategic#rela2-5968666\",\"https://www.researchandmarkets.com/report/non-destructive-testing#rela3-5968666\",\"https://www.researchandmarkets.com/reports/5914732/global-forecast-acoustic-emission-testing#rela4-5968666\"],\"app\":\"steemit/0.2\",\"format\":\"html\"}",
"parent_author": "",
"parent_permlink": "market",
"permlink": "acoustic-emission-ae-testing-market-a-global-and-regional-analysis-focus-on-end-use-industry-equipment-type-service-and-region",
"title": "Acoustic Emission (AE) Testing Market — A Global and Regional Analysis: Focus on End-use Industry, Equipment Type, Service, and Region — Analysis and Forecast, 2024–2034"
}
],
"op_in_trx": 0,
"timestamp": "2024-11-15T10:30:39",
"trx_id": "ca3c9980b2a4a795611909146c29c23e5da13b87",
"trx_in_block": 0,
"virtual_op": 0
}2024/11/15 09:55:45
2024/11/15 09:55:45
| author | barrylee |
| permlink | 3auzdz |
| sbd payout | 0.000 SBD |
| steem payout | 0.046 STEEM |
| vesting payout | 79.683679 VESTS |
| Transaction Info | Block #90386926/Virtual Operation #3 |
View Raw JSON Data
{
  "block": 90386926,
  "op": [
    "author_reward",
    {
      "author": "barrylee",
      "permlink": "3auzdz",
      "sbd_payout": "0.000 SBD",
      "steem_payout": "0.046 STEEM",
      "vesting_payout": "79.683679 VESTS"
    }
  ],
  "op_in_trx": 0,
  "timestamp": "2024-11-15T09:55:45",
  "trx_id": "0000000000000000000000000000000000000000",
  "trx_in_block": 4294967295,
  "virtual_op": 3
}2024/11/13 06:17:36
2024/11/13 06:17:36
| author | barrylee |
| body | <html> <p>Brief:We are excited to announce that QAWRUMS recently participated in the 6th International Conference on Structural Health Monitoring and Integrity Management (ICSHMIM 2024), held from November 9–11, 2024 in Zhengzhou, China. At this renowned conference, we were honored to present our oral paper titled “Research on Acoustic Emission Source Localization Technology Based on AI Deep Learning”.</p> <p>If you’re looking for the latest updates on the acoustic emission industry, please check out the <a href="https://www.aendt.com/news/">news</a> link.</p> <p>We are excited to announce that <a href="https://www.aendt.com/">QAWRUMS</a> recently participated in the <a href="http://www.icshmim2024.com/">6th International Conference on Structural Health Monitoring and Integrity Management (ICSHMIM 2024)</a>, held from November 9–11, 2024 in Zhengzhou, China. Over the course of this impactful three-day event, our team showcased our cutting-edge acoustic emission (AE) and structural health monitoring products, with live demonstrations that garnered enthusiastic feedback from attendees.</p> <p><img src="https://miro.medium.com/v2/resize:fit:1400/0*QtST0uU4uCFWQHTB.jpg" alt=""/><img src="https://miro.medium.com/v2/resize:fit:1400/0*V_7V8IIXLWYOSFVj.jpg" alt=""/><img src="https://miro.medium.com/v2/resize:fit:1400/0*790cCiCuflU7JFAU.jpg" alt=""/></p> <p>At this renowned conference, we were honored to present our oral paper titled “Research on Acoustic Emission Source Localization Technology Based on AI Deep Learning”. This presentation highlighted the innovative integration of AI deep learning into <a href="https://www.aendt.com/">acoustic emission technology</a>, sparking fascinating discussions and drawing significant attention from both industry professionals and researchers. The positive feedback reaffirmed the relevance and potential of AI in enhancing <a href="https://www.aendt.com/">structural health monitoring</a>.</p> <p><img src="https://miro.medium.com/v2/resize:fit:1278/0*VeJUSePBVRgBJrNj.jpg" alt=""/><img src="https://miro.medium.com/v2/resize:fit:1400/0*wU142Nzr_k8jhrtr.jpg" alt=""/><img src="https://miro.medium.com/v2/resize:fit:1400/0*olrQJ1JRzwpQUtf1.jpg" alt=""/><img src="https://miro.medium.com/v2/resize:fit:1400/0*I1ObPmJ_NSs1288B.jpg" alt=""/><img src="https://miro.medium.com/v2/resize:fit:1400/0*zFpl0niiBH6E9MJa.jpg" alt=""/><img src="https://miro.medium.com/v2/resize:fit:1400/0*8k9PNVP9GBVyT2OG.jpg" alt=""/></p> <p>We would like to extend our heartfelt thanks to everyone who visited our booth and engaged with us during the event. Your support and interest in our products and solutions are truly inspiring. It was a privilege to connect with industry leaders, experts, and peers, sharing insights into how our technologies are advancing the future of <a href="https://www.aendt.com/">structural health monitoring</a>.</p> <p><img src="https://miro.medium.com/v2/resize:fit:1400/0*47SvELfRYtFhqDr6.jpg" alt=""/></p> <p>If you would like to learn more about our innovative <a href="https://www.aendt.com/acoustic/solutions/">acoustic emission solutions</a> or stay updated on our latest research and product developments, please visit our website.</p> <p>Thank you again for your continued support of <a href="https://www.aendt.com/">QAWRUMS</a>. We look forward to seeing you at future events!</p> <p> <br/> <br/></p> </html> |
| json metadata | {"tags":["shm"],"image":["https://miro.medium.com/v2/resize:fit:1400/0*QtST0uU4uCFWQHTB.jpg","https://miro.medium.com/v2/resize:fit:1400/0*V_7V8IIXLWYOSFVj.jpg","https://miro.medium.com/v2/resize:fit:1400/0*790cCiCuflU7JFAU.jpg","https://miro.medium.com/v2/resize:fit:1278/0*VeJUSePBVRgBJrNj.jpg","https://miro.medium.com/v2/resize:fit:1400/0*wU142Nzr_k8jhrtr.jpg","https://miro.medium.com/v2/resize:fit:1400/0*olrQJ1JRzwpQUtf1.jpg","https://miro.medium.com/v2/resize:fit:1400/0*I1ObPmJ_NSs1288B.jpg","https://miro.medium.com/v2/resize:fit:1400/0*zFpl0niiBH6E9MJa.jpg","https://miro.medium.com/v2/resize:fit:1400/0*8k9PNVP9GBVyT2OG.jpg","https://miro.medium.com/v2/resize:fit:1400/0*47SvELfRYtFhqDr6.jpg"],"links":["https://www.aendt.com/news/","https://www.aendt.com/","http://www.icshmim2024.com/","https://www.aendt.com/acoustic/solutions/"],"app":"steemit/0.2","format":"html"} |
| parent author | |
| parent permlink | shm |
| permlink | qawrums-shines-at-icshmim-2024-the-6th-international-conference-on-structural-health-monitoring-and-integrity-management |
| title | Qawrums Shines at ICSHMIM 2024 - the 6th International Conference on Structural Health Monitoring and Integrity Management |
| Transaction Info | Block #90325166/Trx c09703a1f6a30b76fe2ad176f279e45742f9aeaf |
View Raw JSON Data
{
  "block": 90325166,
  "op": [
    "comment",
    {
      "author": "barrylee",
      "body": "<html>\n<p>Brief:We are excited to announce that QAWRUMS recently participated in the 6th International Conference on Structural Health Monitoring and Integrity Management (ICSHMIM 2024), held from November 9–11, 2024 in Zhengzhou, China. At this renowned conference, we were honored to present our oral paper titled “Research on Acoustic Emission Source Localization Technology Based on AI Deep Learning”.</p>\n<p>If you’re looking for the latest updates on the acoustic emission industry, please check out the <a href=\"https://www.aendt.com/news/\">news</a> link.</p>\n<p>We are excited to announce that <a href=\"https://www.aendt.com/\">QAWRUMS</a> recently participated in the <a href=\"http://www.icshmim2024.com/\">6th International Conference on Structural Health Monitoring and Integrity Management (ICSHMIM 2024)</a>, held from November 9–11, 2024 in Zhengzhou, China. Over the course of this impactful three-day event, our team showcased our cutting-edge acoustic emission (AE) and structural health monitoring products, with live demonstrations that garnered enthusiastic feedback from attendees.</p>\n<p><img src=\"https://miro.medium.com/v2/resize:fit:1400/0*QtST0uU4uCFWQHTB.jpg\" alt=\"\"/><img src=\"https://miro.medium.com/v2/resize:fit:1400/0*V_7V8IIXLWYOSFVj.jpg\" alt=\"\"/><img src=\"https://miro.medium.com/v2/resize:fit:1400/0*790cCiCuflU7JFAU.jpg\" alt=\"\"/></p>\n<p>At this renowned conference, we were honored to present our oral paper titled “Research on Acoustic Emission Source Localization Technology Based on AI Deep Learning”. This presentation highlighted the innovative integration of AI deep learning into <a href=\"https://www.aendt.com/\">acoustic emission technology</a>, sparking fascinating discussions and drawing significant attention from both industry professionals and researchers. The positive feedback reaffirmed the relevance and potential of AI in enhancing <a href=\"https://www.aendt.com/\">structural health monitoring</a>.</p>\n<p><img src=\"https://miro.medium.com/v2/resize:fit:1278/0*VeJUSePBVRgBJrNj.jpg\" alt=\"\"/><img src=\"https://miro.medium.com/v2/resize:fit:1400/0*wU142Nzr_k8jhrtr.jpg\" alt=\"\"/><img src=\"https://miro.medium.com/v2/resize:fit:1400/0*olrQJ1JRzwpQUtf1.jpg\" alt=\"\"/><img src=\"https://miro.medium.com/v2/resize:fit:1400/0*I1ObPmJ_NSs1288B.jpg\" alt=\"\"/><img src=\"https://miro.medium.com/v2/resize:fit:1400/0*zFpl0niiBH6E9MJa.jpg\" alt=\"\"/><img src=\"https://miro.medium.com/v2/resize:fit:1400/0*8k9PNVP9GBVyT2OG.jpg\" alt=\"\"/></p>\n<p>We would like to extend our heartfelt thanks to everyone who visited our booth and engaged with us during the event. Your support and interest in our products and solutions are truly inspiring. It was a privilege to connect with industry leaders, experts, and peers, sharing insights into how our technologies are advancing the future of <a href=\"https://www.aendt.com/\">structural health monitoring</a>.</p>\n<p><img src=\"https://miro.medium.com/v2/resize:fit:1400/0*47SvELfRYtFhqDr6.jpg\" alt=\"\"/></p>\n<p>If you would like to learn more about our innovative <a href=\"https://www.aendt.com/acoustic/solutions/\">acoustic emission solutions</a> or stay updated on our latest research and product developments, please visit our website.</p>\n<p>Thank you again for your continued support of <a href=\"https://www.aendt.com/\">QAWRUMS</a>. We look forward to seeing you at future events!</p>\n<p>\r<br/>\r<br/></p>\n</html>",
      "json_metadata": "{\"tags\":[\"shm\"],\"image\":[\"https://miro.medium.com/v2/resize:fit:1400/0*QtST0uU4uCFWQHTB.jpg\",\"https://miro.medium.com/v2/resize:fit:1400/0*V_7V8IIXLWYOSFVj.jpg\",\"https://miro.medium.com/v2/resize:fit:1400/0*790cCiCuflU7JFAU.jpg\",\"https://miro.medium.com/v2/resize:fit:1278/0*VeJUSePBVRgBJrNj.jpg\",\"https://miro.medium.com/v2/resize:fit:1400/0*wU142Nzr_k8jhrtr.jpg\",\"https://miro.medium.com/v2/resize:fit:1400/0*olrQJ1JRzwpQUtf1.jpg\",\"https://miro.medium.com/v2/resize:fit:1400/0*I1ObPmJ_NSs1288B.jpg\",\"https://miro.medium.com/v2/resize:fit:1400/0*zFpl0niiBH6E9MJa.jpg\",\"https://miro.medium.com/v2/resize:fit:1400/0*8k9PNVP9GBVyT2OG.jpg\",\"https://miro.medium.com/v2/resize:fit:1400/0*47SvELfRYtFhqDr6.jpg\"],\"links\":[\"https://www.aendt.com/news/\",\"https://www.aendt.com/\",\"http://www.icshmim2024.com/\",\"https://www.aendt.com/acoustic/solutions/\"],\"app\":\"steemit/0.2\",\"format\":\"html\"}",
      "parent_author": "",
      "parent_permlink": "shm",
      "permlink": "qawrums-shines-at-icshmim-2024-the-6th-international-conference-on-structural-health-monitoring-and-integrity-management",
      "title": "Qawrums Shines at ICSHMIM 2024 - the 6th International Conference on Structural Health Monitoring and Integrity Management"
    }
  ],
  "op_in_trx": 0,
  "timestamp": "2024-11-13T06:17:36",
  "trx_id": "c09703a1f6a30b76fe2ad176f279e45742f9aeaf",
  "trx_in_block": 0,
  "virtual_op": 0
}fulireplied to @barrylee / 20241108t100159938z2024/11/08 10:02:03
fulireplied to @barrylee / 20241108t100159938z
2024/11/08 10:02:03
| author | fuli |
| body | You've got a free upvote from <a href='https://steemitwallet.com/~witnesses'>witness fuli</a>. <br /> Peace & Love! <br /> |
| json metadata | {} |
| parent author | barrylee |
| parent permlink | 3auzdz |
| permlink | 20241108t100159938z |
| title | upvoted |
| Transaction Info | Block #90186299/Trx ff4a8025d02f8355b39718152797bca227889c74 |
View Raw JSON Data
{
  "block": 90186299,
  "op": [
    "comment",
    {
      "author": "fuli",
      "body": "You've got a free upvote from <a href='https://steemitwallet.com/~witnesses'>witness fuli</a>. <br /> Peace & Love! <br />",
      "json_metadata": "{}",
      "parent_author": "barrylee",
      "parent_permlink": "3auzdz",
      "permlink": "20241108t100159938z",
      "title": "upvoted"
    }
  ],
  "op_in_trx": 0,
  "timestamp": "2024-11-08T10:02:03",
  "trx_id": "ff4a8025d02f8355b39718152797bca227889c74",
  "trx_in_block": 0,
  "virtual_op": 0
}2024/11/08 10:01:57
2024/11/08 10:01:57
| author | barrylee |
| permlink | 3auzdz |
| voter | fuli |
| weight | 4000 (40.00%) |
| Transaction Info | Block #90186297/Trx a5ba1e70ba5a9a226ae760867f7d93fcab60de60 |
View Raw JSON Data
{
  "block": 90186297,
  "op": [
    "vote",
    {
      "author": "barrylee",
      "permlink": "3auzdz",
      "voter": "fuli",
      "weight": 4000
    }
  ],
  "op_in_trx": 0,
  "timestamp": "2024-11-08T10:01:57",
  "trx_id": "a5ba1e70ba5a9a226ae760867f7d93fcab60de60",
  "trx_in_block": 0,
  "virtual_op": 0
}2024/11/08 09:55:45
2024/11/08 09:55:45
| author | barrylee |
| body | <html> <p>应用介绍</p> <p>储罐的腐蚀主要指储罐材料的腐蚀,包括储罐顶部内外侧的腐蚀、储罐腐蚀,尤其是储罐焊接部位的腐蚀,在焊接位置上由于焊接技术的不完善导致焊接部位常出现多余的空气、杂质和没有焊透的裂纹等问题,就储罐底板而言,由于储罐中储存的液体、清洗不干净的沉积物逐渐积攒下来,底板沉降不均最终造成储罐底板发生腐蚀现象。</p> <p><a href="https://ae-ndt.com/plus/view.php?aid=632">https://ae-ndt.com/plus/view.php?aid=632</a></p> <p><em>视频-储罐底板腐蚀声发射检测案例</em></p> <h1>原理</h1> <p>常压储罐底板在运行过程中,由于底板经受环境的直接腐蚀,导致泄漏渗漏减薄等产生声波(声发射)信号,通过储罐所存储的介质或储罐底板传播到储罐壁板表面,储罐壁板表面的<a href="https://www.ae-ndt.com/">声发射传感器</a>阵列接收信号,声波(声发射)检测仪对信号进行鉴别处理分析,最终实现对储罐底板进行腐蚀状况评价。</p> <p><img src="https://miro.medium.com/v2/resize:fit:1400/0*5Ao-d3tiZfR7T7UT.jpg" alt=""/></p> <h1>结果</h1> <ul><li>a. 按标准JB/T10764–2023无损检测常压金属罐体声发射检测与评价方法对罐体底板进行声发射在线检测监测;</li><li>b. 实现对罐底、罐体总体腐蚀情况进行评价,批量检测可根据储罐腐蚀情况制定相应的维修计划;</li><li>c. 不需要停产,就能实现在线检测,检测效率高、成本低、检测结果直观可靠,大幅降低劳动强度,减少环境污染。</li></ul> <h1>适用范围</h1> <p>适用于工作介质为气体或液体、工作压力为常压或小于0.1MPa的低压的新制造和在用地上立式储罐罐底板的声发射检测与评价。</p> <p><img src="https://miro.medium.com/v2/resize:fit:1400/0*Ups8KpoleRmu4ZRW.jpg" alt=""/><img src="https://miro.medium.com/v2/resize:fit:1400/0*Y82lCfi6kppZXlvv.jpg" alt=""/><img src="https://miro.medium.com/v2/resize:fit:1400/0*G311t36iOMPahMgv.jpg" alt=""/></p> <h1>解决方案</h1> <h1>1、传统声发射储罐底板检测方案</h1> <p><strong>原理:</strong>当储罐底板存在腐蚀缺陷导致腐蚀产物的剥离和脱落,产生声发射信号;底板发生泄漏,介质流动产生声发射信号,通过罐壁下部的声发射传感器阵列接收信号,声发射检测仪对信号进行处理分析,实现对罐底结构进行腐蚀状况评价。</p> <p>系统组成通讯方式声发射传感器、前置放大器、SAEU3H声波(声发射)检测仪、上位机软件USB、LAN网口、光纤</p> <p>设备型号SAEU3H集成声波(声发射)检测仪通道扩展多机箱可级联组成128通道声发射系统,每个机箱亦可作为独立主机使用采样频率单个通道最大采样率10M点/秒,采样率连续可调,每个通道可独立设置采样精度16位波形采集支持数据通过率单个USB3.0接口连接通过率最大高于300MB/秒,两个独立USB3.0接口连接通过率最大高于600MB/秒最大信号幅度100dB(使用40dB 前放,对应传感器输出为100毫伏)主机噪声﹤15dB(空载)动态范围85dB输入阻抗50Ω模拟滤波器高通滤波器:20kHz、100kHz、400kHz<br/>低通滤波器:100kHz、400kHz、1200kHz硬件实时数字滤波器1kHz-2MHz频率范围内任意数值设置直通、高通、低通、带通及带阻响应频率1kHz-2.5MHz(-3dB带宽)工作温度10℃~﹢45℃尺寸4通道机箱:320mm×125mm×50mm;(长×宽×高)<br/>20通道机箱:308mm×225mm×133mm;(长×宽×高)<br/>48通道机箱:308mm×368mm×133mm;(长×宽×高)优点USB3.0高速数据传输,扩展能力好,性能稳定,缺陷定位功能准确。适合常规检测。</p> <h2>SWAE软件</h2> <p><a href="https://www.ae-ndt.com/">SWAE 声发射系统软件</a>是实时采集分析和事后分析软件的集合,适用<a href="https://ae-ndt.com/plus/view.php?aid=4">SAEU3H集成声波(声发射)检测仪</a>、<a href="https://ae-ndt.com/plus/view.php?aid=604">RAEM1–6声波(声发射)远程无人值守监测系统</a>、<a href="https://ae-ndt.com/plus/view.php?aid=609">RAEM1系列远程声波(声发射)监测系统</a>,可对设备进行数据采集及回放分析等。主要功能:定位图、相关图、参数表、频域波形图等。</p> <h2>案例:兴三联合站储罐声发射在线检测与评价</h2> <p>储罐容积为5000立方米,直径22.7米,有效高度:16.14米,存储介质为原油,罐壁外涂有防腐漆,有复合铝镁硅酸盐卷毡保温及金属铁皮护板。</p> <ul><li><strong>声发射传感器布置:</strong>在距底板上方约50厘米的外壁一周均匀布置9个传感器,尽量避开管道、人孔等结构不连续位置,水平间距约7.8米。</li><li>图1.1 传感器布置图</li><li><strong>数据采集与分析:</strong>对储罐进行2小时的声发射检测:</li><li>图1.2 2#储罐 通道-撞击数 统计图</li></ul> <p><img src="https://miro.medium.com/v2/resize:fit:1354/0*6k6bpy9NDyX9X7kU.png" alt=""/></p> <ul><li>图1.3 2#储罐 时间-能量 统计图</li><li>图1.4 2#储罐2h时差定位图</li></ul> <p><img src="https://miro.medium.com/v2/resize:fit:1300/0*935nOJ9302kmUzr1.png" alt=""/></p> <ul><li>图1.5 保压数据定位图</li><li><strong>检测结果</strong></li><li>按照标准 JB/T 10764–2023常压金属储罐声发射检测及评价 中9.2内容,采用罐底板声发射源的时差定位分析及分级,根据表3声发射源分级参数推荐值, a=10,得到如下罐底声源的时差定位分析及声源级别划分结果:</li><li>根据图1.5,发现三处较为明显集中定位源区,定义为S1、S2、S3。</li><li>S1: E1=7; S2: E2=10; S3: E3=4;</li><li>根据罐底的时差定位情况,保压时共有173个有效定位事件,结合保压时液位高度,综合声发射特征参数考虑,由此得到完整性评价级别为Ⅰ级(无局部腐蚀迹象或存在轻微局部腐蚀迹象,维修/处理建议:不考虑维修,建议6年内再次进行声发射检测或选择开罐检测,以观察罐底板腐蚀的动态变化)。</li></ul> <h1>2、物联网智能无人值守声发射储罐监测方案</h1> <h2>2.1 基于RAEM1–6的集中式方案</h2> <p><strong>原理:</strong>储罐底板发生腐蚀缺陷、底板泄漏时产生声发射信号,传感器接收声波,信号经过声发射采集器进行处理和分析,通过4G/网口传输到云服务器,用户登录云平台(私有云/清诚云)远程查看数据、设置评级判据,系统自动根据判据给出评级结果,一旦达到报警阈值,自动报警推送。</p> <p>系统组成通讯方式声发射传感器、 <a href="https://ae-ndt.com/plus/view.php?aid=609">RAEM1–6声波(声发射)检测仪</a>、云服务器、客户终端网口、WiFi、4G(注:可多个RAEM1–6采集器组成多通道监测系统,对大型设备进行实时监测)</p> <p><img src="https://miro.medium.com/v2/resize:fit:1400/0*2BGgJ3whaqNJlhBr.jpg" alt=""/></p> <h2>2.2 基于一体化RAEM1的分布式方案</h2> <p><strong>原理:</strong>储罐底板发生腐蚀缺陷、底板泄漏时产生声波(声发射)信号,声发射采集器接收信号进行处理和分析,通过4G/WiFi/LAN网络传输到云服务器,用户登录云平台(私有云/清诚云)远程查看数据、设置评级判据,系统自动根据判据给出评级结果,一旦达到报警阈值,自动报警推送。</p> <p>系统组成通讯方式声发射采集器(传感器,信号采集与分析,通讯)云服务器、客户终端网口、WiFi、4G(注:可多个RAEM1采集器组成多通道监测系统,对大型设进行备实时监测;传感器可选择内置或外置)</p> <h1>设备介绍</h1> <p>图片</p> <p><img src="https://miro.medium.com/v2/resize:fit:1400/0*00EsMGrG6wYAOxgB.jpg" alt=""/></p> <p>名称RAEM1–6声波(声发射)检测仪RAEM1声波(声发射)检测仪采样频率单个通道最大采样率2M点/秒单个通道最大采样率2M点/秒采样精度16位16位通道数单通道、6通道或级联使用单通道频率范围10KHz-800KHz10KHz-800KHz系统噪声优于30dB优于30dB动态范围70dB70dB通讯方式4G、网口、WiFi4G、网口、WiFi、RS485供电12VDC12VDC尺寸长×宽×高:22cm×13cm×8cm圆筒直径φ62mm,高度 100mm重量1.6kg220g安装/底部自带磁性,可吸附于被测物体表面防护等级/IP65工作温度-20℃~60℃。(WiFi版本为0℃~60℃)-20℃~60℃。(WiFi版本为0℃~60℃)优势基于Linus操作系统,性能稳定,具有无线通信能力,适合长时间远程无人值守监控,设备可级联组成大型监测系统。声发射检测仪内置了信号处理、通讯模块,底部带磁性,安装时可将设备直接与金属物体耦合。</p> <h1>声发射传感器</h1> <p>图片</p> <p><img src="https://miro.medium.com/v2/resize:fit:1400/0*4Pndva2r_4qgVbjj.jpg" alt=""/></p> <p>频率范围15KHz~70KHz60KHz~400KHz谐振频率40KHz150KHz灵敏度>75dB>75dB前置放大器40dB28V40dB28V接口类型BNCBNC应用罐底腐蚀罐体裂纹安装方法底部涂抹适量的耦合剂,利用磁夹具辅助安装</p> <h1>过程可视化</h1> <p>365天在线<a href="https://ae-ndt.com/">声发射监测检测</a>,全过程自动分析结果,物联网远程操作使用。</p> <ul><li>自动给出检测监测诊断结果</li><li>在线和历史数据屏幕显示</li></ul> <h1>智能采集器自动工作原理</h1> <p><strong>云端计算机工作原理:</strong>统计采集周期内各个通道的撞击数,按照声发射源分级参数推荐值计算出各通道源极别,根据各通道源级别计算储罐总的级别,显示总级别及各通道级别分布图,自动给出报告(PDF)储存在云端,可下载。</p> <h1>清诚云</h1> <p>数据上传到云端物联网平台(清诚云)显示分析。AE特征参数:到达时间,幅度,振铃计数,能量,上升时间,持续时间,RMS,ASL。</p> <p>远程配置:远程配置参数、滤波配置、FFT配置、定时配置等。</p> <p><img src="https://miro.medium.com/v2/resize:fit:1400/0*ffY-rLv9j2QN6ixp.jpg" alt=""/></p> <p>系统自动评级,云端远程查看评级结果。声发射数据采用自动分级算法,由声发射特征参数得到强度级别,活度级别,综合级别,灵活设置,可满足不同行业标准的评级需求。</p> <p><img src="https://miro.medium.com/v2/resize:fit:1400/0*Upu8k1YsXdLbZBRo.jpg" alt=""/></p> <p>相关图:使用参数表中包含的2个声发射参数为横、纵坐标,画出相关曲线或者分布点图、线图等。</p> <h1>实际案例</h1> <p>储罐因腐蚀导致底板减薄和穿孔泄漏的事故时有发生。据统计,由于腐蚀而引起的储罐失效占全部储罐失效的60%以上。采取有效的储罐检测方法,对安全生产、节约资源和保护环境都具有重大意义。</p> <p><img src="https://miro.medium.com/v2/resize:fit:1000/0*_MkPoY7Ic9DEkyg9.png" alt=""/></p> <p><em>视频-储罐底板腐蚀声发射检测案例</em></p> <p><a href="https://ae-ndt.com/plus/view.php?aid=476"><strong>1)声发射检测在古巴国家石油公司(CUPET)罐底检测培训应用案例</strong></a></p> <p><img src="https://miro.medium.com/v2/resize:fit:790/0*_PpdZeZbzKMlzfYN.png" alt=""/><img src="https://miro.medium.com/v2/resize:fit:790/0*c7zI6jL2ITik6-_E.png" alt=""/></p> <p>2017年3月6日至3月12日,在古巴马坦萨斯港口油库罐区,依照中国机械工业标准《JB/T 10764–2007常压金属储罐声发射检测及评价方法》进行检测。</p> <p><img src="https://miro.medium.com/v2/resize:fit:790/0*HD_5LYiCGUsQ9pKE.png" alt=""/><img src="https://miro.medium.com/v2/resize:fit:790/0*dbhVyYs9XXxOCVAa.png" alt=""/></p> <p>罐号TK-56(2012年投入使用),直径74米,设计液面高度10.8米,材质A516-Gr70</p> <p>近一个月加载历史显示,最高液面达到过10.6米,计划本次检测液面升至10.8米。根据周长设计探头位置,实际使用通道数量为29个通道,传感器间距为约8米。最后,针对古巴国家石油公司储罐群情况,进行了全面检测。根据撞击数分布情况,确定了开罐复验的具体执行方案,并依据开罐结果,制定出后续年度检验的合格标准。</p> <p><img src="https://miro.medium.com/v2/resize:fit:790/0*-EXZdjTa3my8f9Ne.png" alt=""/><img src="https://miro.medium.com/v2/resize:fit:790/0*bCvkbJvIQMXvGwq7.png" alt=""/></p> <p><a href="https://ae-ndt.com/plus/view.php?aid=476"><strong>2)中原油田储罐声波(声发射)检测</strong></a></p> <p>待检测常压储罐外观</p> <p>受中原油田油气储运管理处委托,我司于2006年8月对中原油田20000m3储罐进行声波(声发射)检验。</p> <p><img src="https://miro.medium.com/v2/resize:fit:790/0*ySBIC0JZZR6KOBdh.png" alt=""/><img src="https://miro.medium.com/v2/resize:fit:790/0*Suc_VhrU-NaPEmf-.png" alt=""/></p> <p>3)江西特检所-九江石化储罐罐底检测</p> <p><img src="https://miro.medium.com/v2/resize:fit:1400/0*3XnY3VXDOy4pjpDE.png" alt=""/></p> <p>储罐外观</p> <p><img src="https://miro.medium.com/v2/resize:fit:790/0*j8qg9JK_3AXRI8Aj.png" alt=""/><img src="https://miro.medium.com/v2/resize:fit:790/0*i5iNmE4p01TKsa4_.png" alt=""/></p> <p>传感器安装</p> <p>前置放大器</p> <p><img src="https://miro.medium.com/v2/resize:fit:790/0*o0AEOW7epx9L5ivz.png" alt=""/><img src="https://miro.medium.com/v2/resize:fit:790/0*wNRic98O7A1MtLoK.png" alt=""/></p> <p>主机采集信号</p> <p>现场图</p> <p><a href="https://ae-ndt.com/plus/view.php?aid=606"><strong>4)特油公司特一联合站储罐声波(声发射)在线检测</strong></a></p> <p><img src="https://miro.medium.com/v2/resize:fit:1400/0*UV0qQqWtKi30_HAs.png" alt=""/></p> <p>储罐类型为外拱顶储罐,储罐容积为10000立方米,直径27.75米,有效高度14.8米,存储介质为原油,安全液位12.5米,检测初始液位17.8米,罐壁外涂有防腐漆,有保温板及金属铁皮护板。</p> <p><img src="https://miro.medium.com/v2/resize:fit:1400/0*w7z3brJPQGuZ0wOq.png" alt=""/></p> <p>现场传感器部分安装图</p> <p><img src="https://miro.medium.com/v2/resize:fit:1082/0*bLmT-GzExtcz3smL.png" alt=""/></p> <p>数据分析图1</p> <p><img src="https://miro.medium.com/v2/resize:fit:1400/0*gDs50yPvL495ozG3.png" alt=""/></p> <p>时间-能量统计图</p> <p><img src="https://miro.medium.com/v2/resize:fit:806/0*y0phYkzyUi8v1rSI.png" alt=""/></p> <p>时差定位图</p> <p> <br/> <br/></p> </html> |
| json metadata | {"tags":["tankmonitoring"],"image":["https://miro.medium.com/v2/resize:fit:1400/0*5Ao-d3tiZfR7T7UT.jpg","https://miro.medium.com/v2/resize:fit:1400/0*Ups8KpoleRmu4ZRW.jpg","https://miro.medium.com/v2/resize:fit:1400/0*Y82lCfi6kppZXlvv.jpg","https://miro.medium.com/v2/resize:fit:1400/0*G311t36iOMPahMgv.jpg","https://miro.medium.com/v2/resize:fit:1354/0*6k6bpy9NDyX9X7kU.png","https://miro.medium.com/v2/resize:fit:1300/0*935nOJ9302kmUzr1.png","https://miro.medium.com/v2/resize:fit:1400/0*2BGgJ3whaqNJlhBr.jpg","https://miro.medium.com/v2/resize:fit:1400/0*00EsMGrG6wYAOxgB.jpg","https://miro.medium.com/v2/resize:fit:1400/0*4Pndva2r_4qgVbjj.jpg","https://miro.medium.com/v2/resize:fit:1400/0*ffY-rLv9j2QN6ixp.jpg","https://miro.medium.com/v2/resize:fit:1400/0*Upu8k1YsXdLbZBRo.jpg","https://miro.medium.com/v2/resize:fit:1000/0*_MkPoY7Ic9DEkyg9.png","https://miro.medium.com/v2/resize:fit:790/0*_PpdZeZbzKMlzfYN.png","https://miro.medium.com/v2/resize:fit:790/0*c7zI6jL2ITik6-_E.png","https://miro.medium.com/v2/resize:fit:790/0*HD_5LYiCGUsQ9pKE.png","https://miro.medium.com/v2/resize:fit:790/0*dbhVyYs9XXxOCVAa.png","https://miro.medium.com/v2/resize:fit:790/0*-EXZdjTa3my8f9Ne.png","https://miro.medium.com/v2/resize:fit:790/0*bCvkbJvIQMXvGwq7.png","https://miro.medium.com/v2/resize:fit:790/0*ySBIC0JZZR6KOBdh.png","https://miro.medium.com/v2/resize:fit:790/0*Suc_VhrU-NaPEmf-.png","https://miro.medium.com/v2/resize:fit:1400/0*3XnY3VXDOy4pjpDE.png","https://miro.medium.com/v2/resize:fit:790/0*j8qg9JK_3AXRI8Aj.png","https://miro.medium.com/v2/resize:fit:790/0*i5iNmE4p01TKsa4_.png","https://miro.medium.com/v2/resize:fit:790/0*o0AEOW7epx9L5ivz.png","https://miro.medium.com/v2/resize:fit:790/0*wNRic98O7A1MtLoK.png","https://miro.medium.com/v2/resize:fit:1400/0*UV0qQqWtKi30_HAs.png","https://miro.medium.com/v2/resize:fit:1400/0*w7z3brJPQGuZ0wOq.png","https://miro.medium.com/v2/resize:fit:1082/0*bLmT-GzExtcz3smL.png","https://miro.medium.com/v2/resize:fit:1400/0*gDs50yPvL495ozG3.png","https://miro.medium.com/v2/resize:fit:806/0*y0phYkzyUi8v1rSI.png"],"links":["https://ae-ndt.com/plus/view.php?aid=632","https://www.ae-ndt.com/","https://ae-ndt.com/plus/view.php?aid=4","https://ae-ndt.com/plus/view.php?aid=604","https://ae-ndt.com/plus/view.php?aid=609","https://ae-ndt.com/","https://ae-ndt.com/plus/view.php?aid=476","https://ae-ndt.com/plus/view.php?aid=606"],"app":"steemit/0.2","format":"html"} |
| parent author | |
| parent permlink | tankmonitoring |
| permlink | 3auzdz |
| title | 常压储罐底板腐蚀在线检测监测系统 |
| Transaction Info | Block #90186173/Trx 76139b39118c7d1c073ce55e02926d4e2ab62a39 |
View Raw JSON Data
{
"block": 90186173,
"op": [
"comment",
{
"author": "barrylee",
"body": "<html>\n<p>应用介绍</p>\n<p>储罐的腐蚀主要指储罐材料的腐蚀,包括储罐顶部内外侧的腐蚀、储罐腐蚀,尤其是储罐焊接部位的腐蚀,在焊接位置上由于焊接技术的不完善导致焊接部位常出现多余的空气、杂质和没有焊透的裂纹等问题,就储罐底板而言,由于储罐中储存的液体、清洗不干净的沉积物逐渐积攒下来,底板沉降不均最终造成储罐底板发生腐蚀现象。</p>\n<p><a href=\"https://ae-ndt.com/plus/view.php?aid=632\">https://ae-ndt.com/plus/view.php?aid=632</a></p>\n<p><em>视频-储罐底板腐蚀声发射检测案例</em></p>\n<h1>原理</h1>\n<p>常压储罐底板在运行过程中,由于底板经受环境的直接腐蚀,导致泄漏渗漏减薄等产生声波(声发射)信号,通过储罐所存储的介质或储罐底板传播到储罐壁板表面,储罐壁板表面的<a href=\"https://www.ae-ndt.com/\">声发射传感器</a>阵列接收信号,声波(声发射)检测仪对信号进行鉴别处理分析,最终实现对储罐底板进行腐蚀状况评价。</p>\n<p><img src=\"https://miro.medium.com/v2/resize:fit:1400/0*5Ao-d3tiZfR7T7UT.jpg\" alt=\"\"/></p>\n<h1>结果</h1>\n<ul><li>a. 按标准JB/T10764–2023无损检测常压金属罐体声发射检测与评价方法对罐体底板进行声发射在线检测监测;</li><li>b. 实现对罐底、罐体总体腐蚀情况进行评价,批量检测可根据储罐腐蚀情况制定相应的维修计划;</li><li>c. 不需要停产,就能实现在线检测,检测效率高、成本低、检测结果直观可靠,大幅降低劳动强度,减少环境污染。</li></ul>\n<h1>适用范围</h1>\n<p>适用于工作介质为气体或液体、工作压力为常压或小于0.1MPa的低压的新制造和在用地上立式储罐罐底板的声发射检测与评价。</p>\n<p><img src=\"https://miro.medium.com/v2/resize:fit:1400/0*Ups8KpoleRmu4ZRW.jpg\" alt=\"\"/><img src=\"https://miro.medium.com/v2/resize:fit:1400/0*Y82lCfi6kppZXlvv.jpg\" alt=\"\"/><img src=\"https://miro.medium.com/v2/resize:fit:1400/0*G311t36iOMPahMgv.jpg\" alt=\"\"/></p>\n<h1>解决方案</h1>\n<h1>1、传统声发射储罐底板检测方案</h1>\n<p><strong>原理:</strong>当储罐底板存在腐蚀缺陷导致腐蚀产物的剥离和脱落,产生声发射信号;底板发生泄漏,介质流动产生声发射信号,通过罐壁下部的声发射传感器阵列接收信号,声发射检测仪对信号进行处理分析,实现对罐底结构进行腐蚀状况评价。</p>\n<p>系统组成通讯方式声发射传感器、前置放大器、SAEU3H声波(声发射)检测仪、上位机软件USB、LAN网口、光纤</p>\n<p>设备型号SAEU3H集成声波(声发射)检测仪通道扩展多机箱可级联组成128通道声发射系统,每个机箱亦可作为独立主机使用采样频率单个通道最大采样率10M点/秒,采样率连续可调,每个通道可独立设置采样精度16位波形采集支持数据通过率单个USB3.0接口连接通过率最大高于300MB/秒,两个独立USB3.0接口连接通过率最大高于600MB/秒最大信号幅度100dB(使用40dB 前放,对应传感器输出为100毫伏)主机噪声﹤15dB(空载)动态范围85dB输入阻抗50Ω模拟滤波器高通滤波器:20kHz、100kHz、400kHz<br/>低通滤波器:100kHz、400kHz、1200kHz硬件实时数字滤波器1kHz-2MHz频率范围内任意数值设置直通、高通、低通、带通及带阻响应频率1kHz-2.5MHz(-3dB带宽)工作温度10℃~﹢45℃尺寸4通道机箱:320mm×125mm×50mm;(长×宽×高)<br/>20通道机箱:308mm×225mm×133mm;(长×宽×高)<br/>48通道机箱:308mm×368mm×133mm;(长×宽×高)优点USB3.0高速数据传输,扩展能力好,性能稳定,缺陷定位功能准确。适合常规检测。</p>\n<h2>SWAE软件</h2>\n<p><a href=\"https://www.ae-ndt.com/\">SWAE 声发射系统软件</a>是实时采集分析和事后分析软件的集合,适用<a href=\"https://ae-ndt.com/plus/view.php?aid=4\">SAEU3H集成声波(声发射)检测仪</a>、<a href=\"https://ae-ndt.com/plus/view.php?aid=604\">RAEM1–6声波(声发射)远程无人值守监测系统</a>、<a href=\"https://ae-ndt.com/plus/view.php?aid=609\">RAEM1系列远程声波(声发射)监测系统</a>,可对设备进行数据采集及回放分析等。主要功能:定位图、相关图、参数表、频域波形图等。</p>\n<h2>案例:兴三联合站储罐声发射在线检测与评价</h2>\n<p>储罐容积为5000立方米,直径22.7米,有效高度:16.14米,存储介质为原油,罐壁外涂有防腐漆,有复合铝镁硅酸盐卷毡保温及金属铁皮护板。</p>\n<ul><li><strong>声发射传感器布置:</strong>在距底板上方约50厘米的外壁一周均匀布置9个传感器,尽量避开管道、人孔等结构不连续位置,水平间距约7.8米。</li><li>图1.1 传感器布置图</li><li><strong>数据采集与分析:</strong>对储罐进行2小时的声发射检测:</li><li>图1.2 2#储罐 通道-撞击数 统计图</li></ul>\n<p><img src=\"https://miro.medium.com/v2/resize:fit:1354/0*6k6bpy9NDyX9X7kU.png\" alt=\"\"/></p>\n<ul><li>图1.3 2#储罐 时间-能量 统计图</li><li>图1.4 2#储罐2h时差定位图</li></ul>\n<p><img src=\"https://miro.medium.com/v2/resize:fit:1300/0*935nOJ9302kmUzr1.png\" alt=\"\"/></p>\n<ul><li>图1.5 保压数据定位图</li><li><strong>检测结果</strong></li><li>按照标准 JB/T 10764–2023常压金属储罐声发射检测及评价 中9.2内容,采用罐底板声发射源的时差定位分析及分级,根据表3声发射源分级参数推荐值, a=10,得到如下罐底声源的时差定位分析及声源级别划分结果:</li><li>根据图1.5,发现三处较为明显集中定位源区,定义为S1、S2、S3。</li><li>S1: E1=7; S2: E2=10; S3: E3=4;</li><li>根据罐底的时差定位情况,保压时共有173个有效定位事件,结合保压时液位高度,综合声发射特征参数考虑,由此得到完整性评价级别为Ⅰ级(无局部腐蚀迹象或存在轻微局部腐蚀迹象,维修/处理建议:不考虑维修,建议6年内再次进行声发射检测或选择开罐检测,以观察罐底板腐蚀的动态变化)。</li></ul>\n<h1>2、物联网智能无人值守声发射储罐监测方案</h1>\n<h2>2.1 基于RAEM1–6的集中式方案</h2>\n<p><strong>原理:</strong>储罐底板发生腐蚀缺陷、底板泄漏时产生声发射信号,传感器接收声波,信号经过声发射采集器进行处理和分析,通过4G/网口传输到云服务器,用户登录云平台(私有云/清诚云)远程查看数据、设置评级判据,系统自动根据判据给出评级结果,一旦达到报警阈值,自动报警推送。</p>\n<p>系统组成通讯方式声发射传感器、 <a href=\"https://ae-ndt.com/plus/view.php?aid=609\">RAEM1–6声波(声发射)检测仪</a>、云服务器、客户终端网口、WiFi、4G(注:可多个RAEM1–6采集器组成多通道监测系统,对大型设备进行实时监测)</p>\n<p><img src=\"https://miro.medium.com/v2/resize:fit:1400/0*2BGgJ3whaqNJlhBr.jpg\" alt=\"\"/></p>\n<h2>2.2 基于一体化RAEM1的分布式方案</h2>\n<p><strong>原理:</strong>储罐底板发生腐蚀缺陷、底板泄漏时产生声波(声发射)信号,声发射采集器接收信号进行处理和分析,通过4G/WiFi/LAN网络传输到云服务器,用户登录云平台(私有云/清诚云)远程查看数据、设置评级判据,系统自动根据判据给出评级结果,一旦达到报警阈值,自动报警推送。</p>\n<p>系统组成通讯方式声发射采集器(传感器,信号采集与分析,通讯)云服务器、客户终端网口、WiFi、4G(注:可多个RAEM1采集器组成多通道监测系统,对大型设进行备实时监测;传感器可选择内置或外置)</p>\n<h1>设备介绍</h1>\n<p>图片</p>\n<p><img src=\"https://miro.medium.com/v2/resize:fit:1400/0*00EsMGrG6wYAOxgB.jpg\" alt=\"\"/></p>\n<p>名称RAEM1–6声波(声发射)检测仪RAEM1声波(声发射)检测仪采样频率单个通道最大采样率2M点/秒单个通道最大采样率2M点/秒采样精度16位16位通道数单通道、6通道或级联使用单通道频率范围10KHz-800KHz10KHz-800KHz系统噪声优于30dB优于30dB动态范围70dB70dB通讯方式4G、网口、WiFi4G、网口、WiFi、RS485供电12VDC12VDC尺寸长×宽×高:22cm×13cm×8cm圆筒直径φ62mm,高度 100mm重量1.6kg220g安装/底部自带磁性,可吸附于被测物体表面防护等级/IP65工作温度-20℃~60℃。(WiFi版本为0℃~60℃)-20℃~60℃。(WiFi版本为0℃~60℃)优势基于Linus操作系统,性能稳定,具有无线通信能力,适合长时间远程无人值守监控,设备可级联组成大型监测系统。声发射检测仪内置了信号处理、通讯模块,底部带磁性,安装时可将设备直接与金属物体耦合。</p>\n<h1>声发射传感器</h1>\n<p>图片</p>\n<p><img src=\"https://miro.medium.com/v2/resize:fit:1400/0*4Pndva2r_4qgVbjj.jpg\" alt=\"\"/></p>\n<p>频率范围15KHz~70KHz60KHz~400KHz谐振频率40KHz150KHz灵敏度>75dB>75dB前置放大器40dB28V40dB28V接口类型BNCBNC应用罐底腐蚀罐体裂纹安装方法底部涂抹适量的耦合剂,利用磁夹具辅助安装</p>\n<h1>过程可视化</h1>\n<p>365天在线<a href=\"https://ae-ndt.com/\">声发射监测检测</a>,全过程自动分析结果,物联网远程操作使用。</p>\n<ul><li>自动给出检测监测诊断结果</li><li>在线和历史数据屏幕显示</li></ul>\n<h1>智能采集器自动工作原理</h1>\n<p><strong>云端计算机工作原理:</strong>统计采集周期内各个通道的撞击数,按照声发射源分级参数推荐值计算出各通道源极别,根据各通道源级别计算储罐总的级别,显示总级别及各通道级别分布图,自动给出报告(PDF)储存在云端,可下载。</p>\n<h1>清诚云</h1>\n<p>数据上传到云端物联网平台(清诚云)显示分析。AE特征参数:到达时间,幅度,振铃计数,能量,上升时间,持续时间,RMS,ASL。</p>\n<p>远程配置:远程配置参数、滤波配置、FFT配置、定时配置等。</p>\n<p><img src=\"https://miro.medium.com/v2/resize:fit:1400/0*ffY-rLv9j2QN6ixp.jpg\" alt=\"\"/></p>\n<p>系统自动评级,云端远程查看评级结果。声发射数据采用自动分级算法,由声发射特征参数得到强度级别,活度级别,综合级别,灵活设置,可满足不同行业标准的评级需求。</p>\n<p><img src=\"https://miro.medium.com/v2/resize:fit:1400/0*Upu8k1YsXdLbZBRo.jpg\" alt=\"\"/></p>\n<p>相关图:使用参数表中包含的2个声发射参数为横、纵坐标,画出相关曲线或者分布点图、线图等。</p>\n<h1>实际案例</h1>\n<p>储罐因腐蚀导致底板减薄和穿孔泄漏的事故时有发生。据统计,由于腐蚀而引起的储罐失效占全部储罐失效的60%以上。采取有效的储罐检测方法,对安全生产、节约资源和保护环境都具有重大意义。</p>\n<p><img src=\"https://miro.medium.com/v2/resize:fit:1000/0*_MkPoY7Ic9DEkyg9.png\" alt=\"\"/></p>\n<p><em>视频-储罐底板腐蚀声发射检测案例</em></p>\n<p><a href=\"https://ae-ndt.com/plus/view.php?aid=476\"><strong>1)声发射检测在古巴国家石油公司(CUPET)罐底检测培训应用案例</strong></a></p>\n<p><img src=\"https://miro.medium.com/v2/resize:fit:790/0*_PpdZeZbzKMlzfYN.png\" alt=\"\"/><img src=\"https://miro.medium.com/v2/resize:fit:790/0*c7zI6jL2ITik6-_E.png\" alt=\"\"/></p>\n<p>2017年3月6日至3月12日,在古巴马坦萨斯港口油库罐区,依照中国机械工业标准《JB/T 10764–2007常压金属储罐声发射检测及评价方法》进行检测。</p>\n<p><img src=\"https://miro.medium.com/v2/resize:fit:790/0*HD_5LYiCGUsQ9pKE.png\" alt=\"\"/><img src=\"https://miro.medium.com/v2/resize:fit:790/0*dbhVyYs9XXxOCVAa.png\" alt=\"\"/></p>\n<p>罐号TK-56(2012年投入使用),直径74米,设计液面高度10.8米,材质A516-Gr70</p>\n<p>近一个月加载历史显示,最高液面达到过10.6米,计划本次检测液面升至10.8米。根据周长设计探头位置,实际使用通道数量为29个通道,传感器间距为约8米。最后,针对古巴国家石油公司储罐群情况,进行了全面检测。根据撞击数分布情况,确定了开罐复验的具体执行方案,并依据开罐结果,制定出后续年度检验的合格标准。</p>\n<p><img src=\"https://miro.medium.com/v2/resize:fit:790/0*-EXZdjTa3my8f9Ne.png\" alt=\"\"/><img src=\"https://miro.medium.com/v2/resize:fit:790/0*bCvkbJvIQMXvGwq7.png\" alt=\"\"/></p>\n<p><a href=\"https://ae-ndt.com/plus/view.php?aid=476\"><strong>2)中原油田储罐声波(声发射)检测</strong></a></p>\n<p>待检测常压储罐外观</p>\n<p>受中原油田油气储运管理处委托,我司于2006年8月对中原油田20000m3储罐进行声波(声发射)检验。</p>\n<p><img src=\"https://miro.medium.com/v2/resize:fit:790/0*ySBIC0JZZR6KOBdh.png\" alt=\"\"/><img src=\"https://miro.medium.com/v2/resize:fit:790/0*Suc_VhrU-NaPEmf-.png\" alt=\"\"/></p>\n<p>3)江西特检所-九江石化储罐罐底检测</p>\n<p><img src=\"https://miro.medium.com/v2/resize:fit:1400/0*3XnY3VXDOy4pjpDE.png\" alt=\"\"/></p>\n<p>储罐外观</p>\n<p><img src=\"https://miro.medium.com/v2/resize:fit:790/0*j8qg9JK_3AXRI8Aj.png\" alt=\"\"/><img src=\"https://miro.medium.com/v2/resize:fit:790/0*i5iNmE4p01TKsa4_.png\" alt=\"\"/></p>\n<p>传感器安装</p>\n<p>前置放大器</p>\n<p><img src=\"https://miro.medium.com/v2/resize:fit:790/0*o0AEOW7epx9L5ivz.png\" alt=\"\"/><img src=\"https://miro.medium.com/v2/resize:fit:790/0*wNRic98O7A1MtLoK.png\" alt=\"\"/></p>\n<p>主机采集信号</p>\n<p>现场图</p>\n<p><a href=\"https://ae-ndt.com/plus/view.php?aid=606\"><strong>4)特油公司特一联合站储罐声波(声发射)在线检测</strong></a></p>\n<p><img src=\"https://miro.medium.com/v2/resize:fit:1400/0*UV0qQqWtKi30_HAs.png\" alt=\"\"/></p>\n<p>储罐类型为外拱顶储罐,储罐容积为10000立方米,直径27.75米,有效高度14.8米,存储介质为原油,安全液位12.5米,检测初始液位17.8米,罐壁外涂有防腐漆,有保温板及金属铁皮护板。</p>\n<p><img src=\"https://miro.medium.com/v2/resize:fit:1400/0*w7z3brJPQGuZ0wOq.png\" alt=\"\"/></p>\n<p>现场传感器部分安装图</p>\n<p><img src=\"https://miro.medium.com/v2/resize:fit:1082/0*bLmT-GzExtcz3smL.png\" alt=\"\"/></p>\n<p>数据分析图1</p>\n<p><img src=\"https://miro.medium.com/v2/resize:fit:1400/0*gDs50yPvL495ozG3.png\" alt=\"\"/></p>\n<p>时间-能量统计图</p>\n<p><img src=\"https://miro.medium.com/v2/resize:fit:806/0*y0phYkzyUi8v1rSI.png\" alt=\"\"/></p>\n<p>时差定位图</p>\n<p>\r<br/>\r<br/></p>\n</html>",
"json_metadata": "{\"tags\":[\"tankmonitoring\"],\"image\":[\"https://miro.medium.com/v2/resize:fit:1400/0*5Ao-d3tiZfR7T7UT.jpg\",\"https://miro.medium.com/v2/resize:fit:1400/0*Ups8KpoleRmu4ZRW.jpg\",\"https://miro.medium.com/v2/resize:fit:1400/0*Y82lCfi6kppZXlvv.jpg\",\"https://miro.medium.com/v2/resize:fit:1400/0*G311t36iOMPahMgv.jpg\",\"https://miro.medium.com/v2/resize:fit:1354/0*6k6bpy9NDyX9X7kU.png\",\"https://miro.medium.com/v2/resize:fit:1300/0*935nOJ9302kmUzr1.png\",\"https://miro.medium.com/v2/resize:fit:1400/0*2BGgJ3whaqNJlhBr.jpg\",\"https://miro.medium.com/v2/resize:fit:1400/0*00EsMGrG6wYAOxgB.jpg\",\"https://miro.medium.com/v2/resize:fit:1400/0*4Pndva2r_4qgVbjj.jpg\",\"https://miro.medium.com/v2/resize:fit:1400/0*ffY-rLv9j2QN6ixp.jpg\",\"https://miro.medium.com/v2/resize:fit:1400/0*Upu8k1YsXdLbZBRo.jpg\",\"https://miro.medium.com/v2/resize:fit:1000/0*_MkPoY7Ic9DEkyg9.png\",\"https://miro.medium.com/v2/resize:fit:790/0*_PpdZeZbzKMlzfYN.png\",\"https://miro.medium.com/v2/resize:fit:790/0*c7zI6jL2ITik6-_E.png\",\"https://miro.medium.com/v2/resize:fit:790/0*HD_5LYiCGUsQ9pKE.png\",\"https://miro.medium.com/v2/resize:fit:790/0*dbhVyYs9XXxOCVAa.png\",\"https://miro.medium.com/v2/resize:fit:790/0*-EXZdjTa3my8f9Ne.png\",\"https://miro.medium.com/v2/resize:fit:790/0*bCvkbJvIQMXvGwq7.png\",\"https://miro.medium.com/v2/resize:fit:790/0*ySBIC0JZZR6KOBdh.png\",\"https://miro.medium.com/v2/resize:fit:790/0*Suc_VhrU-NaPEmf-.png\",\"https://miro.medium.com/v2/resize:fit:1400/0*3XnY3VXDOy4pjpDE.png\",\"https://miro.medium.com/v2/resize:fit:790/0*j8qg9JK_3AXRI8Aj.png\",\"https://miro.medium.com/v2/resize:fit:790/0*i5iNmE4p01TKsa4_.png\",\"https://miro.medium.com/v2/resize:fit:790/0*o0AEOW7epx9L5ivz.png\",\"https://miro.medium.com/v2/resize:fit:790/0*wNRic98O7A1MtLoK.png\",\"https://miro.medium.com/v2/resize:fit:1400/0*UV0qQqWtKi30_HAs.png\",\"https://miro.medium.com/v2/resize:fit:1400/0*w7z3brJPQGuZ0wOq.png\",\"https://miro.medium.com/v2/resize:fit:1082/0*bLmT-GzExtcz3smL.png\",\"https://miro.medium.com/v2/resize:fit:1400/0*gDs50yPvL495ozG3.png\",\"https://miro.medium.com/v2/resize:fit:806/0*y0phYkzyUi8v1rSI.png\"],\"links\":[\"https://ae-ndt.com/plus/view.php?aid=632\",\"https://www.ae-ndt.com/\",\"https://ae-ndt.com/plus/view.php?aid=4\",\"https://ae-ndt.com/plus/view.php?aid=604\",\"https://ae-ndt.com/plus/view.php?aid=609\",\"https://ae-ndt.com/\",\"https://ae-ndt.com/plus/view.php?aid=476\",\"https://ae-ndt.com/plus/view.php?aid=606\"],\"app\":\"steemit/0.2\",\"format\":\"html\"}",
"parent_author": "",
"parent_permlink": "tankmonitoring",
"permlink": "3auzdz",
"title": "常压储罐底板腐蚀在线检测监测系统"
}
],
"op_in_trx": 0,
"timestamp": "2024-11-08T09:55:45",
"trx_id": "76139b39118c7d1c073ce55e02926d4e2ab62a39",
"trx_in_block": 3,
"virtual_op": 0
}barryleepublished a new post: 67kywd-14-ae-sensor-manufacturers-in-20242024/10/29 08:50:33
barryleepublished a new post: 67kywd-14-ae-sensor-manufacturers-in-2024
2024/10/29 08:50:33
| author | barrylee |
| body | <html> <p> <br/> <br/><img src="https://miro.medium.com/v2/resize:fit:516/0*rw2-2u2eN6R_ZgRU.png" alt=""/><img src="https://miro.medium.com/v2/resize:fit:400/0*mcV56NbDa9qhzdzE.png" alt=""/><img src="https://miro.medium.com/v2/resize:fit:400/0*eyqkksjwXolLZIj9.png" alt=""/>Qawrums Ltd.<img src="https://miro.medium.com/v2/resize:fit:1400/0*-Ez5yz6hZ59qL3wd.png" alt=""/><img src="https://miro.medium.com/v2/resize:fit:400/0*7VHnFiWSXp74Ka4O.png" alt=""/><img src="https://miro.medium.com/v2/resize:fit:400/0*DpJog2KVLTemg3mE.png" alt=""/><img src="https://miro.medium.com/v2/resize:fit:552/0*rK_Vy_UNR0bjDQEZ.png" alt=""/><img src="https://miro.medium.com/v2/resize:fit:334/0*h-Q2fBWeQrZlN4Qe.png" alt=""/><img src="https://miro.medium.com/v2/resize:fit:1200/0*ky-6BwWcJBAKiYI6.png" alt=""/></p> <h1>14 AE Sensor Manufacturers in 2024</h1> <p>This section provides an overview for ae sensors as well as their applications and principles. Also, please take a look at <a href="https://us.metoree.com/categories/2129/#manufacturers">the list of 14 ae sensor manufacturers </a>and <a href="https://us.metoree.com/categories/2129/#rankings">their company rankings</a>. Here are the top-ranked ae sensor companies as of October, 2024: 1.Guzik, 2.Qing Cheng, 3.ACCRETECH.</p> <p>Table of Contents</p> <ul><li><a href="https://us.metoree.com/categories/2129/#h2-title-0">What Is an AE Sensor?</a></li><li><a href="https://us.metoree.com/categories/2129/#manufacturers">List of 14 AE Sensor Manufacturers</a></li><li><a href="https://us.metoree.com/categories/2129/#global-distribution">Global Distribution of AE Sensor Manufacturers by Country</a></li></ul> <h1>What Is an AE Sensor?</h1> <p>An AE Sensor is a type of <a href="https://us.metoree.com/categories/2051">vibration sensor</a> that detects a specific vibration (AE wave).</p> <p>AE stands for Acoustic Emission, a phenomenon in which acoustic waves are emitted as elastic waves when a part of an object is deformed or damaged, or when a shock is applied.</p> <p>AE Sensors are used to detect this phenomenon, which is caused by minute degradation that occurs long before the object is completely damaged.</p> <p>AE Sensors are used for <a href="https://us.metoree.com/categories/7181">predictive maintenance</a> of industrial facilities and quality control of products.</p> <h1>Applications of AE Sensor</h1> <p>AE Sensors are used in a variety of applications, including product quality control and <a href="https://us.metoree.com/categories/5241">safety control</a>. There are two types of AE sensors: a narrow-band type that reacts strongly in a specific narrow frequency band and a wide-band type that reacts in a wide frequency band, which can be used for different purposes.</p> <h2>1. Narrow-Band Type AE Sensor</h2> <p>Narrow-band AE Sensors are used in applications such as predictive maintenance of motor deterioration and detection of defects in metal welding such as pipes. Narrow-band AE Sensors do not react to vibrations from normally operating motors or welding, but can detect AE waves that are generated only when an abnormality occurs.</p> <h2>2. Wide-Band AE Sensor</h2> <p>The wide-band AE Sensor is used to detect foreign objects inside products and to detect signs of landslides in the ground. By using the broadband AE Sensor, it is possible to detect minute fragments of solder falling from a unit board inside a product or minute vibrations that may be a <a href="https://us.metoree.com/categories/6058/">precursor</a> to a landslide in the ground.</p> <h1>Principle of AE Sensor</h1> <p>AE Sensor detects AE waves by using a special piezoelectric element. Materials commonly used as piezoelectric elements are <a href="https://us.metoree.com/categories/6381">lithium niobate</a>, lead niobate, and lead zirconate titanate (PZT). These elements are characterized by the fact that an electric charge is generated when pressure is applied. Therefore, by bringing these piezoelectric elements into contact with a vibrating object, they can receive a voltage from the piezoelectric element and function as a sensor.</p> <p>In addition, these piezoelectric elements output a strong voltage when subjected to pressure from vibrations in the ultra-high frequency range (10 kHz to several MHz), such as AE waves, making it possible to detect only vibrations in a specific frequency band.</p> <h1>Other Information on AE Sensor</h1> <h2>1. Difference Between AE Sensor and Vibration Sensor</h2> <p>Both sensors use piezoelectric elements to convert mechanical vibration into electricity. However, they differ in the frequency range for which they are suitable. Vibration <a href="https://us.metoree.com/categories/accelerometer">acceleration sensors</a> are suitable for detection in a relatively low frequency range, such as 5 to 20 kHz.</p> <p>AE Sensors, on the other hand, detect higher frequency vibrations than <a href="https://us.metoree.com/categories/2051">vibration sensors</a>. By detecting higher frequencies, early defects can be detected at an early stage.</p> <p>In some cases, AE sensors have been applied to low-speed rotating <a href="https://us.metoree.com/categories/5313">bearings</a>, which are difficult to diagnose with vibration sensors. This is because AE Sensor captures acoustic emissions, which are energy waves generated by micro-level breakdown.</p> <p>Acoustic emissions are like ripples on the surface of water. When metal-to-metal contact occurs, acoustic emissions propagate through the metal of the equipment surface and are detected by the AE Sensor. Since acoustic emissions are generated even from small scratches and friction, it is possible to detect problems at an early stage.</p> <h2>2. Installation of AE Sensor</h2> <p>When installing AE Sensor, the mounting position is important. If the AE sensor can be mounted directly on the object to be detected, it has the best detection sensitivity and is not a problem.</p> <p>On the other hand, if it is not possible to mount the AE sensor directly on the target, it is important to mount it as close as possible to the target. An acoustic path must be formed between the target and the AE Sensor, and when installing the AE Sensor, silicone <a href="https://us.metoree.com/categories/2427/">grease</a> or similar material should be applied to the surface of the target to make it adhere to the AE Sensor, so that the acoustic emissions generated by the AE Sensor can be detected.</p> <p>Acoustic emissions have a high frequency and are difficult to propagate in air. Therefore, when mounting the AE Sensor, it is important to adhere it closely to the object to be detected. Furthermore, it is also important to install the sensor after thorough verification using a prototype.</p> <h1>List of 14 AE Sensor Manufacturers</h1> <p>*Including some distributors, etc.</p> <p>Sort by Features</p> <ul><li>Default</li><li>Company Size: largest first</li><li>Year Founded: oldest first</li><li>Year Founded: earliest first</li></ul> <p>Sort by Area</p> <ul><li>United States of America</li><li>Canada</li><li>China</li><li>Germany</li><li>Italy</li><li>Republic of Korea</li><li>Switzerland</li><li>United Kingdom</li></ul> <p><img src="https://miro.medium.com/v2/resize:fit:400/0*CIA4L1c3Q2YbGqmq.png" alt=""/></p> <ul><li><strong>Guzik</strong></li><li><strong>Manufacturer</strong></li><li><a href="https://www.guzik.com/product/miniature-ae/"><strong>Miniature AE Sensor with Isolated Integral 30 d</strong></a></li><li><a href="https://www.guzik.com/">Website</a></li><li>United States, California</li><li><a href="https://us.metoree.com/companies/160120/">Company Profile</a></li></ul> <p><img src="https://miro.medium.com/v2/resize:fit:200/0*NL_e3YexTLKhz9US.png" alt=""/></p> <ul><li>Address: 443 Wyandotte Street, Mountain View, California, United States of America</li><li>Manufacturer Overview</li><li>Guzik Technical Enterprises, established in 1982, is a manufacturer of test and measurement equipment located in the USA. The company’s product portfolio includes digitizers featuring 10-bit Keysight Analog to Digital A/D converters with sampling rates up to 32 Gsps and analog bandwidth up to 10 GHz1. These digitizers are combined with a digital processor, offering real-time processing and streaming Optical Data Interfaces (ODI). It provides advanced solutions to various sectors including medical imaging, aerospace and defense, satellite, Pulse RADAR test, and system integration. Its products are designed to enhance the success rate of projects and improve efficiency.</li></ul> <p><img src="https://miro.medium.com/v2/resize:fit:400/0*ol3QvTuL0MdEyQbh.png" alt=""/></p> <ul><li><strong>MISTRAS Group, Inc.</strong></li><li><strong>Manufacturer</strong></li><li><a href="https://www.physicalacoustics.com/sensors/"><strong>AE sensors</strong></a></li><li><a href="https://www.mistrasgroup.com/">Website</a></li><li>United States, New Jersey</li><li><a href="https://us.metoree.com/companies/141565/">Company Profile</a></li></ul> <p><img src="https://miro.medium.com/v2/resize:fit:200/0*7VFe_m4wSHPQePGv.png" alt=""/></p> <ul><li>Address: 195 Clarksville Rd, Princeton Jct, New Jersey, United States of America</li><li>Manufacturer Overview</li><li>MISTRAS Group, established in 1978, is a manufacturer and global supplier headquartered in Princeton, New Jersey, specializing in non-destructive testing (NDT) equipment and asset protection solutions. The company’s product portfolio includes NDT technologies such as advanced acoustic emission (AE) and ultrasonic testing (UT) equipment. It also offers field inspections, lab testing, maintenance, monitoring, and data management services. These offerings serve diverse sectors such as academia, aerospace, defense, infrastructure, and manufacturing. The company adheres to ISO 9001:2015 quality standards with locations worldwide, serving clients across North America, Europe, Asia, and beyond.</li></ul> <p><img src="https://miro.medium.com/v2/resize:fit:400/0*8aL8u5JhXtlhhsnK.png" alt=""/></p> <ul><li><strong>Qing Cheng (</strong>The current name is <a href="https://www.aendt.com/">Qawrums Ltd.</a>)</li><li><strong>Manufacturer</strong></li><li><a href="https://www.aendt.com/"><strong>Acoustic Emission</strong></a></li><li><a href="https://www.aendt.com/">Website</a></li><li>China</li><li><a href="https://us.metoree.com/companies/145808/">Company Profile</a></li></ul> <p><img src="https://miro.medium.com/v2/resize:fit:200/0*-isxncq0nqDy3YFZ.png" alt=""/></p> <ul><li>Address: 601–9,Building 3, 232 Ke Zhu Road, Huang Pu District, Guang Zhou City, Guang Dong, China</li><li>Manufacturer Overview</li><li>QingCheng Ltd, an ISO 9001:2015 certified manufacturer, specializes in non-destructive testing (NDT) systems and condition monitoring solutions. Known for its IIoT acoustic emission online monitoring systems and NDT products, the company offers online condition monitoring solutions for industrial assets. The company’s offerings include acoustic emission (AE) systems, such as AE sensors, pre-amplifiers, and AE acquisition instruments. The company also provides handheld ultrasonic devices, ultrasonic thickness detectors, and flaw detectors. QingCheng offers professional analysis software and an IoT Cloud platform, serving both laboratory and industrial needs worldwide.</li><li>Qawrums Ltd. is a leading manufacturer of acoustic emission testing equipment in China.<br/>It offers a range of AE testing equipment, including sensors, amplifiers, and data acquisition systems<br/>Applications: materials testing, NDT, and structural health monitoring</li></ul> <p><img src="https://miro.medium.com/v2/resize:fit:400/0*-x3sjaqMqL2x6Pp5.png" alt=""/></p> <ul><li><strong>ACCRETECH</strong></li><li><strong>Manufacturer</strong></li><li><a href="https://www.accretech.eu/en/process-control/in-spindle-ae-sensors/"><strong>In-Spindle AE Sensors</strong></a></li><li><a href="https://www.accretech.eu/en/">Website</a></li><li>United Kingdom</li><li><a href="https://us.metoree.com/companies/101351/">Company Profile</a></li></ul> <p><img src="https://miro.medium.com/v2/resize:fit:200/0*iZOmSWjRdRxmWRQ4.png" alt=""/></p> <ul><li>Address: Unit2, Leofric Court Progress Way, Coventry, United Kingdom</li><li>Manufacturer Overview</li><li>ACCRETECH, formerly known as Tokyo Seimitsu Kogu Co., Ltd., is a Japanese manufacturer of precision machining and metrology solutions since 1949. Based in Hachioji-shi, Tokyo, the company produces various wafer metrology systems for measuring the physical properties of semiconductor wafers, metrology systems for assessing the surface quality of different surfaces, as well as precision machining tools including polishing and optical grinding machines. These product serve clients in automotive, semiconductor and medical device manufacturing.</li></ul> <p><img src="https://miro.medium.com/v2/resize:fit:334/0*mL87OLPk2AaMesVM.png" alt=""/></p> <ul><li><strong>Marposs</strong></li><li><strong>Manufacturer</strong></li><li><a href="https://www.marposs.com/eng/product/acoustic-emission-sensors#:~:text=Artis%20AE%20sensors%20(Acoustic%20Emission,elements%20involved%20in%20the%20process."><strong>Artis AE sensors</strong></a></li><li><a href="https://www.marposs.com/eng/">Website</a></li><li>Founded: 1952</li><li>Italy</li><li><a href="https://us.metoree.com/companies/15377/">Company Profile</a></li></ul> <p><img src="https://miro.medium.com/v2/resize:fit:200/0*e-AIsbumGO2cDMSG.png" alt=""/></p> <ul><li>Address: Via Saliceto 13 , Bentivoglio, Italy</li><li>Manufacturer Overview</li><li>Marposs S.p.A. is headquartered in Bentivoglio, Italy. The company serves industries such asa aerospace, semiconductors, machine tooling, and biomedical as a manufacturer and as a service provider. The company’s products vary by industry but include tools for gauging, profiling, and monitoring, as well as data management systems and machines for testing and automation. The company’s services include after sales service, customer training, original spare parts, retrofit and upgrade of existing machinery, and project management consulting services.</li></ul> <p><img src="https://miro.medium.com/v2/resize:fit:516/0*mkYhcimlszYCbQEL.png" alt=""/></p> <ul><li><strong>Tosei America Inc</strong></li><li><strong>Manufacturer</strong></li><li><a href="https://www.toseieng.co.jp/component/en/component02/pulcom-ge-10.html"><strong>PULCOM GE-10</strong></a></li><li><a href="http://www.toseieng.co.jp/global/acctusawebsite/usaindex.html">Website</a></li><li><a href="https://us.metoree.com/companies/8970/">Company Profile</a></li><li>Manufacturer Overview</li><li>Tosei America Inc., founded in 2009 and located in Cincinnati, Ohio, is a manufacturer of automatic measuring equipment for production lines of precision automotive parts, bearings, and electronic products. The company provides a range of products, including gages, micrometers, digital measuring instruments, laser interferometers, and automatic measuring systems. Their products cater to diverse industries such as automotive, bearings, and the electronics industry. These products are used to ensure adherence to industry standards, detect defects or variations, and verify the reliability and precision of the produced components.</li></ul> <p><img src="https://miro.medium.com/v2/resize:fit:1200/0*KEpvnCCMbf6vwFKu.png" alt=""/></p> <ul><li><strong>Kistler Instrument Corp.</strong></li><li><strong>Manufacturer</strong></li><li><a href="https://www.kistler.com/INT/en/cp/acoustic-emission-ae-measuring-chains-ae-sensor-plus-ae-coupler-both-selectable-8852a/P0001210"><strong>Acoustic emission AE measuring chains</strong></a></li><li><a href="https://www.kistler.com/en/">Website</a></li><li>Founded: 1959</li><li><a href="https://us.metoree.com/companies/391/">Company Profile</a></li><li>Manufacturer Overview</li><li>Founded in Switzerland, Kistler serves both public and private customers in the automotive, aerospace, maritime, transportation, medical, semiconductor, energy and life sciences industries. Products include sensors as well as connectivity, signal, and data acquisition devices as well as software solutions. Applications of these solutions include R&D to safety testing, and condition monitoring. Key technologies include dynamic pressure, force, torque and acceleration measurement technologies.</li></ul> <p><img src="https://miro.medium.com/v2/resize:fit:400/0*CkJQJ4iDwFVlvFnX.png" alt=""/></p> <ul><li><strong>RECTUSON CO., LTD.</strong><br/><a href="http://rectuson.com/en/product/02_rt_ae300.jsp"><strong>Acoustic Emission System</strong></a></li><li><a href="http://rectuson.com/en/index/index.jsp">Website</a></li><li>Republic of Korea</li><li><a href="https://us.metoree.com/companies/207065/">Company Profile</a></li></ul> <p><img src="https://miro.medium.com/v2/resize:fit:200/0*dzzUtfe5yb6PUpe0.png" alt=""/></p> <ul><li>Address: 51756 Gaposinhangnam-ro 12–1, Masanhappo-gu, Changwon-si, Gyeongsangnam-do, Republic of Korea</li></ul> <p><img src="https://miro.medium.com/v2/resize:fit:400/0*1rW9VplRIV25atXF.png" alt=""/></p> <ul><li><strong>MPM Micro Praezision Marx GmbH & Co. KG</strong><br/><a href="https://www.mpmgmbh.de/en/products/ae-acoustic-emission-systems/ae-sensor-technology.html"><strong>AE sensor technology</strong></a></li><li><a href="https://www.mpmgmbh.de/en/index.html">Website</a></li><li>Germany</li><li><a href="https://us.metoree.com/companies/206240/">Company Profile</a></li></ul> <p><img src="https://miro.medium.com/v2/resize:fit:200/0*Dec7PJwVcSTkZfVP.png" alt=""/></p> <ul><li>Address: Neuenweiherstrasse 19 Erlangen, Freistaat Bayern, Germany</li></ul> <p><img src="https://miro.medium.com/v2/resize:fit:400/0*OjXGMapRuRYQGkzz.png" alt=""/></p> <ul><li><strong>Benthowave Instrument Inc.</strong><br/><a href="https://www.benthowave.com/products/BII-7230AE.html"><strong>AE Sensor</strong></a></li><li><a href="https://www.benthowave.com/index.html">Website</a></li><li>Canada</li><li><a href="https://us.metoree.com/companies/206234/">Company Profile</a></li></ul> <p><img src="https://miro.medium.com/v2/resize:fit:200/0*kKTNIauz0kb8ad3Z.png" alt=""/></p> <ul><li>Address: 89 Kells Crescent,Collingwood, Ontario, Canada</li></ul> <p><img src="https://miro.medium.com/v2/resize:fit:552/0*YlID0BmG27lZBE_8.png" alt=""/></p> <ul><li><strong>MDPI</strong><br/><a href="https://www.mdpi.com/2076-3417/10/24/8966"><strong>MEMS Acoustic Emission Sensors</strong></a></li><li><a href="https://www.mdpi.com/journal/metals">Website</a></li><li>Switzerland</li><li><a href="https://us.metoree.com/companies/191032/">Company Profile</a></li></ul> <p><img src="https://miro.medium.com/v2/resize:fit:200/0*5tEAReH6kWO_YU5f.png" alt=""/></p> <ul><li>Address: St. Alban-Anlage 66 4052 Base, Switzerland</li><li>Company Overview</li><li>MDPI was founded in 1996 and is based in Basel, Switzerland. The company is a pioneer in scholarly, open-access publishing, featuring 417 peer-reviewed journals and 9 conference journals with over 115,000 academic contributors. The company’s journals fall into 10 subjects including biology, economics, medicine, physical sciences, and public health. The company’s pear review system is a dingle-blind assessment with at least two independent reviewers, followed by a final decision of acceptance or rejection by the editor-in-chief. Authors may appeal editorial decisions in case of rejection of articles.</li></ul> <p><img src="https://miro.medium.com/v2/resize:fit:1400/0*hNcfcmFpEjFOnmni.png" alt=""/></p> <ul><li><strong>Optica Publishing Group</strong><br/><a href="https://opg.optica.org/abstract.cfm?uri=ol-34-12-1858"><strong>acoustic emission sensor</strong></a></li><li><a href="https://opg.optica.org/">Website</a></li><li><a href="https://us.metoree.com/companies/192821/">Company Profile</a></li></ul> <p><img src="https://miro.medium.com/v2/resize:fit:1400/0*mzapbR_YJZ9vcPz4.png" alt=""/></p> <ul><li><strong>AIP Publishing LLC.</strong></li><li><strong>Distributor</strong></li><li><a href="https://aip.scitation.org/doi/pdf/10.1063/1.5084509"><strong>acoustic emission sensors</strong></a></li><li><a href="https://aip.scitation.org/journal/jcp">Website</a></li><li><a href="https://us.metoree.com/companies/192774/">Company Profile</a></li><li>Distributor Overview</li><li>AIP Publishing LLC., founded in Melville, NY, in 2013 is a supplier of online research journals, conference proceedings, and essential information for physical scientists. The company’s product portfolio includes e-books, product guides, sector news and peer-reviewed research journals covering a wide spectrum of subjects about science, technology, medicine, and social sciences. They serve industries such as Healthcare and Medicine, Industry and Innovation, Academia, and Social Sciences. wholly owned not-for-profit subsidiary of the American Institute of Physics (AIP).</li></ul> <p><img src="https://miro.medium.com/v2/resize:fit:400/0*0VPn-JW3T8vtJeQZ.png" alt=""/></p> <ul><li><strong>MISTRAS Services</strong></li><li><strong>Distributor</strong></li><li><a href="https://www.mistrasgroup.com/united-kingdom/how-we-help/equipment/ae/"><strong>ACOUSTIC EMISSION (AE) INSPECTION AND MONITORING PRODUCTS, SYSTEMS, AND SENSORS</strong></a></li><li><a href="https://www.mistrasgroup.com/services/">Website</a></li><li>Number of Employees: 5,400</li><li><a href="https://us.metoree.com/companies/165206/">Company Profile</a></li><li>Distributor Overview</li><li>Mistras Services, founded in 1978 and headquartered in New Jersey, is a global technology services supplier specializing in integrated technology-enabled asset protection solutions. The company’s portfolio of services includes field inspections, lab testing, maintenance services, monitoring and data management. These services help in enhancing safety and operational effeciency in sectors such as oil and gas, aerospace, defense, civil infrastructure, and manufacturing. With 120 locations worldwide, Mistras adheres to an internationally-recognized ISO-9001 Quality Management System, serving clients across North America, Europe, Asia and beyond.</li></ul> <h1>AE Sensor Manufacturer Ranking</h1> <p>*Including some distributors, etc.</p> <p>Ranking as of October 2024</p> <p><a href="https://us.metoree.com/categories/2129/#how-to-create-ranking">Derivation Method</a></p> <p>RankCompanyClick Share<strong>1</strong><a href="https://www.guzik.com/">Guzik</a></p> <p>12.9%</p> <p><a href="https://www.aendt.com/">2 Qing Cheng</a></p> <p>11.8%</p> <p><a href="https://www.accretech.eu/en/"><strong>3</strong>ACCRETECH</a></p> <p>9.9%</p> <p><a href="https://www.mdpi.com/journal/metals"><strong>4</strong>MDPI</a></p> <p>8.4%</p> <p><a href="https://opg.optica.org/"><strong>5</strong>Optica Publishing Group</a></p> <p>7.6%</p> <p><a href="https://www.mistrasgroup.com/"><strong>6</strong>MISTRAS Group, Inc.</a></p> <p>6.8%</p> <p><a href="https://www.mpmgmbh.de/en/index.html"><strong>7</strong>MPM Micro Praezision Marx GmbH & Co. KG</a></p> <p>6.5%</p> <p><a href="https://www.marposs.com/eng/"><strong>8</strong>Marposs</a></p> <p>6.5%</p> <p><a href="https://www.kistler.com/en/"><strong>9</strong>Kistler Instrument Corp.</a></p> <p>6.1%</p> <p><strong>10</strong><a href="https://www.benthowave.com/index.html">Benthowave Instrument Inc.</a></p> <p>5.7%</p> <p>Derivation Method</p> <p>The ranking is calculated based on the click share within the ae sensor page as of October 2024. Click share is defined as the total number of clicks for all companies during the period divided by the number of clicks for each company.</p> <p>Number of Employees</p> <ol><li>MISTRAS Services: 5,400</li></ol> <p>Newly Established Company</p> <ol><li>Kistler Instrument Corp.: 1959 (65 years ago)</li><li>Marposs: 1952 (72 years ago)</li></ol> <p>Company with a History</p> <ol><li>Marposs: 1952 (72 years ago)</li><li>Kistler Instrument Corp.: 1959 (65 years ago)</li></ol> <h1>AE Sensor Manufacturers in United States</h1> <h1>Global Distribution of AE Sensor Manufacturers by Country</h1> <p>*Including some distributors, etc.</p> <p>CountryNumber of CompaniesShare (%)</p> <p><img src="https://miro.medium.com/v2/resize:fit:200/0*9i61K3BqKk-qxlCg.png" alt=""/></p> <p>United States of America222.2%</p> <p><img src="https://miro.medium.com/v2/resize:fit:200/0*OMNuxw29D01L0-Xj.png" alt=""/></p> <p>China111.1%</p> <p><img src="https://miro.medium.com/v2/resize:fit:200/0*86qgMVw3bcW99E4W.png" alt=""/></p> <p>United Kingdom111.1%</p> <p><img src="https://miro.medium.com/v2/resize:fit:200/0*eWuK9KDP7sWpOGFn.png" alt=""/></p> <p>Italy111.1%</p> <p><img src="https://miro.medium.com/v2/resize:fit:200/0*ppCZNgQhCVFaEBda.png" alt=""/></p> <p>Republic of Korea111.1%</p> <p><img src="https://miro.medium.com/v2/resize:fit:200/0*MKPxJGPZ0Q7xrquG.png" alt=""/></p> <p>Germany111.1%</p> <p><img src="https://miro.medium.com/v2/resize:fit:200/0*9QXOb-vqKFdBLcwC.png" alt=""/></p> <p>Canada111.1%</p> <p><img src="https://miro.medium.com/v2/resize:fit:200/0*IHxXt7FnSpE98DGk.png" alt=""/></p> <p>Switzerland111.1%</p> <p>the key players in the Acoustic Emission (AE) testing equipment market in China.<br/>Here’s a summary of the information:</p> <p>№1: <a href="https://www.aendt.com/">Qawrums Ltd.</a></p> <p>Leading manufacturer of acoustic emission testing equipment<br/>Offers a range of AE testing equipment, including sensors, amplifiers, and data acquisition systems<br/>Applications: materials testing, NDT, and structural health monitoring</p> <p>№2: China Representative of Physical Acoustics Corporation (PAC)<br/>Provides AE sensors, instruments, and software for various applications<br/>Applications: materials testing, structural health monitoring, and leak detection<br/>Note: PAC is a well-known global company in the AE testing equipment market, and this representative office in China likely provides localized support and services.</p> <p>№3: <a href="https://www.ae-ndt.com/">QingCheng Ltd.</a><br/>Provides AE testing equipment and services for various applications<br/>Applications: materials testing, structural health monitoring, and NDT</p> <p>№4: Vallen Systeme<br/>Develops and manufactures AE testing equipment, including sensors, instruments, and software, for various industries, including aerospace, automotive, and energy.</p> <p> <br/> <br/></p> </html> |
| json metadata | {"tags":["sensor"],"image":["https://miro.medium.com/v2/resize:fit:516/0*rw2-2u2eN6R_ZgRU.png","https://miro.medium.com/v2/resize:fit:400/0*mcV56NbDa9qhzdzE.png","https://miro.medium.com/v2/resize:fit:400/0*eyqkksjwXolLZIj9.png","https://miro.medium.com/v2/resize:fit:1400/0*-Ez5yz6hZ59qL3wd.png","https://miro.medium.com/v2/resize:fit:400/0*7VHnFiWSXp74Ka4O.png","https://miro.medium.com/v2/resize:fit:400/0*DpJog2KVLTemg3mE.png","https://miro.medium.com/v2/resize:fit:552/0*rK_Vy_UNR0bjDQEZ.png","https://miro.medium.com/v2/resize:fit:334/0*h-Q2fBWeQrZlN4Qe.png","https://miro.medium.com/v2/resize:fit:1200/0*ky-6BwWcJBAKiYI6.png","https://miro.medium.com/v2/resize:fit:400/0*CIA4L1c3Q2YbGqmq.png","https://miro.medium.com/v2/resize:fit:200/0*NL_e3YexTLKhz9US.png","https://miro.medium.com/v2/resize:fit:400/0*ol3QvTuL0MdEyQbh.png","https://miro.medium.com/v2/resize:fit:200/0*7VFe_m4wSHPQePGv.png","https://miro.medium.com/v2/resize:fit:400/0*8aL8u5JhXtlhhsnK.png","https://miro.medium.com/v2/resize:fit:200/0*-isxncq0nqDy3YFZ.png","https://miro.medium.com/v2/resize:fit:400/0*-x3sjaqMqL2x6Pp5.png","https://miro.medium.com/v2/resize:fit:200/0*iZOmSWjRdRxmWRQ4.png","https://miro.medium.com/v2/resize:fit:334/0*mL87OLPk2AaMesVM.png","https://miro.medium.com/v2/resize:fit:200/0*e-AIsbumGO2cDMSG.png","https://miro.medium.com/v2/resize:fit:516/0*mkYhcimlszYCbQEL.png","https://miro.medium.com/v2/resize:fit:1200/0*KEpvnCCMbf6vwFKu.png","https://miro.medium.com/v2/resize:fit:400/0*CkJQJ4iDwFVlvFnX.png","https://miro.medium.com/v2/resize:fit:200/0*dzzUtfe5yb6PUpe0.png","https://miro.medium.com/v2/resize:fit:400/0*1rW9VplRIV25atXF.png","https://miro.medium.com/v2/resize:fit:200/0*Dec7PJwVcSTkZfVP.png","https://miro.medium.com/v2/resize:fit:400/0*OjXGMapRuRYQGkzz.png","https://miro.medium.com/v2/resize:fit:200/0*kKTNIauz0kb8ad3Z.png","https://miro.medium.com/v2/resize:fit:552/0*YlID0BmG27lZBE_8.png","https://miro.medium.com/v2/resize:fit:200/0*5tEAReH6kWO_YU5f.png","https://miro.medium.com/v2/resize:fit:1400/0*hNcfcmFpEjFOnmni.png","https://miro.medium.com/v2/resize:fit:1400/0*mzapbR_YJZ9vcPz4.png","https://miro.medium.com/v2/resize:fit:400/0*0VPn-JW3T8vtJeQZ.png","https://miro.medium.com/v2/resize:fit:200/0*9i61K3BqKk-qxlCg.png","https://miro.medium.com/v2/resize:fit:200/0*OMNuxw29D01L0-Xj.png","https://miro.medium.com/v2/resize:fit:200/0*86qgMVw3bcW99E4W.png","https://miro.medium.com/v2/resize:fit:200/0*eWuK9KDP7sWpOGFn.png","https://miro.medium.com/v2/resize:fit:200/0*ppCZNgQhCVFaEBda.png","https://miro.medium.com/v2/resize:fit:200/0*MKPxJGPZ0Q7xrquG.png","https://miro.medium.com/v2/resize:fit:200/0*9QXOb-vqKFdBLcwC.png","https://miro.medium.com/v2/resize:fit:200/0*IHxXt7FnSpE98DGk.png"],"links":["https://us.metoree.com/categories/2129/#manufacturers","https://us.metoree.com/categories/2129/#rankings","https://us.metoree.com/categories/2129/#h2-title-0","https://us.metoree.com/categories/2129/#global-distribution","https://us.metoree.com/categories/2051","https://us.metoree.com/categories/7181","https://us.metoree.com/categories/5241","https://us.metoree.com/categories/6058/","https://us.metoree.com/categories/6381","https://us.metoree.com/categories/accelerometer","https://us.metoree.com/categories/5313","https://us.metoree.com/categories/2427/","https://www.guzik.com/product/miniature-ae/","https://www.guzik.com/","https://us.metoree.com/companies/160120/","https://www.physicalacoustics.com/sensors/","https://www.mistrasgroup.com/","https://us.metoree.com/companies/141565/","https://www.aendt.com/","https://us.metoree.com/companies/145808/","https://www.accretech.eu/en/process-control/in-spindle-ae-sensors/","https://www.accretech.eu/en/","https://us.metoree.com/companies/101351/","https://www.marposs.com/eng/product/acoustic-emission-sensors#:~:text=Artis%20AE%20sensors%20(Acoustic%20Emission,elements%20involved%20in%20the%20process.","https://www.marposs.com/eng/","https://us.metoree.com/companies/15377/","https://www.toseieng.co.jp/component/en/component02/pulcom-ge-10.html","http://www.toseieng.co.jp/global/acctusawebsite/usaindex.html","https://us.metoree.com/companies/8970/","https://www.kistler.com/INT/en/cp/acoustic-emission-ae-measuring-chains-ae-sensor-plus-ae-coupler-both-selectable-8852a/P0001210","https://www.kistler.com/en/","https://us.metoree.com/companies/391/","http://rectuson.com/en/product/02_rt_ae300.jsp","http://rectuson.com/en/index/index.jsp","https://us.metoree.com/companies/207065/","https://www.mpmgmbh.de/en/products/ae-acoustic-emission-systems/ae-sensor-technology.html","https://www.mpmgmbh.de/en/index.html","https://us.metoree.com/companies/206240/","https://www.benthowave.com/products/BII-7230AE.html","https://www.benthowave.com/index.html","https://us.metoree.com/companies/206234/","https://www.mdpi.com/2076-3417/10/24/8966","https://www.mdpi.com/journal/metals","https://us.metoree.com/companies/191032/","https://opg.optica.org/abstract.cfm?uri=ol-34-12-1858","https://opg.optica.org/","https://us.metoree.com/companies/192821/","https://aip.scitation.org/doi/pdf/10.1063/1.5084509","https://aip.scitation.org/journal/jcp","https://us.metoree.com/companies/192774/","https://www.mistrasgroup.com/united-kingdom/how-we-help/equipment/ae/","https://www.mistrasgroup.com/services/","https://us.metoree.com/companies/165206/","https://us.metoree.com/categories/2129/#how-to-create-ranking","https://www.ae-ndt.com/"],"app":"steemit/0.2","format":"html"} |
| parent author | |
| parent permlink | sensor |
| permlink | 67kywd-14-ae-sensor-manufacturers-in-2024 |
| title | 14 AE Sensor Manufacturers in 2024 |
| Transaction Info | Block #89897638/Trx c21d76f9d2ad5aa2de351bf4c45ce945dc98071f |
View Raw JSON Data
{
"block": 89897638,
"op": [
"comment",
{
"author": "barrylee",
"body": "<html>\n<p>\r<br/>\r<br/><img src=\"https://miro.medium.com/v2/resize:fit:516/0*rw2-2u2eN6R_ZgRU.png\" alt=\"\"/><img src=\"https://miro.medium.com/v2/resize:fit:400/0*mcV56NbDa9qhzdzE.png\" alt=\"\"/><img src=\"https://miro.medium.com/v2/resize:fit:400/0*eyqkksjwXolLZIj9.png\" alt=\"\"/>Qawrums Ltd.<img src=\"https://miro.medium.com/v2/resize:fit:1400/0*-Ez5yz6hZ59qL3wd.png\" alt=\"\"/><img src=\"https://miro.medium.com/v2/resize:fit:400/0*7VHnFiWSXp74Ka4O.png\" alt=\"\"/><img src=\"https://miro.medium.com/v2/resize:fit:400/0*DpJog2KVLTemg3mE.png\" alt=\"\"/><img src=\"https://miro.medium.com/v2/resize:fit:552/0*rK_Vy_UNR0bjDQEZ.png\" alt=\"\"/><img src=\"https://miro.medium.com/v2/resize:fit:334/0*h-Q2fBWeQrZlN4Qe.png\" alt=\"\"/><img src=\"https://miro.medium.com/v2/resize:fit:1200/0*ky-6BwWcJBAKiYI6.png\" alt=\"\"/></p>\n<h1>14 AE Sensor Manufacturers in 2024</h1>\n<p>This section provides an overview for ae sensors as well as their applications and principles. Also, please take a look at <a href=\"https://us.metoree.com/categories/2129/#manufacturers\">the list of 14 ae sensor manufacturers </a>and <a href=\"https://us.metoree.com/categories/2129/#rankings\">their company rankings</a>. Here are the top-ranked ae sensor companies as of October, 2024: 1.Guzik, 2.Qing Cheng, 3.ACCRETECH.</p>\n<p>Table of Contents</p>\n<ul><li><a href=\"https://us.metoree.com/categories/2129/#h2-title-0\">What Is an AE Sensor?</a></li><li><a href=\"https://us.metoree.com/categories/2129/#manufacturers\">List of 14 AE Sensor Manufacturers</a></li><li><a href=\"https://us.metoree.com/categories/2129/#global-distribution\">Global Distribution of AE Sensor Manufacturers by Country</a></li></ul>\n<h1>What Is an AE Sensor?</h1>\n<p>An AE Sensor is a type of <a href=\"https://us.metoree.com/categories/2051\">vibration sensor</a> that detects a specific vibration (AE wave).</p>\n<p>AE stands for Acoustic Emission, a phenomenon in which acoustic waves are emitted as elastic waves when a part of an object is deformed or damaged, or when a shock is applied.</p>\n<p>AE Sensors are used to detect this phenomenon, which is caused by minute degradation that occurs long before the object is completely damaged.</p>\n<p>AE Sensors are used for <a href=\"https://us.metoree.com/categories/7181\">predictive maintenance</a> of industrial facilities and quality control of products.</p>\n<h1>Applications of AE Sensor</h1>\n<p>AE Sensors are used in a variety of applications, including product quality control and <a href=\"https://us.metoree.com/categories/5241\">safety control</a>. There are two types of AE sensors: a narrow-band type that reacts strongly in a specific narrow frequency band and a wide-band type that reacts in a wide frequency band, which can be used for different purposes.</p>\n<h2>1. Narrow-Band Type AE Sensor</h2>\n<p>Narrow-band AE Sensors are used in applications such as predictive maintenance of motor deterioration and detection of defects in metal welding such as pipes. Narrow-band AE Sensors do not react to vibrations from normally operating motors or welding, but can detect AE waves that are generated only when an abnormality occurs.</p>\n<h2>2. Wide-Band AE Sensor</h2>\n<p>The wide-band AE Sensor is used to detect foreign objects inside products and to detect signs of landslides in the ground. By using the broadband AE Sensor, it is possible to detect minute fragments of solder falling from a unit board inside a product or minute vibrations that may be a <a href=\"https://us.metoree.com/categories/6058/\">precursor</a> to a landslide in the ground.</p>\n<h1>Principle of AE Sensor</h1>\n<p>AE Sensor detects AE waves by using a special piezoelectric element. Materials commonly used as piezoelectric elements are <a href=\"https://us.metoree.com/categories/6381\">lithium niobate</a>, lead niobate, and lead zirconate titanate (PZT). These elements are characterized by the fact that an electric charge is generated when pressure is applied. Therefore, by bringing these piezoelectric elements into contact with a vibrating object, they can receive a voltage from the piezoelectric element and function as a sensor.</p>\n<p>In addition, these piezoelectric elements output a strong voltage when subjected to pressure from vibrations in the ultra-high frequency range (10 kHz to several MHz), such as AE waves, making it possible to detect only vibrations in a specific frequency band.</p>\n<h1>Other Information on AE Sensor</h1>\n<h2>1. Difference Between AE Sensor and Vibration Sensor</h2>\n<p>Both sensors use piezoelectric elements to convert mechanical vibration into electricity. However, they differ in the frequency range for which they are suitable. Vibration <a href=\"https://us.metoree.com/categories/accelerometer\">acceleration sensors</a> are suitable for detection in a relatively low frequency range, such as 5 to 20 kHz.</p>\n<p>AE Sensors, on the other hand, detect higher frequency vibrations than <a href=\"https://us.metoree.com/categories/2051\">vibration sensors</a>. By detecting higher frequencies, early defects can be detected at an early stage.</p>\n<p>In some cases, AE sensors have been applied to low-speed rotating <a href=\"https://us.metoree.com/categories/5313\">bearings</a>, which are difficult to diagnose with vibration sensors. This is because AE Sensor captures acoustic emissions, which are energy waves generated by micro-level breakdown.</p>\n<p>Acoustic emissions are like ripples on the surface of water. When metal-to-metal contact occurs, acoustic emissions propagate through the metal of the equipment surface and are detected by the AE Sensor. Since acoustic emissions are generated even from small scratches and friction, it is possible to detect problems at an early stage.</p>\n<h2>2. Installation of AE Sensor</h2>\n<p>When installing AE Sensor, the mounting position is important. If the AE sensor can be mounted directly on the object to be detected, it has the best detection sensitivity and is not a problem.</p>\n<p>On the other hand, if it is not possible to mount the AE sensor directly on the target, it is important to mount it as close as possible to the target. An acoustic path must be formed between the target and the AE Sensor, and when installing the AE Sensor, silicone <a href=\"https://us.metoree.com/categories/2427/\">grease</a> or similar material should be applied to the surface of the target to make it adhere to the AE Sensor, so that the acoustic emissions generated by the AE Sensor can be detected.</p>\n<p>Acoustic emissions have a high frequency and are difficult to propagate in air. Therefore, when mounting the AE Sensor, it is important to adhere it closely to the object to be detected. Furthermore, it is also important to install the sensor after thorough verification using a prototype.</p>\n<h1>List of 14 AE Sensor Manufacturers</h1>\n<p>*Including some distributors, etc.</p>\n<p>Sort by Features</p>\n<ul><li>Default</li><li>Company Size: largest first</li><li>Year Founded: oldest first</li><li>Year Founded: earliest first</li></ul>\n<p>Sort by Area</p>\n<ul><li>United States of America</li><li>Canada</li><li>China</li><li>Germany</li><li>Italy</li><li>Republic of Korea</li><li>Switzerland</li><li>United Kingdom</li></ul>\n<p><img src=\"https://miro.medium.com/v2/resize:fit:400/0*CIA4L1c3Q2YbGqmq.png\" alt=\"\"/></p>\n<ul><li><strong>Guzik</strong></li><li><strong>Manufacturer</strong></li><li><a href=\"https://www.guzik.com/product/miniature-ae/\"><strong>Miniature AE Sensor with Isolated Integral 30 d</strong></a></li><li><a href=\"https://www.guzik.com/\">Website</a></li><li>United States, California</li><li><a href=\"https://us.metoree.com/companies/160120/\">Company Profile</a></li></ul>\n<p><img src=\"https://miro.medium.com/v2/resize:fit:200/0*NL_e3YexTLKhz9US.png\" alt=\"\"/></p>\n<ul><li>Address: 443 Wyandotte Street, Mountain View, California, United States of America</li><li>Manufacturer Overview</li><li>Guzik Technical Enterprises, established in 1982, is a manufacturer of test and measurement equipment located in the USA. The company’s product portfolio includes digitizers featuring 10-bit Keysight Analog to Digital A/D converters with sampling rates up to 32 Gsps and analog bandwidth up to 10 GHz1. These digitizers are combined with a digital processor, offering real-time processing and streaming Optical Data Interfaces (ODI). It provides advanced solutions to various sectors including medical imaging, aerospace and defense, satellite, Pulse RADAR test, and system integration. Its products are designed to enhance the success rate of projects and improve efficiency.</li></ul>\n<p><img src=\"https://miro.medium.com/v2/resize:fit:400/0*ol3QvTuL0MdEyQbh.png\" alt=\"\"/></p>\n<ul><li><strong>MISTRAS Group, Inc.</strong></li><li><strong>Manufacturer</strong></li><li><a href=\"https://www.physicalacoustics.com/sensors/\"><strong>AE sensors</strong></a></li><li><a href=\"https://www.mistrasgroup.com/\">Website</a></li><li>United States, New Jersey</li><li><a href=\"https://us.metoree.com/companies/141565/\">Company Profile</a></li></ul>\n<p><img src=\"https://miro.medium.com/v2/resize:fit:200/0*7VFe_m4wSHPQePGv.png\" alt=\"\"/></p>\n<ul><li>Address: 195 Clarksville Rd, Princeton Jct, New Jersey, United States of America</li><li>Manufacturer Overview</li><li>MISTRAS Group, established in 1978, is a manufacturer and global supplier headquartered in Princeton, New Jersey, specializing in non-destructive testing (NDT) equipment and asset protection solutions. The company’s product portfolio includes NDT technologies such as advanced acoustic emission (AE) and ultrasonic testing (UT) equipment. It also offers field inspections, lab testing, maintenance, monitoring, and data management services. These offerings serve diverse sectors such as academia, aerospace, defense, infrastructure, and manufacturing. The company adheres to ISO 9001:2015 quality standards with locations worldwide, serving clients across North America, Europe, Asia, and beyond.</li></ul>\n<p><img src=\"https://miro.medium.com/v2/resize:fit:400/0*8aL8u5JhXtlhhsnK.png\" alt=\"\"/></p>\n<ul><li><strong>Qing Cheng (</strong>The current name is <a href=\"https://www.aendt.com/\">Qawrums Ltd.</a>)</li><li><strong>Manufacturer</strong></li><li><a href=\"https://www.aendt.com/\"><strong>Acoustic Emission</strong></a></li><li><a href=\"https://www.aendt.com/\">Website</a></li><li>China</li><li><a href=\"https://us.metoree.com/companies/145808/\">Company Profile</a></li></ul>\n<p><img src=\"https://miro.medium.com/v2/resize:fit:200/0*-isxncq0nqDy3YFZ.png\" alt=\"\"/></p>\n<ul><li>Address: 601–9,Building 3, 232 Ke Zhu Road, Huang Pu District, Guang Zhou City, Guang Dong, China</li><li>Manufacturer Overview</li><li>QingCheng Ltd, an ISO 9001:2015 certified manufacturer, specializes in non-destructive testing (NDT) systems and condition monitoring solutions. Known for its IIoT acoustic emission online monitoring systems and NDT products, the company offers online condition monitoring solutions for industrial assets. The company’s offerings include acoustic emission (AE) systems, such as AE sensors, pre-amplifiers, and AE acquisition instruments. The company also provides handheld ultrasonic devices, ultrasonic thickness detectors, and flaw detectors. QingCheng offers professional analysis software and an IoT Cloud platform, serving both laboratory and industrial needs worldwide.</li><li>Qawrums Ltd. is a leading manufacturer of acoustic emission testing equipment in China.<br/>It offers a range of AE testing equipment, including sensors, amplifiers, and data acquisition systems<br/>Applications: materials testing, NDT, and structural health monitoring</li></ul>\n<p><img src=\"https://miro.medium.com/v2/resize:fit:400/0*-x3sjaqMqL2x6Pp5.png\" alt=\"\"/></p>\n<ul><li><strong>ACCRETECH</strong></li><li><strong>Manufacturer</strong></li><li><a href=\"https://www.accretech.eu/en/process-control/in-spindle-ae-sensors/\"><strong>In-Spindle AE Sensors</strong></a></li><li><a href=\"https://www.accretech.eu/en/\">Website</a></li><li>United Kingdom</li><li><a href=\"https://us.metoree.com/companies/101351/\">Company Profile</a></li></ul>\n<p><img src=\"https://miro.medium.com/v2/resize:fit:200/0*iZOmSWjRdRxmWRQ4.png\" alt=\"\"/></p>\n<ul><li>Address: Unit2, Leofric Court Progress Way, Coventry, United Kingdom</li><li>Manufacturer Overview</li><li>ACCRETECH, formerly known as Tokyo Seimitsu Kogu Co., Ltd., is a Japanese manufacturer of precision machining and metrology solutions since 1949. Based in Hachioji-shi, Tokyo, the company produces various wafer metrology systems for measuring the physical properties of semiconductor wafers, metrology systems for assessing the surface quality of different surfaces, as well as precision machining tools including polishing and optical grinding machines. These product serve clients in automotive, semiconductor and medical device manufacturing.</li></ul>\n<p><img src=\"https://miro.medium.com/v2/resize:fit:334/0*mL87OLPk2AaMesVM.png\" alt=\"\"/></p>\n<ul><li><strong>Marposs</strong></li><li><strong>Manufacturer</strong></li><li><a href=\"https://www.marposs.com/eng/product/acoustic-emission-sensors#:~:text=Artis%20AE%20sensors%20(Acoustic%20Emission,elements%20involved%20in%20the%20process.\"><strong>Artis AE sensors</strong></a></li><li><a href=\"https://www.marposs.com/eng/\">Website</a></li><li>Founded: 1952</li><li>Italy</li><li><a href=\"https://us.metoree.com/companies/15377/\">Company Profile</a></li></ul>\n<p><img src=\"https://miro.medium.com/v2/resize:fit:200/0*e-AIsbumGO2cDMSG.png\" alt=\"\"/></p>\n<ul><li>Address: Via Saliceto 13 , Bentivoglio, Italy</li><li>Manufacturer Overview</li><li>Marposs S.p.A. is headquartered in Bentivoglio, Italy. The company serves industries such asa aerospace, semiconductors, machine tooling, and biomedical as a manufacturer and as a service provider. The company’s products vary by industry but include tools for gauging, profiling, and monitoring, as well as data management systems and machines for testing and automation. The company’s services include after sales service, customer training, original spare parts, retrofit and upgrade of existing machinery, and project management consulting services.</li></ul>\n<p><img src=\"https://miro.medium.com/v2/resize:fit:516/0*mkYhcimlszYCbQEL.png\" alt=\"\"/></p>\n<ul><li><strong>Tosei America Inc</strong></li><li><strong>Manufacturer</strong></li><li><a href=\"https://www.toseieng.co.jp/component/en/component02/pulcom-ge-10.html\"><strong>PULCOM GE-10</strong></a></li><li><a href=\"http://www.toseieng.co.jp/global/acctusawebsite/usaindex.html\">Website</a></li><li><a href=\"https://us.metoree.com/companies/8970/\">Company Profile</a></li><li>Manufacturer Overview</li><li>Tosei America Inc., founded in 2009 and located in Cincinnati, Ohio, is a manufacturer of automatic measuring equipment for production lines of precision automotive parts, bearings, and electronic products. The company provides a range of products, including gages, micrometers, digital measuring instruments, laser interferometers, and automatic measuring systems. Their products cater to diverse industries such as automotive, bearings, and the electronics industry. These products are used to ensure adherence to industry standards, detect defects or variations, and verify the reliability and precision of the produced components.</li></ul>\n<p><img src=\"https://miro.medium.com/v2/resize:fit:1200/0*KEpvnCCMbf6vwFKu.png\" alt=\"\"/></p>\n<ul><li><strong>Kistler Instrument Corp.</strong></li><li><strong>Manufacturer</strong></li><li><a href=\"https://www.kistler.com/INT/en/cp/acoustic-emission-ae-measuring-chains-ae-sensor-plus-ae-coupler-both-selectable-8852a/P0001210\"><strong>Acoustic emission AE measuring chains</strong></a></li><li><a href=\"https://www.kistler.com/en/\">Website</a></li><li>Founded: 1959</li><li><a href=\"https://us.metoree.com/companies/391/\">Company Profile</a></li><li>Manufacturer Overview</li><li>Founded in Switzerland, Kistler serves both public and private customers in the automotive, aerospace, maritime, transportation, medical, semiconductor, energy and life sciences industries. Products include sensors as well as connectivity, signal, and data acquisition devices as well as software solutions. Applications of these solutions include R&D to safety testing, and condition monitoring. Key technologies include dynamic pressure, force, torque and acceleration measurement technologies.</li></ul>\n<p><img src=\"https://miro.medium.com/v2/resize:fit:400/0*CkJQJ4iDwFVlvFnX.png\" alt=\"\"/></p>\n<ul><li><strong>RECTUSON CO., LTD.</strong><br/><a href=\"http://rectuson.com/en/product/02_rt_ae300.jsp\"><strong>Acoustic Emission System</strong></a></li><li><a href=\"http://rectuson.com/en/index/index.jsp\">Website</a></li><li>Republic of Korea</li><li><a href=\"https://us.metoree.com/companies/207065/\">Company Profile</a></li></ul>\n<p><img src=\"https://miro.medium.com/v2/resize:fit:200/0*dzzUtfe5yb6PUpe0.png\" alt=\"\"/></p>\n<ul><li>Address: 51756 Gaposinhangnam-ro 12–1, Masanhappo-gu, Changwon-si, Gyeongsangnam-do, Republic of Korea</li></ul>\n<p><img src=\"https://miro.medium.com/v2/resize:fit:400/0*1rW9VplRIV25atXF.png\" alt=\"\"/></p>\n<ul><li><strong>MPM Micro Praezision Marx GmbH & Co. KG</strong><br/><a href=\"https://www.mpmgmbh.de/en/products/ae-acoustic-emission-systems/ae-sensor-technology.html\"><strong>AE sensor technology</strong></a></li><li><a href=\"https://www.mpmgmbh.de/en/index.html\">Website</a></li><li>Germany</li><li><a href=\"https://us.metoree.com/companies/206240/\">Company Profile</a></li></ul>\n<p><img src=\"https://miro.medium.com/v2/resize:fit:200/0*Dec7PJwVcSTkZfVP.png\" alt=\"\"/></p>\n<ul><li>Address: Neuenweiherstrasse 19 Erlangen, Freistaat Bayern, Germany</li></ul>\n<p><img src=\"https://miro.medium.com/v2/resize:fit:400/0*OjXGMapRuRYQGkzz.png\" alt=\"\"/></p>\n<ul><li><strong>Benthowave Instrument Inc.</strong><br/><a href=\"https://www.benthowave.com/products/BII-7230AE.html\"><strong>AE Sensor</strong></a></li><li><a href=\"https://www.benthowave.com/index.html\">Website</a></li><li>Canada</li><li><a href=\"https://us.metoree.com/companies/206234/\">Company Profile</a></li></ul>\n<p><img src=\"https://miro.medium.com/v2/resize:fit:200/0*kKTNIauz0kb8ad3Z.png\" alt=\"\"/></p>\n<ul><li>Address: 89 Kells Crescent,Collingwood, Ontario, Canada</li></ul>\n<p><img src=\"https://miro.medium.com/v2/resize:fit:552/0*YlID0BmG27lZBE_8.png\" alt=\"\"/></p>\n<ul><li><strong>MDPI</strong><br/><a href=\"https://www.mdpi.com/2076-3417/10/24/8966\"><strong>MEMS Acoustic Emission Sensors</strong></a></li><li><a href=\"https://www.mdpi.com/journal/metals\">Website</a></li><li>Switzerland</li><li><a href=\"https://us.metoree.com/companies/191032/\">Company Profile</a></li></ul>\n<p><img src=\"https://miro.medium.com/v2/resize:fit:200/0*5tEAReH6kWO_YU5f.png\" alt=\"\"/></p>\n<ul><li>Address: St. Alban-Anlage 66 4052 Base, Switzerland</li><li>Company Overview</li><li>MDPI was founded in 1996 and is based in Basel, Switzerland. The company is a pioneer in scholarly, open-access publishing, featuring 417 peer-reviewed journals and 9 conference journals with over 115,000 academic contributors. The company’s journals fall into 10 subjects including biology, economics, medicine, physical sciences, and public health. The company’s pear review system is a dingle-blind assessment with at least two independent reviewers, followed by a final decision of acceptance or rejection by the editor-in-chief. Authors may appeal editorial decisions in case of rejection of articles.</li></ul>\n<p><img src=\"https://miro.medium.com/v2/resize:fit:1400/0*hNcfcmFpEjFOnmni.png\" alt=\"\"/></p>\n<ul><li><strong>Optica Publishing Group</strong><br/><a href=\"https://opg.optica.org/abstract.cfm?uri=ol-34-12-1858\"><strong>acoustic emission sensor</strong></a></li><li><a href=\"https://opg.optica.org/\">Website</a></li><li><a href=\"https://us.metoree.com/companies/192821/\">Company Profile</a></li></ul>\n<p><img src=\"https://miro.medium.com/v2/resize:fit:1400/0*mzapbR_YJZ9vcPz4.png\" alt=\"\"/></p>\n<ul><li><strong>AIP Publishing LLC.</strong></li><li><strong>Distributor</strong></li><li><a href=\"https://aip.scitation.org/doi/pdf/10.1063/1.5084509\"><strong>acoustic emission sensors</strong></a></li><li><a href=\"https://aip.scitation.org/journal/jcp\">Website</a></li><li><a href=\"https://us.metoree.com/companies/192774/\">Company Profile</a></li><li>Distributor Overview</li><li>AIP Publishing LLC., founded in Melville, NY, in 2013 is a supplier of online research journals, conference proceedings, and essential information for physical scientists. The company’s product portfolio includes e-books, product guides, sector news and peer-reviewed research journals covering a wide spectrum of subjects about science, technology, medicine, and social sciences. They serve industries such as Healthcare and Medicine, Industry and Innovation, Academia, and Social Sciences. wholly owned not-for-profit subsidiary of the American Institute of Physics (AIP).</li></ul>\n<p><img src=\"https://miro.medium.com/v2/resize:fit:400/0*0VPn-JW3T8vtJeQZ.png\" alt=\"\"/></p>\n<ul><li><strong>MISTRAS Services</strong></li><li><strong>Distributor</strong></li><li><a href=\"https://www.mistrasgroup.com/united-kingdom/how-we-help/equipment/ae/\"><strong>ACOUSTIC EMISSION (AE) INSPECTION AND MONITORING PRODUCTS, SYSTEMS, AND SENSORS</strong></a></li><li><a href=\"https://www.mistrasgroup.com/services/\">Website</a></li><li>Number of Employees: 5,400</li><li><a href=\"https://us.metoree.com/companies/165206/\">Company Profile</a></li><li>Distributor Overview</li><li>Mistras Services, founded in 1978 and headquartered in New Jersey, is a global technology services supplier specializing in integrated technology-enabled asset protection solutions. The company’s portfolio of services includes field inspections, lab testing, maintenance services, monitoring and data management. These services help in enhancing safety and operational effeciency in sectors such as oil and gas, aerospace, defense, civil infrastructure, and manufacturing. With 120 locations worldwide, Mistras adheres to an internationally-recognized ISO-9001 Quality Management System, serving clients across North America, Europe, Asia and beyond.</li></ul>\n<h1>AE Sensor Manufacturer Ranking</h1>\n<p>*Including some distributors, etc.</p>\n<p>Ranking as of October 2024</p>\n<p><a href=\"https://us.metoree.com/categories/2129/#how-to-create-ranking\">Derivation Method</a></p>\n<p>RankCompanyClick Share<strong>1</strong><a href=\"https://www.guzik.com/\">Guzik</a></p>\n<p>12.9%</p>\n<p><a href=\"https://www.aendt.com/\">2 Qing Cheng</a></p>\n<p>11.8%</p>\n<p><a href=\"https://www.accretech.eu/en/\"><strong>3</strong>ACCRETECH</a></p>\n<p>9.9%</p>\n<p><a href=\"https://www.mdpi.com/journal/metals\"><strong>4</strong>MDPI</a></p>\n<p>8.4%</p>\n<p><a href=\"https://opg.optica.org/\"><strong>5</strong>Optica Publishing Group</a></p>\n<p>7.6%</p>\n<p><a href=\"https://www.mistrasgroup.com/\"><strong>6</strong>MISTRAS Group, Inc.</a></p>\n<p>6.8%</p>\n<p><a href=\"https://www.mpmgmbh.de/en/index.html\"><strong>7</strong>MPM Micro Praezision Marx GmbH & Co. KG</a></p>\n<p>6.5%</p>\n<p><a href=\"https://www.marposs.com/eng/\"><strong>8</strong>Marposs</a></p>\n<p>6.5%</p>\n<p><a href=\"https://www.kistler.com/en/\"><strong>9</strong>Kistler Instrument Corp.</a></p>\n<p>6.1%</p>\n<p><strong>10</strong><a href=\"https://www.benthowave.com/index.html\">Benthowave Instrument Inc.</a></p>\n<p>5.7%</p>\n<p>Derivation Method</p>\n<p>The ranking is calculated based on the click share within the ae sensor page as of October 2024. Click share is defined as the total number of clicks for all companies during the period divided by the number of clicks for each company.</p>\n<p>Number of Employees</p>\n<ol><li>MISTRAS Services: 5,400</li></ol>\n<p>Newly Established Company</p>\n<ol><li>Kistler Instrument Corp.: 1959 (65 years ago)</li><li>Marposs: 1952 (72 years ago)</li></ol>\n<p>Company with a History</p>\n<ol><li>Marposs: 1952 (72 years ago)</li><li>Kistler Instrument Corp.: 1959 (65 years ago)</li></ol>\n<h1>AE Sensor Manufacturers in United States</h1>\n<h1>Global Distribution of AE Sensor Manufacturers by Country</h1>\n<p>*Including some distributors, etc.</p>\n<p>CountryNumber of CompaniesShare (%)</p>\n<p><img src=\"https://miro.medium.com/v2/resize:fit:200/0*9i61K3BqKk-qxlCg.png\" alt=\"\"/></p>\n<p>United States of America222.2%</p>\n<p><img src=\"https://miro.medium.com/v2/resize:fit:200/0*OMNuxw29D01L0-Xj.png\" alt=\"\"/></p>\n<p>China111.1%</p>\n<p><img src=\"https://miro.medium.com/v2/resize:fit:200/0*86qgMVw3bcW99E4W.png\" alt=\"\"/></p>\n<p>United Kingdom111.1%</p>\n<p><img src=\"https://miro.medium.com/v2/resize:fit:200/0*eWuK9KDP7sWpOGFn.png\" alt=\"\"/></p>\n<p>Italy111.1%</p>\n<p><img src=\"https://miro.medium.com/v2/resize:fit:200/0*ppCZNgQhCVFaEBda.png\" alt=\"\"/></p>\n<p>Republic of Korea111.1%</p>\n<p><img src=\"https://miro.medium.com/v2/resize:fit:200/0*MKPxJGPZ0Q7xrquG.png\" alt=\"\"/></p>\n<p>Germany111.1%</p>\n<p><img src=\"https://miro.medium.com/v2/resize:fit:200/0*9QXOb-vqKFdBLcwC.png\" alt=\"\"/></p>\n<p>Canada111.1%</p>\n<p><img src=\"https://miro.medium.com/v2/resize:fit:200/0*IHxXt7FnSpE98DGk.png\" alt=\"\"/></p>\n<p>Switzerland111.1%</p>\n<p>the key players in the Acoustic Emission (AE) testing equipment market in China.<br/>Here’s a summary of the information:</p>\n<p>№1: <a href=\"https://www.aendt.com/\">Qawrums Ltd.</a></p>\n<p>Leading manufacturer of acoustic emission testing equipment<br/>Offers a range of AE testing equipment, including sensors, amplifiers, and data acquisition systems<br/>Applications: materials testing, NDT, and structural health monitoring</p>\n<p>№2: China Representative of Physical Acoustics Corporation (PAC)<br/>Provides AE sensors, instruments, and software for various applications<br/>Applications: materials testing, structural health monitoring, and leak detection<br/>Note: PAC is a well-known global company in the AE testing equipment market, and this representative office in China likely provides localized support and services.</p>\n<p>№3: <a href=\"https://www.ae-ndt.com/\">QingCheng Ltd.</a><br/>Provides AE testing equipment and services for various applications<br/>Applications: materials testing, structural health monitoring, and NDT</p>\n<p>№4: Vallen Systeme<br/>Develops and manufactures AE testing equipment, including sensors, instruments, and software, for various industries, including aerospace, automotive, and energy.</p>\n<p>\r<br/>\r<br/></p>\n</html>",
"json_metadata": "{\"tags\":[\"sensor\"],\"image\":[\"https://miro.medium.com/v2/resize:fit:516/0*rw2-2u2eN6R_ZgRU.png\",\"https://miro.medium.com/v2/resize:fit:400/0*mcV56NbDa9qhzdzE.png\",\"https://miro.medium.com/v2/resize:fit:400/0*eyqkksjwXolLZIj9.png\",\"https://miro.medium.com/v2/resize:fit:1400/0*-Ez5yz6hZ59qL3wd.png\",\"https://miro.medium.com/v2/resize:fit:400/0*7VHnFiWSXp74Ka4O.png\",\"https://miro.medium.com/v2/resize:fit:400/0*DpJog2KVLTemg3mE.png\",\"https://miro.medium.com/v2/resize:fit:552/0*rK_Vy_UNR0bjDQEZ.png\",\"https://miro.medium.com/v2/resize:fit:334/0*h-Q2fBWeQrZlN4Qe.png\",\"https://miro.medium.com/v2/resize:fit:1200/0*ky-6BwWcJBAKiYI6.png\",\"https://miro.medium.com/v2/resize:fit:400/0*CIA4L1c3Q2YbGqmq.png\",\"https://miro.medium.com/v2/resize:fit:200/0*NL_e3YexTLKhz9US.png\",\"https://miro.medium.com/v2/resize:fit:400/0*ol3QvTuL0MdEyQbh.png\",\"https://miro.medium.com/v2/resize:fit:200/0*7VFe_m4wSHPQePGv.png\",\"https://miro.medium.com/v2/resize:fit:400/0*8aL8u5JhXtlhhsnK.png\",\"https://miro.medium.com/v2/resize:fit:200/0*-isxncq0nqDy3YFZ.png\",\"https://miro.medium.com/v2/resize:fit:400/0*-x3sjaqMqL2x6Pp5.png\",\"https://miro.medium.com/v2/resize:fit:200/0*iZOmSWjRdRxmWRQ4.png\",\"https://miro.medium.com/v2/resize:fit:334/0*mL87OLPk2AaMesVM.png\",\"https://miro.medium.com/v2/resize:fit:200/0*e-AIsbumGO2cDMSG.png\",\"https://miro.medium.com/v2/resize:fit:516/0*mkYhcimlszYCbQEL.png\",\"https://miro.medium.com/v2/resize:fit:1200/0*KEpvnCCMbf6vwFKu.png\",\"https://miro.medium.com/v2/resize:fit:400/0*CkJQJ4iDwFVlvFnX.png\",\"https://miro.medium.com/v2/resize:fit:200/0*dzzUtfe5yb6PUpe0.png\",\"https://miro.medium.com/v2/resize:fit:400/0*1rW9VplRIV25atXF.png\",\"https://miro.medium.com/v2/resize:fit:200/0*Dec7PJwVcSTkZfVP.png\",\"https://miro.medium.com/v2/resize:fit:400/0*OjXGMapRuRYQGkzz.png\",\"https://miro.medium.com/v2/resize:fit:200/0*kKTNIauz0kb8ad3Z.png\",\"https://miro.medium.com/v2/resize:fit:552/0*YlID0BmG27lZBE_8.png\",\"https://miro.medium.com/v2/resize:fit:200/0*5tEAReH6kWO_YU5f.png\",\"https://miro.medium.com/v2/resize:fit:1400/0*hNcfcmFpEjFOnmni.png\",\"https://miro.medium.com/v2/resize:fit:1400/0*mzapbR_YJZ9vcPz4.png\",\"https://miro.medium.com/v2/resize:fit:400/0*0VPn-JW3T8vtJeQZ.png\",\"https://miro.medium.com/v2/resize:fit:200/0*9i61K3BqKk-qxlCg.png\",\"https://miro.medium.com/v2/resize:fit:200/0*OMNuxw29D01L0-Xj.png\",\"https://miro.medium.com/v2/resize:fit:200/0*86qgMVw3bcW99E4W.png\",\"https://miro.medium.com/v2/resize:fit:200/0*eWuK9KDP7sWpOGFn.png\",\"https://miro.medium.com/v2/resize:fit:200/0*ppCZNgQhCVFaEBda.png\",\"https://miro.medium.com/v2/resize:fit:200/0*MKPxJGPZ0Q7xrquG.png\",\"https://miro.medium.com/v2/resize:fit:200/0*9QXOb-vqKFdBLcwC.png\",\"https://miro.medium.com/v2/resize:fit:200/0*IHxXt7FnSpE98DGk.png\"],\"links\":[\"https://us.metoree.com/categories/2129/#manufacturers\",\"https://us.metoree.com/categories/2129/#rankings\",\"https://us.metoree.com/categories/2129/#h2-title-0\",\"https://us.metoree.com/categories/2129/#global-distribution\",\"https://us.metoree.com/categories/2051\",\"https://us.metoree.com/categories/7181\",\"https://us.metoree.com/categories/5241\",\"https://us.metoree.com/categories/6058/\",\"https://us.metoree.com/categories/6381\",\"https://us.metoree.com/categories/accelerometer\",\"https://us.metoree.com/categories/5313\",\"https://us.metoree.com/categories/2427/\",\"https://www.guzik.com/product/miniature-ae/\",\"https://www.guzik.com/\",\"https://us.metoree.com/companies/160120/\",\"https://www.physicalacoustics.com/sensors/\",\"https://www.mistrasgroup.com/\",\"https://us.metoree.com/companies/141565/\",\"https://www.aendt.com/\",\"https://us.metoree.com/companies/145808/\",\"https://www.accretech.eu/en/process-control/in-spindle-ae-sensors/\",\"https://www.accretech.eu/en/\",\"https://us.metoree.com/companies/101351/\",\"https://www.marposs.com/eng/product/acoustic-emission-sensors#:~:text=Artis%20AE%20sensors%20(Acoustic%20Emission,elements%20involved%20in%20the%20process.\",\"https://www.marposs.com/eng/\",\"https://us.metoree.com/companies/15377/\",\"https://www.toseieng.co.jp/component/en/component02/pulcom-ge-10.html\",\"http://www.toseieng.co.jp/global/acctusawebsite/usaindex.html\",\"https://us.metoree.com/companies/8970/\",\"https://www.kistler.com/INT/en/cp/acoustic-emission-ae-measuring-chains-ae-sensor-plus-ae-coupler-both-selectable-8852a/P0001210\",\"https://www.kistler.com/en/\",\"https://us.metoree.com/companies/391/\",\"http://rectuson.com/en/product/02_rt_ae300.jsp\",\"http://rectuson.com/en/index/index.jsp\",\"https://us.metoree.com/companies/207065/\",\"https://www.mpmgmbh.de/en/products/ae-acoustic-emission-systems/ae-sensor-technology.html\",\"https://www.mpmgmbh.de/en/index.html\",\"https://us.metoree.com/companies/206240/\",\"https://www.benthowave.com/products/BII-7230AE.html\",\"https://www.benthowave.com/index.html\",\"https://us.metoree.com/companies/206234/\",\"https://www.mdpi.com/2076-3417/10/24/8966\",\"https://www.mdpi.com/journal/metals\",\"https://us.metoree.com/companies/191032/\",\"https://opg.optica.org/abstract.cfm?uri=ol-34-12-1858\",\"https://opg.optica.org/\",\"https://us.metoree.com/companies/192821/\",\"https://aip.scitation.org/doi/pdf/10.1063/1.5084509\",\"https://aip.scitation.org/journal/jcp\",\"https://us.metoree.com/companies/192774/\",\"https://www.mistrasgroup.com/united-kingdom/how-we-help/equipment/ae/\",\"https://www.mistrasgroup.com/services/\",\"https://us.metoree.com/companies/165206/\",\"https://us.metoree.com/categories/2129/#how-to-create-ranking\",\"https://www.ae-ndt.com/\"],\"app\":\"steemit/0.2\",\"format\":\"html\"}",
"parent_author": "",
"parent_permlink": "sensor",
"permlink": "67kywd-14-ae-sensor-manufacturers-in-2024",
"title": "14 AE Sensor Manufacturers in 2024"
}
],
"op_in_trx": 0,
"timestamp": "2024-10-29T08:50:33",
"trx_id": "c21d76f9d2ad5aa2de351bf4c45ce945dc98071f",
"trx_in_block": 3,
"virtual_op": 0
}barryleepublished a new post: qawrums-ltd-to-exhibit-at-ndt-russia-20242024/10/23 09:53:27
barryleepublished a new post: qawrums-ltd-to-exhibit-at-ndt-russia-2024
2024/10/23 09:53:27
| author | barrylee |
| body | @@ -922,34 +922,120 @@ r%0A%0A%0A -%0A !%5B -Uploading image #1...%5D( +ndt-russia1.jpg%5D(https://cdn.steemitimages.com/DQmZvqWeURnUhyUkTDYLNsU4SXM5dRDfcNabZ58g43uX4iy/ndt-russia1.jpg )%0A%0A! @@ -2090,8 +2090,83 @@ Moscow! +%0A!%5Bndt-russia99.jpg%5D(https://www.aendt.com/uploads/241022/ndt-russian5.jpg) |
| json metadata | {"tags":["d117"],"app":"steemit/0.2","format":"markdown","links":["https://www.aendt.com","https://www.aendt.com/blog/acoustic-emission-testing.html"],"image":["https://cdn.steemitimages.com/DQmZvqWeURnUhyUkTDYLNsU4SXM5dRDfcNabZ58g43uX4iy/ndt-russia1.jpg","https://cdn.steemitimages.com/DQmVSUxLvFKzuSuzPw7tDkJ4BEAGmhykF6dN3MS8uFtx53H/ndt-russia2.jpg","https://cdn.steemitimages.com/DQmPcPVAgoyFcipwb8fucPXUZht5ENqQ6hM5cxZ8i53GWnj/ndt-russia3.jpg","https://cdn.steemitimages.com/DQmcGZjy7NSmv3Rc4zT68E2K7q7kjKbqXW8ZFYiG6YZnxQe/ndt-russia4.jpg","https://cdn.steemitimages.com/DQmXG93CcrxjsbUViGycr8dZQf3rccaszzmAH9h6pGHyKX2/ndt-russia5.jpg","https://www.aendt.com/uploads/241022/ndt-russian5.jpg"]} |
| parent author | |
| parent permlink | ndtrussia |
| permlink | qawrums-ltd-to-exhibit-at-ndt-russia-2024 |
| title | Qawrums Ltd to Exhibit at NDT Russia 2024 |
| Transaction Info | Block #89726588/Trx ec97ca105b75370af2e7430b5dc7de487ffb8fe4 |
View Raw JSON Data
{
  "block": 89726588,
  "op": [
    "comment",
    {
      "author": "barrylee",
      "body": "@@ -922,34 +922,120 @@\n r%0A%0A%0A\n-%0A\n !%5B\n-Uploading image #1...%5D(\n+ndt-russia1.jpg%5D(https://cdn.steemitimages.com/DQmZvqWeURnUhyUkTDYLNsU4SXM5dRDfcNabZ58g43uX4iy/ndt-russia1.jpg\n )%0A%0A!\n@@ -2090,8 +2090,83 @@\n  Moscow!\n+%0A!%5Bndt-russia99.jpg%5D(https://www.aendt.com/uploads/241022/ndt-russian5.jpg)\n",
      "json_metadata": "{\"tags\":[\"d117\"],\"app\":\"steemit/0.2\",\"format\":\"markdown\",\"links\":[\"https://www.aendt.com\",\"https://www.aendt.com/blog/acoustic-emission-testing.html\"],\"image\":[\"https://cdn.steemitimages.com/DQmZvqWeURnUhyUkTDYLNsU4SXM5dRDfcNabZ58g43uX4iy/ndt-russia1.jpg\",\"https://cdn.steemitimages.com/DQmVSUxLvFKzuSuzPw7tDkJ4BEAGmhykF6dN3MS8uFtx53H/ndt-russia2.jpg\",\"https://cdn.steemitimages.com/DQmPcPVAgoyFcipwb8fucPXUZht5ENqQ6hM5cxZ8i53GWnj/ndt-russia3.jpg\",\"https://cdn.steemitimages.com/DQmcGZjy7NSmv3Rc4zT68E2K7q7kjKbqXW8ZFYiG6YZnxQe/ndt-russia4.jpg\",\"https://cdn.steemitimages.com/DQmXG93CcrxjsbUViGycr8dZQf3rccaszzmAH9h6pGHyKX2/ndt-russia5.jpg\",\"https://www.aendt.com/uploads/241022/ndt-russian5.jpg\"]}",
      "parent_author": "",
      "parent_permlink": "ndtrussia",
      "permlink": "qawrums-ltd-to-exhibit-at-ndt-russia-2024",
      "title": "Qawrums Ltd to Exhibit at NDT Russia 2024"
    }
  ],
  "op_in_trx": 0,
  "timestamp": "2024-10-23T09:53:27",
  "trx_id": "ec97ca105b75370af2e7430b5dc7de487ffb8fe4",
  "trx_in_block": 1,
  "virtual_op": 0
}barryleepublished a new post: qawrums-ltd-to-exhibit-at-ndt-russia-20242024/10/23 09:51:42
barryleepublished a new post: qawrums-ltd-to-exhibit-at-ndt-russia-2024
2024/10/23 09:51:42
| author | barrylee |
| body | @@ -918,16 +918,17 @@ ector%0A%0A%0A +%0A !%5BUpload @@ -953,116 +953,465 @@ %0A%0A!%5B -Uploading image #2...%5D()%0A%0A!%5BUploading image #3...%5D()%0A%0A!%5BUploading image #4...%5D()%0A%0A!%5BUploading image #5...%5D() +ndt-russia2.jpg%5D(https://cdn.steemitimages.com/DQmVSUxLvFKzuSuzPw7tDkJ4BEAGmhykF6dN3MS8uFtx53H/ndt-russia2.jpg)%0A%0A!%5Bndt-russia3.jpg%5D(https://cdn.steemitimages.com/DQmPcPVAgoyFcipwb8fucPXUZht5ENqQ6hM5cxZ8i53GWnj/ndt-russia3.jpg)%0A%0A!%5Bndt-russia4.jpg%5D(https://cdn.steemitimages.com/DQmcGZjy7NSmv3Rc4zT68E2K7q7kjKbqXW8ZFYiG6YZnxQe/ndt-russia4.jpg)%0A%0A!%5Bndt-russia5.jpg%5D(https://cdn.steemitimages.com/DQmXG93CcrxjsbUViGycr8dZQf3rccaszzmAH9h6pGHyKX2/ndt-russia5.jpg)%0A %0A%0AEs @@ -1937,18 +1937,16 @@ t.com%0A%0A%0A -%0A%0A Join us |
| json metadata | {"tags":["d117"],"app":"steemit/0.2","format":"markdown","links":["https://www.aendt.com","https://www.aendt.com/blog/acoustic-emission-testing.html"],"image":["https://cdn.steemitimages.com/DQmVSUxLvFKzuSuzPw7tDkJ4BEAGmhykF6dN3MS8uFtx53H/ndt-russia2.jpg","https://cdn.steemitimages.com/DQmPcPVAgoyFcipwb8fucPXUZht5ENqQ6hM5cxZ8i53GWnj/ndt-russia3.jpg","https://cdn.steemitimages.com/DQmcGZjy7NSmv3Rc4zT68E2K7q7kjKbqXW8ZFYiG6YZnxQe/ndt-russia4.jpg","https://cdn.steemitimages.com/DQmXG93CcrxjsbUViGycr8dZQf3rccaszzmAH9h6pGHyKX2/ndt-russia5.jpg"]} |
| parent author | |
| parent permlink | ndtrussia |
| permlink | qawrums-ltd-to-exhibit-at-ndt-russia-2024 |
| title | Qawrums Ltd to Exhibit at NDT Russia 2024 |
| Transaction Info | Block #89726554/Trx 9a3f0404622c4b500579196663f6c8a3dfc344f6 |
View Raw JSON Data
{
  "block": 89726554,
  "op": [
    "comment",
    {
      "author": "barrylee",
      "body": "@@ -918,16 +918,17 @@\n ector%0A%0A%0A\n+%0A\n !%5BUpload\n@@ -953,116 +953,465 @@\n %0A%0A!%5B\n-Uploading image #2...%5D()%0A%0A!%5BUploading image #3...%5D()%0A%0A!%5BUploading image #4...%5D()%0A%0A!%5BUploading image #5...%5D()\n+ndt-russia2.jpg%5D(https://cdn.steemitimages.com/DQmVSUxLvFKzuSuzPw7tDkJ4BEAGmhykF6dN3MS8uFtx53H/ndt-russia2.jpg)%0A%0A!%5Bndt-russia3.jpg%5D(https://cdn.steemitimages.com/DQmPcPVAgoyFcipwb8fucPXUZht5ENqQ6hM5cxZ8i53GWnj/ndt-russia3.jpg)%0A%0A!%5Bndt-russia4.jpg%5D(https://cdn.steemitimages.com/DQmcGZjy7NSmv3Rc4zT68E2K7q7kjKbqXW8ZFYiG6YZnxQe/ndt-russia4.jpg)%0A%0A!%5Bndt-russia5.jpg%5D(https://cdn.steemitimages.com/DQmXG93CcrxjsbUViGycr8dZQf3rccaszzmAH9h6pGHyKX2/ndt-russia5.jpg)%0A\n %0A%0AEs\n@@ -1937,18 +1937,16 @@\n t.com%0A%0A%0A\n-%0A%0A\n Join us \n",
      "json_metadata": "{\"tags\":[\"d117\"],\"app\":\"steemit/0.2\",\"format\":\"markdown\",\"links\":[\"https://www.aendt.com\",\"https://www.aendt.com/blog/acoustic-emission-testing.html\"],\"image\":[\"https://cdn.steemitimages.com/DQmVSUxLvFKzuSuzPw7tDkJ4BEAGmhykF6dN3MS8uFtx53H/ndt-russia2.jpg\",\"https://cdn.steemitimages.com/DQmPcPVAgoyFcipwb8fucPXUZht5ENqQ6hM5cxZ8i53GWnj/ndt-russia3.jpg\",\"https://cdn.steemitimages.com/DQmcGZjy7NSmv3Rc4zT68E2K7q7kjKbqXW8ZFYiG6YZnxQe/ndt-russia4.jpg\",\"https://cdn.steemitimages.com/DQmXG93CcrxjsbUViGycr8dZQf3rccaszzmAH9h6pGHyKX2/ndt-russia5.jpg\"]}",
      "parent_author": "",
      "parent_permlink": "ndtrussia",
      "permlink": "qawrums-ltd-to-exhibit-at-ndt-russia-2024",
      "title": "Qawrums Ltd to Exhibit at NDT Russia 2024"
    }
  ],
  "op_in_trx": 0,
  "timestamp": "2024-10-23T09:51:42",
  "trx_id": "9a3f0404622c4b500579196663f6c8a3dfc344f6",
  "trx_in_block": 6,
  "virtual_op": 0
}barryleepublished a new post: qawrums-ltd-to-exhibit-at-ndt-russia-20242024/10/23 09:50:45
barryleepublished a new post: qawrums-ltd-to-exhibit-at-ndt-russia-2024
2024/10/23 09:50:45
| author | barrylee |
| body | @@ -1,20 +1,52 @@ +%3Ca href=%22https://www.aendt.com%22%3E Qawrums Ltd is pleas @@ -36,16 +36,20 @@ rums Ltd +%3C/a%3E is plea @@ -416,35 +416,139 @@ in -acoustic emission testing, +%3Ca href=%22https://www.aendt.com/blog/acoustic-emission-testing.html%22%3Eacoustic emission testing%3C/a%3E, %3Ca href=%22https://www.aendt.com%22%3E Qawr @@ -554,16 +554,20 @@ rums Ltd +%3C/a%3E (former |
| json metadata | {"tags":["d117"],"app":"steemit/0.2","format":"markdown","links":["https://www.aendt.com","https://www.aendt.com/blog/acoustic-emission-testing.html"]} |
| parent author | |
| parent permlink | ndtrussia |
| permlink | qawrums-ltd-to-exhibit-at-ndt-russia-2024 |
| title | Qawrums Ltd to Exhibit at NDT Russia 2024 |
| Transaction Info | Block #89726535/Trx 481e8a0fa51b3d0f8794314d0597cf0585b61072 |
View Raw JSON Data
{
  "block": 89726535,
  "op": [
    "comment",
    {
      "author": "barrylee",
      "body": "@@ -1,20 +1,52 @@\n+%3Ca href=%22https://www.aendt.com%22%3E\n Qawrums Ltd is pleas\n@@ -36,16 +36,20 @@\n rums Ltd\n+%3C/a%3E\n  is plea\n@@ -416,35 +416,139 @@\n  in \n-acoustic emission testing, \n+%3Ca href=%22https://www.aendt.com/blog/acoustic-emission-testing.html%22%3Eacoustic emission testing%3C/a%3E, %3Ca href=%22https://www.aendt.com%22%3E\n Qawr\n@@ -554,16 +554,20 @@\n rums Ltd\n+%3C/a%3E\n  (former\n",
      "json_metadata": "{\"tags\":[\"d117\"],\"app\":\"steemit/0.2\",\"format\":\"markdown\",\"links\":[\"https://www.aendt.com\",\"https://www.aendt.com/blog/acoustic-emission-testing.html\"]}",
      "parent_author": "",
      "parent_permlink": "ndtrussia",
      "permlink": "qawrums-ltd-to-exhibit-at-ndt-russia-2024",
      "title": "Qawrums Ltd to Exhibit at NDT Russia 2024"
    }
  ],
  "op_in_trx": 0,
  "timestamp": "2024-10-23T09:50:45",
  "trx_id": "481e8a0fa51b3d0f8794314d0597cf0585b61072",
  "trx_in_block": 13,
  "virtual_op": 0
}barryleepublished a new post: qawrums-ltd-to-exhibit-at-ndt-russia-20242024/10/23 09:49:33
barryleepublished a new post: qawrums-ltd-to-exhibit-at-ndt-russia-2024
2024/10/23 09:49:33
| author | barrylee |
| body | Qawrums Ltd is pleased to announce our participation in the 24th International Exhibition of Equipment for Non-Destructive Testing, NDT Russia, taking place from October 22–24,2024, at Pavilion1, Hall3, Crocus Expo, Moscow, Russia. This event, organized by MVK, is a key platform for showcasing innovation in the non-destructive testing industry. With over 20 years of expertise in acoustic emission testing, Qawrums Ltd (formerly QingCheng Ltd.) specializes in the development, production, and technical application of advanced acoustic emission testing equipment and systems. Our featured products at the exhibition will include: ACOUSTIC EMISSION IIOT WIRELESS ONLINE MONITORING SYSTEM ACOUSTIC EMISSION SENSORS SAEU3H Multi-channel AE System SUB180 Ultrasonic Flaw Detector ![Uploading image #1...]() ![Uploading image #2...]() ![Uploading image #3...]() ![Uploading image #4...]() ![Uploading image #5...]() Established in 2000, Qawrums Ltd operates from our headquarters in Guangzhou and a branch office in Beijing. Our mission is to provide high-quality IIoT online solutions for predictive maintenance, enhancing the reliability and safety of industrial assets globally. We invite industry professionals to visit our booth #D117 to explore our innovative technologies and discuss how our solutions can support their condition monitoring needs. For more information about our participation at NDT Russia, please visit www.aendt.com Join us in shaping the future of non-destructive testing in Moscow! |
| json metadata | {"tags":["ndtrussia","d117"],"app":"steemit/0.2","format":"markdown"} |
| parent author | |
| parent permlink | ndtrussia |
| permlink | qawrums-ltd-to-exhibit-at-ndt-russia-2024 |
| title | Qawrums Ltd to Exhibit at NDT Russia 2024 |
| Transaction Info | Block #89726511/Trx 8b7b1a69fc4849ec48f45600886cdb65fe7d37f1 |
View Raw JSON Data
{
  "block": 89726511,
  "op": [
    "comment",
    {
      "author": "barrylee",
      "body": "Qawrums Ltd is pleased to announce our participation in the 24th International Exhibition of Equipment for Non-Destructive Testing, NDT Russia, taking place from October 22–24,2024, at Pavilion1, Hall3, Crocus Expo, Moscow, Russia. This event, organized by MVK, is a key platform for showcasing innovation in the non-destructive testing industry.\n\nWith over 20 years of expertise in acoustic emission testing, Qawrums Ltd (formerly QingCheng Ltd.) specializes in the development, production, and technical application of advanced acoustic emission testing equipment and systems. Our featured products at the exhibition will include:\nACOUSTIC EMISSION IIOT WIRELESS ONLINE MONITORING SYSTEM\nACOUSTIC EMISSION SENSORS\nSAEU3H Multi-channel AE System\nSUB180 Ultrasonic Flaw Detector\n\n\n![Uploading image #1...]()\n\n![Uploading image #2...]()\n\n![Uploading image #3...]()\n\n![Uploading image #4...]()\n\n![Uploading image #5...]()\n\nEstablished in 2000, Qawrums Ltd operates from our headquarters in Guangzhou and a branch office in Beijing. Our mission is to provide high-quality IIoT online solutions for predictive maintenance, enhancing the reliability and safety of industrial assets globally.\n\nWe invite industry professionals to visit our booth #D117 to explore our innovative technologies and discuss how our solutions can support their condition monitoring needs. For more information about our participation at NDT Russia, please visit www.aendt.com\n\n\n\n\nJoin us in shaping the future of non-destructive testing in Moscow!",
      "json_metadata": "{\"tags\":[\"ndtrussia\",\"d117\"],\"app\":\"steemit/0.2\",\"format\":\"markdown\"}",
      "parent_author": "",
      "parent_permlink": "ndtrussia",
      "permlink": "qawrums-ltd-to-exhibit-at-ndt-russia-2024",
      "title": "Qawrums Ltd to Exhibit at NDT Russia 2024"
    }
  ],
  "op_in_trx": 0,
  "timestamp": "2024-10-23T09:49:33",
  "trx_id": "8b7b1a69fc4849ec48f45600886cdb65fe7d37f1",
  "trx_in_block": 2,
  "virtual_op": 0
}barryleepublished a new post: qawrums-new-exhibitor-of-the-ndt-russia2024/10/18 08:32:36
barryleepublished a new post: qawrums-new-exhibitor-of-the-ndt-russia
2024/10/18 08:32:36
| author | barrylee |
| body | @@ -43,50 +43,143 @@ the -Qawrums company will present you with the +%3Ca href=%22https://www.aendt.com%22%3EQawrums Ltd. %3C/a%3Ecompany will present you with the %3Ca href=%22https://www.aendt.com/plus/list.php?tid=6%22%3E IIoT @@ -228,24 +228,28 @@ ing systems +%3C/a%3E for structur |
| json metadata | {"image":["https://cdn.steemitimages.com/DQmTLaXnpkUvmmtiAqE6ZUSKspHXAJSgyf8XwmEJDuLxKTB/mvk[2].jpg","https://cdn.steemitimages.com/DQmU33bz617KQfr2aQK7t533udtZ9AAzJ3rdX7rnFMgVYDJ/0_zNL4hZG4gQKvvDjC[1].jpg"],"links":["https://www.aendt.com","https://www.aendt.com/plus/list.php?tid=6","https://aendt.com/","https://www.aendt.ru/"],"app":"steemit/0.2","format":"markdown"} |
| parent author | |
| parent permlink | ndtrussia |
| permlink | qawrums-new-exhibitor-of-the-ndt-russia |
| title | QAWRUMS — new exhibitor of the NDT Russia |
| Transaction Info | Block #89581754/Trx bd151969f4e824bba2aeb39713c197adff308611 |
View Raw JSON Data
{
  "block": 89581754,
  "op": [
    "comment",
    {
      "author": "barrylee",
      "body": "@@ -43,50 +43,143 @@\n the \n-Qawrums company will present you with the \n+%3Ca href=%22https://www.aendt.com%22%3EQawrums Ltd. %3C/a%3Ecompany will present you with the %3Ca href=%22https://www.aendt.com/plus/list.php?tid=6%22%3E\n IIoT\n@@ -228,24 +228,28 @@\n ing systems \n+%3C/a%3E\n for structur\n",
      "json_metadata": "{\"image\":[\"https://cdn.steemitimages.com/DQmTLaXnpkUvmmtiAqE6ZUSKspHXAJSgyf8XwmEJDuLxKTB/mvk[2].jpg\",\"https://cdn.steemitimages.com/DQmU33bz617KQfr2aQK7t533udtZ9AAzJ3rdX7rnFMgVYDJ/0_zNL4hZG4gQKvvDjC[1].jpg\"],\"links\":[\"https://www.aendt.com\",\"https://www.aendt.com/plus/list.php?tid=6\",\"https://aendt.com/\",\"https://www.aendt.ru/\"],\"app\":\"steemit/0.2\",\"format\":\"markdown\"}",
      "parent_author": "",
      "parent_permlink": "ndtrussia",
      "permlink": "qawrums-new-exhibitor-of-the-ndt-russia",
      "title": "QAWRUMS — new exhibitor of the NDT Russia"
    }
  ],
  "op_in_trx": 0,
  "timestamp": "2024-10-18T08:32:36",
  "trx_id": "bd151969f4e824bba2aeb39713c197adff308611",
  "trx_in_block": 2,
  "virtual_op": 0
}barryleepublished a new post: qawrums-new-exhibitor-of-the-ndt-russia2024/10/18 08:31:21
barryleepublished a new post: qawrums-new-exhibitor-of-the-ndt-russia
2024/10/18 08:31:21
| author | barrylee |
| body | @@ -1771,16 +1771,153 @@ stems.%0A%0A +%0A!%5B0_zNL4hZG4gQKvvDjC%5B1%5D.jpg%5D(https://cdn.steemitimages.com/DQmU33bz617KQfr2aQK7t533udtZ9AAzJ3rdX7rnFMgVYDJ/0_zNL4hZG4gQKvvDjC%5B1%5D.jpg)%0A%0A%0A The acou @@ -2377,16 +2377,17 @@ itoring%0A +%0A Visitors |
| json metadata | {"image":["https://cdn.steemitimages.com/DQmTLaXnpkUvmmtiAqE6ZUSKspHXAJSgyf8XwmEJDuLxKTB/mvk[2].jpg","https://cdn.steemitimages.com/DQmU33bz617KQfr2aQK7t533udtZ9AAzJ3rdX7rnFMgVYDJ/0_zNL4hZG4gQKvvDjC[1].jpg"],"links":["https://aendt.com/","https://www.aendt.ru/"],"app":"steemit/0.2","format":"markdown"} |
| parent author | |
| parent permlink | ndtrussia |
| permlink | qawrums-new-exhibitor-of-the-ndt-russia |
| title | QAWRUMS — new exhibitor of the NDT Russia |
| Transaction Info | Block #89581729/Trx ba10e55e04f960723f3bf88ca18bb73a91d73c86 |
View Raw JSON Data
{
  "block": 89581729,
  "op": [
    "comment",
    {
      "author": "barrylee",
      "body": "@@ -1771,16 +1771,153 @@\n stems.%0A%0A\n+%0A!%5B0_zNL4hZG4gQKvvDjC%5B1%5D.jpg%5D(https://cdn.steemitimages.com/DQmU33bz617KQfr2aQK7t533udtZ9AAzJ3rdX7rnFMgVYDJ/0_zNL4hZG4gQKvvDjC%5B1%5D.jpg)%0A%0A%0A\n The acou\n@@ -2377,16 +2377,17 @@\n itoring%0A\n+%0A\n Visitors\n",
      "json_metadata": "{\"image\":[\"https://cdn.steemitimages.com/DQmTLaXnpkUvmmtiAqE6ZUSKspHXAJSgyf8XwmEJDuLxKTB/mvk[2].jpg\",\"https://cdn.steemitimages.com/DQmU33bz617KQfr2aQK7t533udtZ9AAzJ3rdX7rnFMgVYDJ/0_zNL4hZG4gQKvvDjC[1].jpg\"],\"links\":[\"https://aendt.com/\",\"https://www.aendt.ru/\"],\"app\":\"steemit/0.2\",\"format\":\"markdown\"}",
      "parent_author": "",
      "parent_permlink": "ndtrussia",
      "permlink": "qawrums-new-exhibitor-of-the-ndt-russia",
      "title": "QAWRUMS — new exhibitor of the NDT Russia"
    }
  ],
  "op_in_trx": 0,
  "timestamp": "2024-10-18T08:31:21",
  "trx_id": "ba10e55e04f960723f3bf88ca18bb73a91d73c86",
  "trx_in_block": 1,
  "virtual_op": 0
}barryleepublished a new post: qawrums-new-exhibitor-of-the-ndt-russia2024/10/18 08:28:36
barryleepublished a new post: qawrums-new-exhibitor-of-the-ndt-russia
2024/10/18 08:28:36
| author | barrylee |
| body | @@ -1089,16 +1089,18 @@ tform.%0A%0A +%0A%0A RAEM1 is |
| json metadata | {"image":["https://cdn.steemitimages.com/DQmTLaXnpkUvmmtiAqE6ZUSKspHXAJSgyf8XwmEJDuLxKTB/mvk[2].jpg"],"links":["https://aendt.com/","https://www.aendt.ru/"],"app":"steemit/0.2","format":"markdown"} |
| parent author | |
| parent permlink | ndtrussia |
| permlink | qawrums-new-exhibitor-of-the-ndt-russia |
| title | QAWRUMS — new exhibitor of the NDT Russia |
| Transaction Info | Block #89581674/Trx 695df12158ec9914b331d3e530a164cee4e71928 |
View Raw JSON Data
{
  "block": 89581674,
  "op": [
    "comment",
    {
      "author": "barrylee",
      "body": "@@ -1089,16 +1089,18 @@\n tform.%0A%0A\n+%0A%0A\n RAEM1 is\n",
      "json_metadata": "{\"image\":[\"https://cdn.steemitimages.com/DQmTLaXnpkUvmmtiAqE6ZUSKspHXAJSgyf8XwmEJDuLxKTB/mvk[2].jpg\"],\"links\":[\"https://aendt.com/\",\"https://www.aendt.ru/\"],\"app\":\"steemit/0.2\",\"format\":\"markdown\"}",
      "parent_author": "",
      "parent_permlink": "ndtrussia",
      "permlink": "qawrums-new-exhibitor-of-the-ndt-russia",
      "title": "QAWRUMS — new exhibitor of the NDT Russia"
    }
  ],
  "op_in_trx": 0,
  "timestamp": "2024-10-18T08:28:36",
  "trx_id": "695df12158ec9914b331d3e530a164cee4e71928",
  "trx_in_block": 0,
  "virtual_op": 0
}barryleepublished a new post: qawrums-new-exhibitor-of-the-ndt-russia2024/10/18 08:27:42
barryleepublished a new post: qawrums-new-exhibitor-of-the-ndt-russia
2024/10/18 08:27:42
| author | barrylee |
| body | At the coming NDT Russia 2024 exhibition, the Qawrums company will present you with the IIoT Acoustic Emission wireless online monitoring systems for structure health and condition monitoring purposes, as well as the handheld ultrasonic detectors. ![mvk[2].jpg](https://cdn.steemitimages.com/DQmTLaXnpkUvmmtiAqE6ZUSKspHXAJSgyf8XwmEJDuLxKTB/mvk[2].jpg) Qawrums Ltd. (previous name: “QingCheng Ltd.”) is an enterprise specializing in the research and development, production and technical application services of acoustic emission systems for more than 20 years. The company was established in 2000 and have offices in Guangzhou (headquarter) and Beijing (branch), China. Their products have been sold to all over the world, including North and South America, Australia, South Asia, Japan, Korea, Russia, middle east, India and more. The RAEM system is the latest IIoT-AE product series for remote unattended acoustic wave (acoustic emission) long term monitoring applications. The system includes from the acoustic emission sensors and acquisition modules to the software and cloud platform. RAEM1 is a single channel full functional version of RAEM. RAEM1–6 is a 6-channel integrated clock synchronized version. RAEM2 is a single channel time trigger power saving with built-in battery and sensor. The Qingcheng IoT Cloud platform is an cloud platform for RAEM and IoT devices to upload or download data, to display AE waveform, parameters and alarm information, to remote read and write devices, to send alarm notifications to users via SMS and emails and more. In addition, we also develop and manufacture vibration testing system (SVT series), handheld ultrasonic gauges (SUB180/ SW6/ SW7), other testing and inspection systems, and condition monitoring systems. The acoustic emission monitoring systems and other vibration system or handheld ultrasonic detectors can be used in many industrial applications, such as: Oil and gas valve and pipeline leakage monitoring Wind turbine and blades structure and condition monitoring Bridge wire rope cable breakage and steel girder cracks monitoring Storage tanks corrosion monitoring Rotating machinery condition monitoring Cutting tool condition monitoring Structural parts monitoring Visitors to NDT Russia 2024 will be able to see these new products in person at the stand of Qawrums. Both new and existing customers are welcome and the staff will introduce you with the detail technical information, solutions and answer questions. You can also check on the Qawrums website (English) https://aendt.com/ or (Russian) https://www.aendt.ru/ for more information. |
| json metadata | {"tags":["ndtrussia"],"image":["https://cdn.steemitimages.com/DQmTLaXnpkUvmmtiAqE6ZUSKspHXAJSgyf8XwmEJDuLxKTB/mvk[2].jpg"],"links":["https://aendt.com/","https://www.aendt.ru/"],"app":"steemit/0.2","format":"markdown"} |
| parent author | |
| parent permlink | ndtrussia |
| permlink | qawrums-new-exhibitor-of-the-ndt-russia |
| title | QAWRUMS — new exhibitor of the NDT Russia |
| Transaction Info | Block #89581656/Trx e1051f4a63fc4fdf3a2c066ab4b0377df9d6ac0b |
View Raw JSON Data
{
  "block": 89581656,
  "op": [
    "comment",
    {
      "author": "barrylee",
      "body": "At the coming NDT Russia 2024 exhibition, the Qawrums company will present you with the IIoT Acoustic Emission wireless online monitoring systems for structure health and condition monitoring purposes, as well as the handheld ultrasonic detectors.\n\n\n![mvk[2].jpg](https://cdn.steemitimages.com/DQmTLaXnpkUvmmtiAqE6ZUSKspHXAJSgyf8XwmEJDuLxKTB/mvk[2].jpg)\n\nQawrums Ltd. (previous name: “QingCheng Ltd.”) is an enterprise specializing in the research and development, production and technical application services of acoustic emission systems for more than 20 years. The company was established in 2000 and have offices in Guangzhou (headquarter) and Beijing (branch), China. Their products have been sold to all over the world, including North and South America, Australia, South Asia, Japan, Korea, Russia, middle east, India and more.\n\nThe RAEM system is the latest IIoT-AE product series for remote unattended acoustic wave (acoustic emission) long term monitoring applications. The system includes from the acoustic emission sensors and acquisition modules to the software and cloud platform.\n\nRAEM1 is a single channel full functional version of RAEM.\nRAEM1–6 is a 6-channel integrated clock synchronized version.\nRAEM2 is a single channel time trigger power saving with built-in battery and sensor.\n\n\nThe Qingcheng IoT Cloud platform is an cloud platform for RAEM and IoT devices to upload or download data, to display AE waveform, parameters and alarm information, to remote read and write devices, to send alarm notifications to users via SMS and emails and more.\n\n\nIn addition, we also develop and manufacture vibration testing system (SVT series), handheld ultrasonic gauges (SUB180/ SW6/ SW7), other testing and inspection systems, and condition monitoring systems.\n\nThe acoustic emission monitoring systems and other vibration system or handheld ultrasonic detectors can be used in many industrial applications, such as:\n\nOil and gas valve and pipeline leakage monitoring\nWind turbine and blades structure and condition monitoring\nBridge wire rope cable breakage and steel girder cracks monitoring\nStorage tanks corrosion monitoring\nRotating machinery condition monitoring\nCutting tool condition monitoring\nStructural parts monitoring\nVisitors to NDT Russia 2024 will be able to see these new products in person at the stand of Qawrums. Both new and existing customers are welcome and the staff will introduce you with the detail technical information, solutions and answer questions. You can also check on the Qawrums website (English) https://aendt.com/ or (Russian) https://www.aendt.ru/ for more information.",
      "json_metadata": "{\"tags\":[\"ndtrussia\"],\"image\":[\"https://cdn.steemitimages.com/DQmTLaXnpkUvmmtiAqE6ZUSKspHXAJSgyf8XwmEJDuLxKTB/mvk[2].jpg\"],\"links\":[\"https://aendt.com/\",\"https://www.aendt.ru/\"],\"app\":\"steemit/0.2\",\"format\":\"markdown\"}",
      "parent_author": "",
      "parent_permlink": "ndtrussia",
      "permlink": "qawrums-new-exhibitor-of-the-ndt-russia",
      "title": "QAWRUMS — new exhibitor of the NDT Russia"
    }
  ],
  "op_in_trx": 0,
  "timestamp": "2024-10-18T08:27:42",
  "trx_id": "e1051f4a63fc4fdf3a2c066ab4b0377df9d6ac0b",
  "trx_in_block": 0,
  "virtual_op": 0
}2024/10/17 10:30:54
2024/10/17 10:30:54
| author | barrylee |
| body | 应用介绍 材料在应力作用下的变形与裂纹扩展,是结构失效的重要机制。声波(声发射)无损检测技术,可以推断损伤情况和发展规律,对结构件损伤发生和发展趋势做出预测。 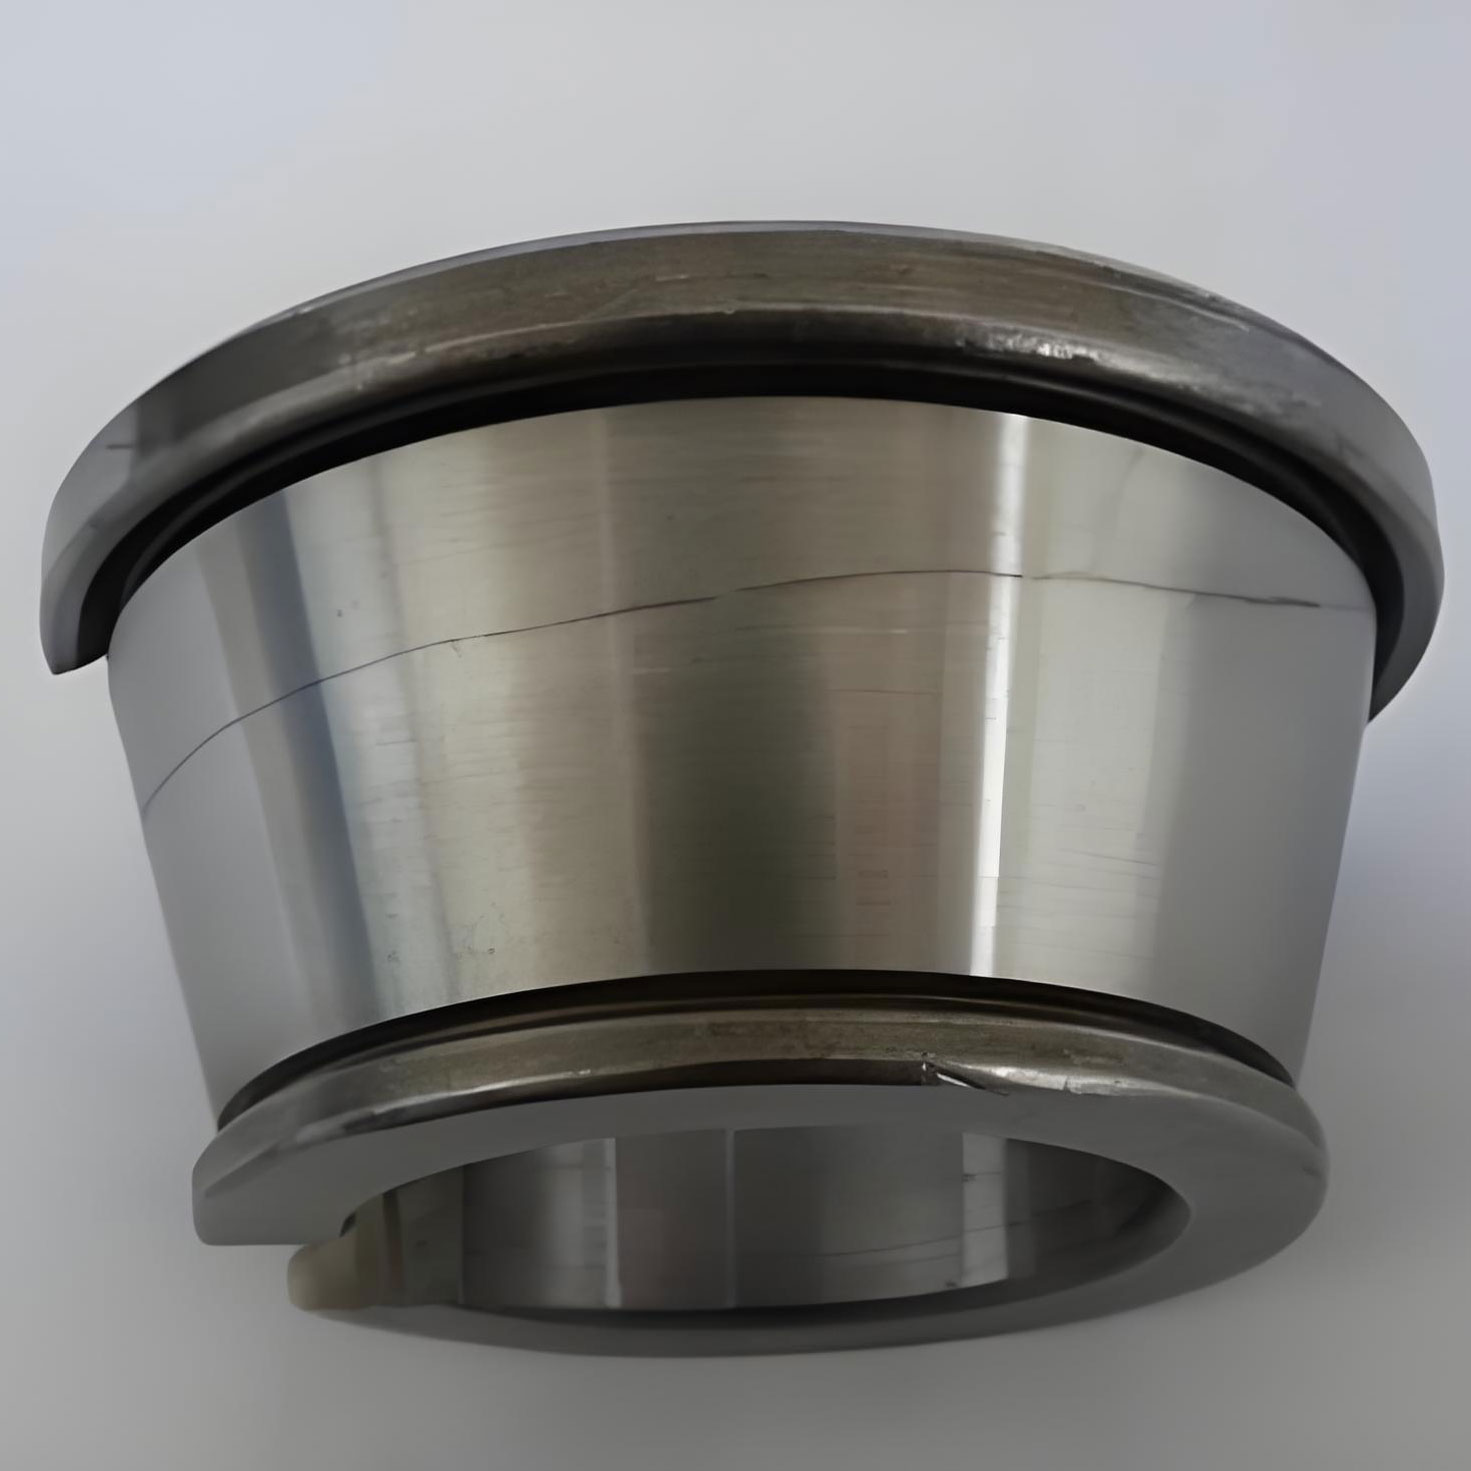 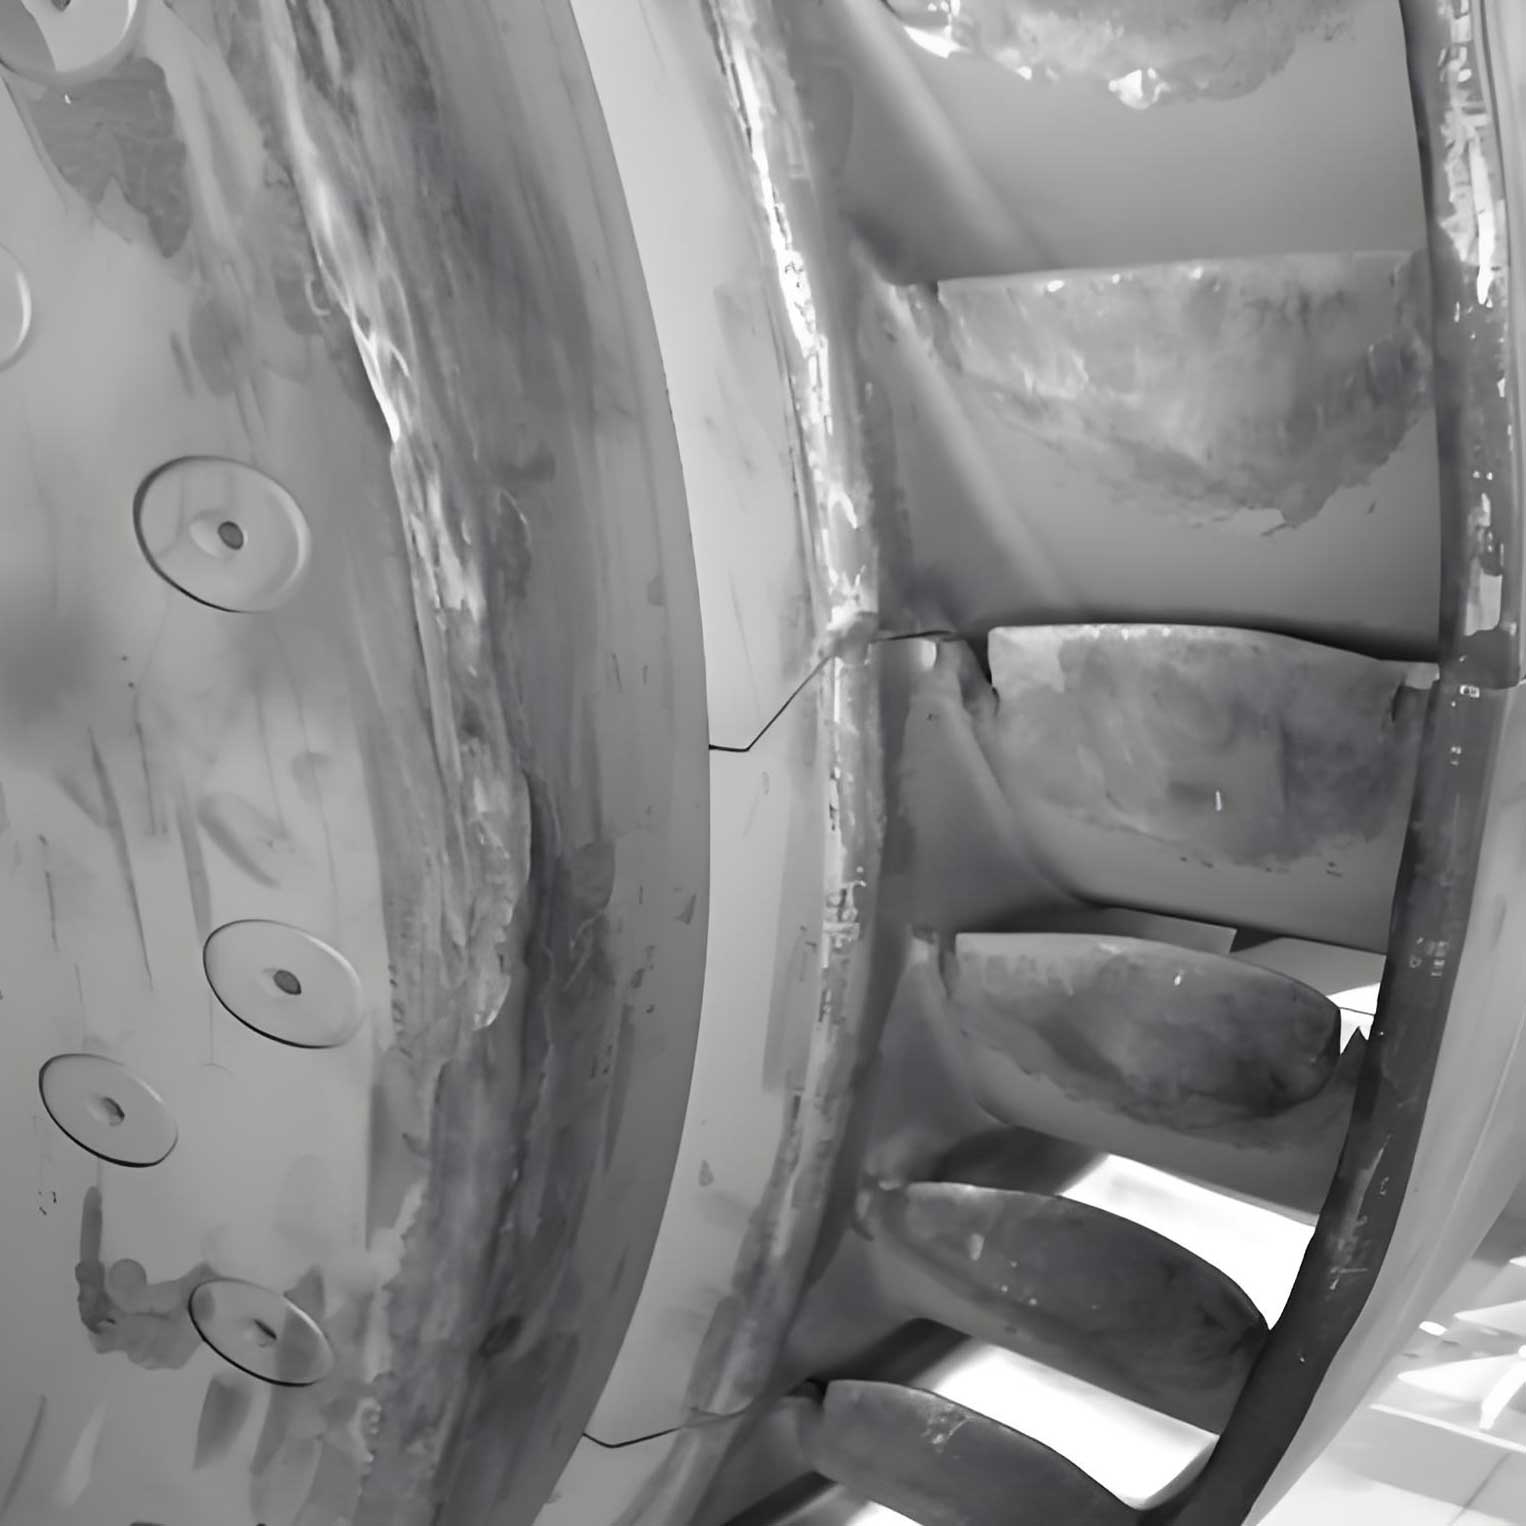 原理 结构材料中的裂纹、形变、脱粘分层等损伤过程常伴有声波(声发射)信号产生,接收分析这个声波并判断损伤程度和位置,对结构件完整性做出健康评价,用户能够及时对结构件早期损伤进行维修,延长结构件的寿命。 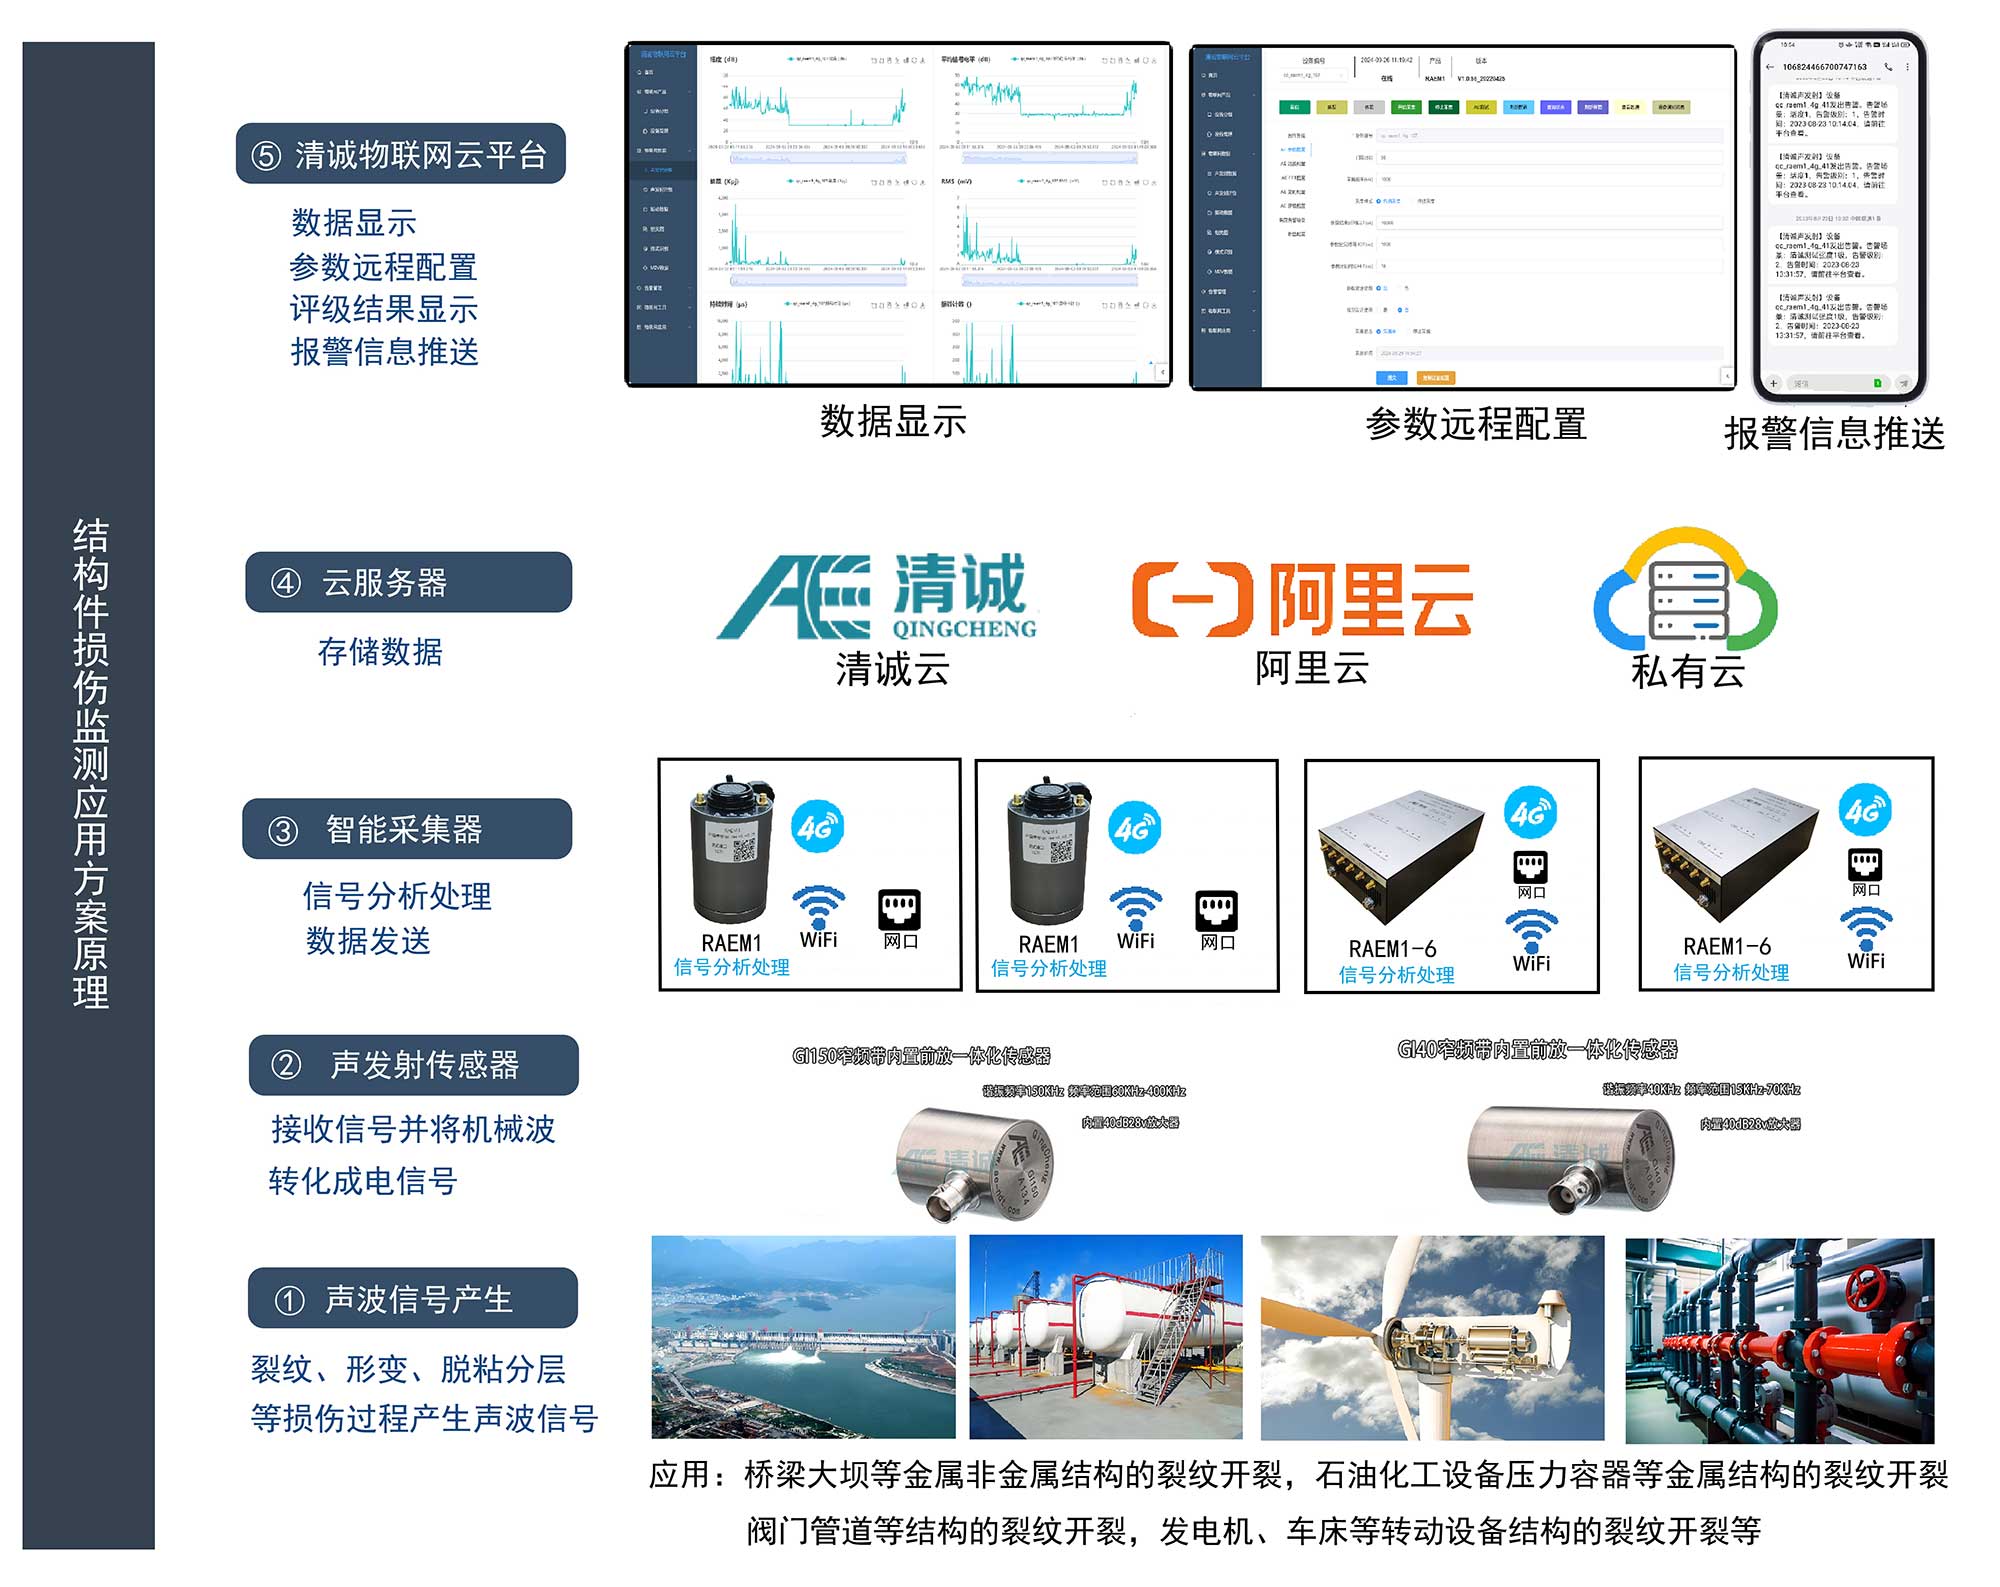 过程可视化 365天在线声发射监测检测,全过程自动分析结果,物联网远程操作使用。 自动给出检测监测诊断结果; 在线和历史数据屏幕显示; 报警信息主动推送。 结果 实现了各种材料的结构件损伤声波(声发射)监测检测,并把损伤等级推送给用户。用户可根据等级及时开展对应维修,以延长结构件寿命,杜绝设备因结构件失效导致的事故和损失。 在线 — — 声波(声发射)采集器安装在被监测诊断的对象上,实现全时段全天候状态监测故障诊断。 智能 — — 自动给出监测诊断结果,不需要人工分析处理数据,不需要人工操作,数据采集分析报告展示整个监测诊断全过程自动进行。 远程 — — 借助物联网系统,用户可以在任何位置得到任意不限距离位置的监测诊断点的监测诊断结果,在线即时结果和历史过程结果。 适用范围 适用于各种材料设备(如桥梁、风电、刀具、储罐、作业平台等设备)的结构件损伤监测。例如:桥梁大坝等金属非金属结构的裂纹开裂,石油化工设备压力容器等金属结构的裂纹开裂,阀门管道等结构的裂纹开裂,发电机、车床等转动设备结构的裂纹开裂等。 解决方案 RAEM1系列远程声波(声发射)监测系统 原理:结构件在长期服役过程中,通常会受到复杂载荷的作用,令其内部或表面产生裂纹,进而产生声波(声发射)信号,信号沿表面传播,被安装在悬臂梁上的声发射传感器接收,RAEM1分析处理信号,通过RAEM1内置的通讯模块将数据发送至云端服务器,云平台远程监测结构件实时状况。 系统组成通讯方式声发射传感器、RAEM1声波(声发射)检测仪、云服务器、客户端4G、WiFi、网口 RAEM1–6系列远程声波(声发射)监测系统 原理:结构件在长期服役过程中,通常会受到复杂载荷的作用,令其内部或表面产生裂纹,进而产生声波(声发射)信号,信号沿表面传播,被安装在悬臂梁上的声发射传感器接收,RAEM1–6分析处理信号,通过RAEM1–6内置的通讯模块将数据发送至云端服务器,云平台远程监测结构件实时状况。 系统组成通讯方式声发射传感器、RAEM1–6声波(声发射)检测仪、云服务器、客户端4G、WiFi、网口 流程 a)关键部位安装设备,检测监测结构件损伤状态; b)分析验证,得到判据标准; c)合理配置参数、评级参数; d)开启监测,达到报警界限,手机、云平台推送报警信息。 设备介绍 智能采集器 名称RAEM1–6声波(声发射)检测仪RAEM1声波(声发射)检测仪采样频率单个通道最大采样率2M点/秒单个通道最大采样率2M点/秒采样精度16位16位通道数单通道、6通道或级联使用单通道或多通道组合使用输入带宽10KHz-800KHz10KHz-800KHz系统噪声优于30dB优于30dB动态范围70dB70dB模拟滤波器30kHz、125kHz两个高通滤波器,80kHz、175kHz两个低通滤波器组合,默认30kHz~80kHz,125kHz~175kHz两种带通滤波器组合,出厂固定30kHz、125kHz两个高通滤波器,80kHz、175kHz两个低通滤波器组合,默认30kHz~80kHz,125kHz~175kHz两种带通滤波器组合,出厂固定数字滤波器0kHz~1000kHz频率范围内任意数值设置直通、高通、低通、带通(结合模拟滤波器使用)256阶的FIR滤波器,0kHz~1000kHz频率范围内任意数值设置直通、高通、低通、带通传感器内置前放系列传感器,三种内置前放可选:28V40dB,12V34dB,5V26dB内置前放系列传感器,三种内置前放可选:28V40dB,12V34dB,5V26dB数据输出波形、参数、参数评级波形、参数、参数评级AE特征参数参数到达时间,幅度,振铃计数,能量,上升时间,上升计数,持续时间,RMS,ASL,峰值频率,质心频率,5个局部功率谱占比到达时间,幅度,振铃计数,能量,上升时间,上升计数,持续时间,RMS,ASL,峰值频率,质心频率,5个局部功率谱占比内置SD卡容量64G(可拓展至512G)64G(可拓展至512G)通讯方式4G、网口、WiFi4G、网口、WiFi、RS485供电12VDC12VDC尺寸长×宽×高:22cm×13cm×8cm圆筒直径φ62mm,高度 100mm重量1.6kg220g安装/底部自带磁性,可吸附于被测物体表面防护等级/IP65工作温度-20℃~60℃(WiFi版本为0℃~60℃)-20℃~60℃(WiFi版本为0℃~60℃)优势基于Linus操作系统,性能稳定,具有无线通信能力,适合长时间远程无人值守监控,设备可级联组成大型监测系统。集信号采集、信号分析、通讯数据输出于一体的智能声发射采集器,其底部带磁性,安装时可将设备直接与金属物体耦合。 台式声波(声发射)检测仪 名称SAEU3H集成声波(声发射)检测仪采样频率单个通道最大采样率10M点/秒,采样率连续可调,每个通道可独立设置采样精度16位数据通过率单个USB3.0接口连接通过率最大高于300MB/秒,两个独立USB3.0接口连接通过率最大高于600MB/秒连续波形采集10M/s采样率16位精度15通道连续波形连续采集大通道数特征参数采集10M/s采样率16位精度128通道特征参数数据采集及存储不丢失采集卡通道数每个采集卡具有4个独立通道采集卡内存容量1Gb每张采集卡采集机箱4通道、20通道、48通道三种基本型号机箱通道扩展多机箱可级联组成128通道声发射系统,每个机箱亦可作为独立主机使用声发射信号处理每个采集卡硬件均具有AE特征参数实时提取功能,通道可独立设置波形采样长度最大单个波形采样长度,每通道可同时达128k采样点,通道可独立设置波形前采功能触发前预采集长度可达128k采样点,通道可独立设置AE信号输入范围±10V,可向下调整信号输入电压范围至±5V,±2V,±1V,±0.1V,通道可独立设置响应频率1kHz-2.5MHz(-3dB带宽)模拟滤波器20kHz、100kHz、400kHz三个高通滤波器,100kHz、400kHz、1200kHz三个低通滤波器,通过软件选择各种组合,可逐个通道独立设置硬件实时数字滤波器1kHz-2MHz频率范围内任意数值设置直通、高通、低通、带通及带阻。主机噪声﹤15dB(空载)动态范围85dB最大信号幅度100dB(使用40dB前放,对应传感器输出为100毫伏)输入阻抗50ΩAE特征参数过门限到达时间、峰值到达时间、幅度、振铃计数、持续时间、相对能量、绝对能量、信号强度、上升计数、上升时间、有效值RMS、平均值ASL、起始相位、12个外参、质心频率、峰值频率、5个局部功率谱、质心频率、原始频率、回荡频率、平均频率外参采集仪器标配8个模拟外参数输入通道,最多可扩展至96个外参通道,外参总采样率达到每秒1M采样点,采样精度16位,外参输入范围±10V,可通过软件变换为信号源的物理单位报警输出主机以开关、灯方式输出报警控制信号机箱尺寸4通道机箱:320mm×125mm×50mm;(长×宽×高); 20通道机箱:308mm×225mm×133mm;(长×宽×高); 48通道机箱:308mm×368mm×133mm;(长×宽×高)工作温度10℃~﹢45℃ 声发射传感器 名称GI150窄频带内置前放一体化GI40窄频带内置前放一体化谐振频率150KHz40KHz频率范围60KHz~400KHz15KHz~70KHz灵敏度>75dB>75dB前置放大器40dB28V40dB28V接口类型BNCBNC防护等级IP62IP62使用温度-20℃~50℃-20℃~50℃尺寸(mm)Ф30×36.5Ф30×57 清诚云 数据上传到云端物联网平台(清诚云)显示分析。AE特征参数:到达时间,幅度,振铃计数,能量,上升时间,上升计数,持续时间,RMS,ASL,峰值频率,质心频率,5个局部功率谱占比。 远程配置:远程配置参数、定时配置。 相关图:使用参数表中包含的2个声发射参数为横、纵坐标,画出相关曲线或者分布点图、线图等。 系统自动评级,云端远程查看评级结果。声发射数据采用自动分级算法,由声发射特征参数得到强度级别,活度级别,综合级别,灵活设置,可满足不同行业标准的评级需求。 报警推送:达到合适的报警条件主动推送报警信息,报警方式:邮箱、短信。 SWAE软件 SWAE声发射系统软件是实时采集分析和事后分析软件的集合,此外还可使用SWAE软件进行深度分析和处理以详细了解缺陷详细情况,如参数分析、定位分析、相关图分析、波形分析、快速傅里叶变换、小波变换等。 方案案例 1)高温压力容器声波(声发射)监测 ◆关键部位安装RAEM1,监测结构件损伤状态 ◆开启采集 ◆分析验证,得到判据标准 ◆验证效果良好,关闭波形和参数输出 ◆设置判据,输出得到手机平台推送信息 对某台球形高温压力容器,每4个月进行2个小时加压循环,检测数据结果如下表: 1号高温 压力容器 4个月 8个月 12个月 16个月 20个月 幅度(dB) 52 58 66 75 92 强度等级 低强度 低强度 中强度 中强度 高强度 活度等级 中活度 中活度 中活度 强活度 超强活度 综合等级 II II II III IV 按标准NBT 47013.9–2015-承压设备无损检测条款6评价结果与分级中的表2、表3、表5的声发射定位源的等级划分,确定a=60,b=80。得到各次检测的级别如上表。(幅度值取定位源中前5个最大的幅度的平均值,且已根据衰减测量结果加以修正) 第1、2、3次检测综合等级为II级;第4次检测综合等级为III级;第5次检测综合等级为IV级。 ①云平台: 用户可通过云平台进行远程配置、远程监控,把数据上传到云平台进行显示分析。 图1:1号高温压力容器1号通道(qc_raem1_4g_89),在第4、8、12、16、20个月的综合级别分别为:II,II,II,III,IV ②手机推送 到达报警界限,手机推送报警信息。报警方式:小程序、邮箱、短信、APP。 据云平台1号高温压力容器数据可知,2022年3月触碰3级报警线,2022年7月触碰4级报警线。手机同步收到报警推送。 ③SWAE软件 可云端数据下载后使用清诚的SWAE软件进行深度分析,也可以直接发送到SWAE软件进行实时分析处理。 1号高温压力容器在第3次监测时触碰3级报警线。通过清诚的SWAE软件,可查看数据并定位缺陷部位(仅限于选配了RAEM1无线定位功能或选用RAEM1–6系列的设备才可使用)。 实际案例 1)G50沪渝高速宜昌长江公路大桥钢板裂纹在线检测 图1 宜昌长江大桥 图2 传感器安装 图3 主机采集信号 图4 检测结果 G50沪渝高速宜昌长江公路大桥桥面钢板裂纹声波(声发射)在线监测 2)某化工厂球罐声发射检验 我司对某化工厂650m³球罐进行声发射检测,本次检测是在装置加压过程中进行声发射整体监测和数据采集,压力从 0MPa开始对被检容器进行数据采集,共进行1个加压循环。 图1加载程序图(P-T) 图2传感器分布图 本次检测共布置22个探头(分3层,上下层布置6个,中间层布置8个,上下极各一个,排列成三角网络形式进行局部监测),每个探头均采用RAEM1内置电池带无线同步的采集器,具体布置位置如图2所示。 备注:探头均匀分布,垂直间距4221mm,赤道层水平间距4221mm,上下层水平间距3979mm,1号探头位于铭牌支柱上方。 图3升压阶段事件定位图 图4 保压阶段事件定位图 经过数据分析,本次声发射检测共发现有意义信号源4个S1~S4,如图3。声发射数据定位图见图3~图4。对该声发射源综合等级评定如下表: 编号活性强度综合等级S1中活性低ⅡS2中活性低ⅡS3中活性低ⅡS4中活性低Ⅱ 该声发射源综合等级评定均为Ⅱ级,建议对该声发射源区进行其他常规检验方法的复验。 参考标准NB/T47013.9–2015《承压设备无损检测第9部分:声发射检测》。 优点:免布线,免供电,使用方便 3)金刚石合成过程钉锤开裂的声波(声发射)诊断 人工合成金刚石过程中,呈现正方体的芯料由六个钉锤施力加载,在某一个钉锤加载面收到破裂时,如不能及时停机,则六个钉锤会发生互相顶撞并全部报废的状况;之前由全人工进行人耳巡检,听到异响再跑过去停机,效率低且漏检率高,因此引入声发射在线监控技术,对压机合成过程实时监控对开裂信号发出报警,且引发合成压力机停机机制。 针对现场大幅值的噪声干扰,使用模拟和数字滤波器针对性的去燥,可有效提高检测动态范围;利用声发射独有的事件生成机制,利用空间滤波,可准确识别声源发生位置,并判断钉锤开裂信号。 4)禹城市绿健生物技术有限公司反应釜声发射检测 位于某公司公司磁力驱动反应釜于2011年4月制造,2011年8月投用,壳程介质为镍粉、葡萄糖。 检测实施前,根据检测技术要求,结合该罐具体情况编制了现场检测方案,并于2019年5月对该反应釜进行声发射检测。 通过内部水压填充,结合声发射对容器筒体和封头部位做检测,该容器平时最大工作压力为10.5Mpa,检测环节试验压力为11.6Mpa,经过一次加压循环,在最大工作压力和试验压力时做出声发射评价。 反应釜传感器布置示意图 经衰减测试,下底与上环缝之间可进行时差定位,共使用7个传感器,每个探头均采用RAEM1内置电池带无线同步的采集器,搅拌器法兰座一圈均布3个传感器4~5~6,等间距0.65米;上环缝均布3个传感器1~2~3,等间距1.67米;层间表面间距0.83米;上环缝到下底轴承座3.72米;4#传感器位于1#和2#传感器中线上。 反应釜升压阶段时差定位图 反应釜保压阶段时差定位图 对升压、保压环节声发射数据进行小振铃计数、长持续时间参数过滤后进行时差定位分析。 检验结论:发现一处声发射定位集中源区S1,其强度等级中强,活度等级中活,声发射综合等级为Ⅱ级,建议结合实际情况进行其它无损方法复验。 5)曲臂式高空作业平台声波(声发射)检测 曲臂式高空作业平台故障一般发生在玻璃钢(FRP),或发生金属悬臂的裂纹断裂、平台的失衡倾侧倒下等。 安装示意图 采集模块布置在曲臂式高空作业平台需要检测的部位,采集到的数据上传到云端,通过一定的算法判断出是否出现故障或隐患、判断故障严重程度和确定故障位置,把报警消息推送到客户端,避免重大事故的发生。 案例图 6)高温管线焊缝声波(声发射)监测方案 针对于容器上两道纵缝的监测,使用2个RAEM1单通道声波(声发射)监测模块,每套模块各包含一个用于裂纹检测的谐振为150KHz的高温传感器(350℃),一个宽带40dB放大器及一个采集器。 对所监测的每条焊缝中部位置进行局部保温层破拆,将声发射传感器贴合在焊缝附近并固定,通过同轴电缆将传感器、放大器和声发射采集器进行连接,此后可对保温层进行恢复,声发射采集器需要进行12V直流供电,可根据现场实际情况决定采集器安置位置。 传感器布置示意图 系统连接示意图 实现: · 对容器在运行状态下的缺陷产生和扩展进行全天候监控; · 利用缺陷产生的信号的发展趋势变化,对容器运行安全状态提供评估依据; · 基于大量运行数据的处理,设定容器的安全运行状态预警,当缺陷活性达到一定程度时自动报警; · 在容器过寿命运行时,根据缺陷信号发展评估容器安全状态,科学延长容器使用寿命。 以下是一些声发射仪的制造商: QAWRUMS Ltd. — 是中国研究声发射最早最专业,目前为中国声发射行业领军企业,提供声发射传感器、前置放大器、集成声波(声发射)检测仪,物联网声发射解决方案,适用于多种工业应用场景。 美国物理声学公司 (PAC) — 作为世界声发射技术的领导者,提供声发射传感器、前置放大器、通用声发射系统、专用声发射系统、声发射软件和辅件等。 清诚声发射 — 创始人源自清华教授,研究声发射领导的专家学者,是中国声发射学会会长,专业提供声发射检测和监测解决方案,包括声发射仪及相关配件。 北京软岛科技有限公司 — 专业从事声发射仪器的研发和销售,产品包括有线声发射系统、无线声发射系统和高速数据采集仪。 VALLEN Systeme — 国际声发射 (AE) 系统供应商,提供多通道系统、传感器、前置放大器、软件等。 这些制造商提供了多种声发射仪及相关产品,适用于不同的检测和监测需求。 |
| json metadata | {"tags":["ndt"],"image":["https://cdn.steemitimages.com/DQmPDXUNpMhRoa5qrLzKyEwD7TZdQubTQNnEdkBBftgUhWZ/structure-monitoring01.jpg","https://cdn.steemitimages.com/DQmUG5cZR8RykNLLDQN5PmZGUM9GgmiSrcDbp3GmRGwrCPX/structure-monitoring02.jpg","https://cdn.steemitimages.com/DQmPKsqbLfHMMB5WvaUAei2tLYtRBvgt9Lxw7tgLnCuvyoH/structure-monitoring04.jpg"],"app":"steemit/0.2","format":"markdown"} |
| parent author | |
| parent permlink | ndt |
| permlink | cknef |
| title | 结构件损伤声发射监测检测 |
| Transaction Info | Block #89555377/Trx 0b2c1223d5f191e6a33ab9fbec7703c8e7b17187 |
View Raw JSON Data
{
"block": 89555377,
"op": [
"comment",
{
"author": "barrylee",
"body": "应用介绍\n材料在应力作用下的变形与裂纹扩展,是结构失效的重要机制。声波(声发射)无损检测技术,可以推断损伤情况和发展规律,对结构件损伤发生和发展趋势做出预测。\n\n\n\n\n\n\n\n\n原理\n结构材料中的裂纹、形变、脱粘分层等损伤过程常伴有声波(声发射)信号产生,接收分析这个声波并判断损伤程度和位置,对结构件完整性做出健康评价,用户能够及时对结构件早期损伤进行维修,延长结构件的寿命。\n\n\n\n\n\n过程可视化\n365天在线声发射监测检测,全过程自动分析结果,物联网远程操作使用。\n\n自动给出检测监测诊断结果;\n在线和历史数据屏幕显示;\n报警信息主动推送。\n结果\n实现了各种材料的结构件损伤声波(声发射)监测检测,并把损伤等级推送给用户。用户可根据等级及时开展对应维修,以延长结构件寿命,杜绝设备因结构件失效导致的事故和损失。\n\n在线 — — 声波(声发射)采集器安装在被监测诊断的对象上,实现全时段全天候状态监测故障诊断。\n智能 — — 自动给出监测诊断结果,不需要人工分析处理数据,不需要人工操作,数据采集分析报告展示整个监测诊断全过程自动进行。\n远程 — — 借助物联网系统,用户可以在任何位置得到任意不限距离位置的监测诊断点的监测诊断结果,在线即时结果和历史过程结果。\n适用范围\n适用于各种材料设备(如桥梁、风电、刀具、储罐、作业平台等设备)的结构件损伤监测。例如:桥梁大坝等金属非金属结构的裂纹开裂,石油化工设备压力容器等金属结构的裂纹开裂,阀门管道等结构的裂纹开裂,发电机、车床等转动设备结构的裂纹开裂等。\n\n\n\n\n\n解决方案\nRAEM1系列远程声波(声发射)监测系统\n原理:结构件在长期服役过程中,通常会受到复杂载荷的作用,令其内部或表面产生裂纹,进而产生声波(声发射)信号,信号沿表面传播,被安装在悬臂梁上的声发射传感器接收,RAEM1分析处理信号,通过RAEM1内置的通讯模块将数据发送至云端服务器,云平台远程监测结构件实时状况。\n\n\n系统组成通讯方式声发射传感器、RAEM1声波(声发射)检测仪、云服务器、客户端4G、WiFi、网口\n\nRAEM1–6系列远程声波(声发射)监测系统\n原理:结构件在长期服役过程中,通常会受到复杂载荷的作用,令其内部或表面产生裂纹,进而产生声波(声发射)信号,信号沿表面传播,被安装在悬臂梁上的声发射传感器接收,RAEM1–6分析处理信号,通过RAEM1–6内置的通讯模块将数据发送至云端服务器,云平台远程监测结构件实时状况。\n\n\n系统组成通讯方式声发射传感器、RAEM1–6声波(声发射)检测仪、云服务器、客户端4G、WiFi、网口\n\n流程\na)关键部位安装设备,检测监测结构件损伤状态;\nb)分析验证,得到判据标准;\nc)合理配置参数、评级参数;\nd)开启监测,达到报警界限,手机、云平台推送报警信息。\n\n设备介绍\n智能采集器\n\n\n\n名称RAEM1–6声波(声发射)检测仪RAEM1声波(声发射)检测仪采样频率单个通道最大采样率2M点/秒单个通道最大采样率2M点/秒采样精度16位16位通道数单通道、6通道或级联使用单通道或多通道组合使用输入带宽10KHz-800KHz10KHz-800KHz系统噪声优于30dB优于30dB动态范围70dB70dB模拟滤波器30kHz、125kHz两个高通滤波器,80kHz、175kHz两个低通滤波器组合,默认30kHz~80kHz,125kHz~175kHz两种带通滤波器组合,出厂固定30kHz、125kHz两个高通滤波器,80kHz、175kHz两个低通滤波器组合,默认30kHz~80kHz,125kHz~175kHz两种带通滤波器组合,出厂固定数字滤波器0kHz~1000kHz频率范围内任意数值设置直通、高通、低通、带通(结合模拟滤波器使用)256阶的FIR滤波器,0kHz~1000kHz频率范围内任意数值设置直通、高通、低通、带通传感器内置前放系列传感器,三种内置前放可选:28V40dB,12V34dB,5V26dB内置前放系列传感器,三种内置前放可选:28V40dB,12V34dB,5V26dB数据输出波形、参数、参数评级波形、参数、参数评级AE特征参数参数到达时间,幅度,振铃计数,能量,上升时间,上升计数,持续时间,RMS,ASL,峰值频率,质心频率,5个局部功率谱占比到达时间,幅度,振铃计数,能量,上升时间,上升计数,持续时间,RMS,ASL,峰值频率,质心频率,5个局部功率谱占比内置SD卡容量64G(可拓展至512G)64G(可拓展至512G)通讯方式4G、网口、WiFi4G、网口、WiFi、RS485供电12VDC12VDC尺寸长×宽×高:22cm×13cm×8cm圆筒直径φ62mm,高度 100mm重量1.6kg220g安装/底部自带磁性,可吸附于被测物体表面防护等级/IP65工作温度-20℃~60℃(WiFi版本为0℃~60℃)-20℃~60℃(WiFi版本为0℃~60℃)优势基于Linus操作系统,性能稳定,具有无线通信能力,适合长时间远程无人值守监控,设备可级联组成大型监测系统。集信号采集、信号分析、通讯数据输出于一体的智能声发射采集器,其底部带磁性,安装时可将设备直接与金属物体耦合。\n\n台式声波(声发射)检测仪\n\n\n名称SAEU3H集成声波(声发射)检测仪采样频率单个通道最大采样率10M点/秒,采样率连续可调,每个通道可独立设置采样精度16位数据通过率单个USB3.0接口连接通过率最大高于300MB/秒,两个独立USB3.0接口连接通过率最大高于600MB/秒连续波形采集10M/s采样率16位精度15通道连续波形连续采集大通道数特征参数采集10M/s采样率16位精度128通道特征参数数据采集及存储不丢失采集卡通道数每个采集卡具有4个独立通道采集卡内存容量1Gb每张采集卡采集机箱4通道、20通道、48通道三种基本型号机箱通道扩展多机箱可级联组成128通道声发射系统,每个机箱亦可作为独立主机使用声发射信号处理每个采集卡硬件均具有AE特征参数实时提取功能,通道可独立设置波形采样长度最大单个波形采样长度,每通道可同时达128k采样点,通道可独立设置波形前采功能触发前预采集长度可达128k采样点,通道可独立设置AE信号输入范围±10V,可向下调整信号输入电压范围至±5V,±2V,±1V,±0.1V,通道可独立设置响应频率1kHz-2.5MHz(-3dB带宽)模拟滤波器20kHz、100kHz、400kHz三个高通滤波器,100kHz、400kHz、1200kHz三个低通滤波器,通过软件选择各种组合,可逐个通道独立设置硬件实时数字滤波器1kHz-2MHz频率范围内任意数值设置直通、高通、低通、带通及带阻。主机噪声﹤15dB(空载)动态范围85dB最大信号幅度100dB(使用40dB前放,对应传感器输出为100毫伏)输入阻抗50ΩAE特征参数过门限到达时间、峰值到达时间、幅度、振铃计数、持续时间、相对能量、绝对能量、信号强度、上升计数、上升时间、有效值RMS、平均值ASL、起始相位、12个外参、质心频率、峰值频率、5个局部功率谱、质心频率、原始频率、回荡频率、平均频率外参采集仪器标配8个模拟外参数输入通道,最多可扩展至96个外参通道,外参总采样率达到每秒1M采样点,采样精度16位,外参输入范围±10V,可通过软件变换为信号源的物理单位报警输出主机以开关、灯方式输出报警控制信号机箱尺寸4通道机箱:320mm×125mm×50mm;(长×宽×高);\n20通道机箱:308mm×225mm×133mm;(长×宽×高);\n48通道机箱:308mm×368mm×133mm;(长×宽×高)工作温度10℃~﹢45℃\n\n声发射传感器\n\n\n\n名称GI150窄频带内置前放一体化GI40窄频带内置前放一体化谐振频率150KHz40KHz频率范围60KHz~400KHz15KHz~70KHz灵敏度>75dB>75dB前置放大器40dB28V40dB28V接口类型BNCBNC防护等级IP62IP62使用温度-20℃~50℃-20℃~50℃尺寸(mm)Ф30×36.5Ф30×57\n\n清诚云\n数据上传到云端物联网平台(清诚云)显示分析。AE特征参数:到达时间,幅度,振铃计数,能量,上升时间,上升计数,持续时间,RMS,ASL,峰值频率,质心频率,5个局部功率谱占比。\n\n\n远程配置:远程配置参数、定时配置。\n\n\n相关图:使用参数表中包含的2个声发射参数为横、纵坐标,画出相关曲线或者分布点图、线图等。\n\n\n系统自动评级,云端远程查看评级结果。声发射数据采用自动分级算法,由声发射特征参数得到强度级别,活度级别,综合级别,灵活设置,可满足不同行业标准的评级需求。\n\n\n报警推送:达到合适的报警条件主动推送报警信息,报警方式:邮箱、短信。\n\n\nSWAE软件\nSWAE声发射系统软件是实时采集分析和事后分析软件的集合,此外还可使用SWAE软件进行深度分析和处理以详细了解缺陷详细情况,如参数分析、定位分析、相关图分析、波形分析、快速傅里叶变换、小波变换等。\n\n\n方案案例\n1)高温压力容器声波(声发射)监测\n\n\n◆关键部位安装RAEM1,监测结构件损伤状态\n◆开启采集\n◆分析验证,得到判据标准\n◆验证效果良好,关闭波形和参数输出\n◆设置判据,输出得到手机平台推送信息\n\n对某台球形高温压力容器,每4个月进行2个小时加压循环,检测数据结果如下表:\n\n1号高温\n压力容器\n\n4个月\n\n8个月\n\n12个月\n\n16个月\n\n20个月\n\n幅度(dB)\n\n52\n\n58\n\n66\n\n75\n\n92\n\n强度等级\n\n低强度\n\n低强度\n\n中强度\n\n中强度\n\n高强度\n\n活度等级\n\n中活度\n\n中活度\n\n中活度\n\n强活度\n\n超强活度\n\n综合等级\n\nII\n\nII\n\nII\n\nIII\n\nIV\n\n按标准NBT 47013.9–2015-承压设备无损检测条款6评价结果与分级中的表2、表3、表5的声发射定位源的等级划分,确定a=60,b=80。得到各次检测的级别如上表。(幅度值取定位源中前5个最大的幅度的平均值,且已根据衰减测量结果加以修正)\n第1、2、3次检测综合等级为II级;第4次检测综合等级为III级;第5次检测综合等级为IV级。\n\n①云平台:\n用户可通过云平台进行远程配置、远程监控,把数据上传到云平台进行显示分析。\n\n图1:1号高温压力容器1号通道(qc_raem1_4g_89),在第4、8、12、16、20个月的综合级别分别为:II,II,II,III,IV\n\n\n②手机推送\n到达报警界限,手机推送报警信息。报警方式:小程序、邮箱、短信、APP。\n据云平台1号高温压力容器数据可知,2022年3月触碰3级报警线,2022年7月触碰4级报警线。手机同步收到报警推送。\n\n\n③SWAE软件\n可云端数据下载后使用清诚的SWAE软件进行深度分析,也可以直接发送到SWAE软件进行实时分析处理。\n1号高温压力容器在第3次监测时触碰3级报警线。通过清诚的SWAE软件,可查看数据并定位缺陷部位(仅限于选配了RAEM1无线定位功能或选用RAEM1–6系列的设备才可使用)。\n\n实际案例\n1)G50沪渝高速宜昌长江公路大桥钢板裂纹在线检测\n\n\n图1 宜昌长江大桥\n\n\n图2 传感器安装\n\n\n图3 主机采集信号\n\n\n图4 检测结果\n\nG50沪渝高速宜昌长江公路大桥桥面钢板裂纹声波(声发射)在线监测\n\n2)某化工厂球罐声发射检验\n\n我司对某化工厂650m³球罐进行声发射检测,本次检测是在装置加压过程中进行声发射整体监测和数据采集,压力从 0MPa开始对被检容器进行数据采集,共进行1个加压循环。\n\n\n图1加载程序图(P-T)\n\n\n图2传感器分布图\n\n本次检测共布置22个探头(分3层,上下层布置6个,中间层布置8个,上下极各一个,排列成三角网络形式进行局部监测),每个探头均采用RAEM1内置电池带无线同步的采集器,具体布置位置如图2所示。\n备注:探头均匀分布,垂直间距4221mm,赤道层水平间距4221mm,上下层水平间距3979mm,1号探头位于铭牌支柱上方。\n\n\n图3升压阶段事件定位图\n\n\n图4 保压阶段事件定位图\n\n经过数据分析,本次声发射检测共发现有意义信号源4个S1~S4,如图3。声发射数据定位图见图3~图4。对该声发射源综合等级评定如下表:\n\n编号活性强度综合等级S1中活性低ⅡS2中活性低ⅡS3中活性低ⅡS4中活性低Ⅱ\n\n该声发射源综合等级评定均为Ⅱ级,建议对该声发射源区进行其他常规检验方法的复验。\n参考标准NB/T47013.9–2015《承压设备无损检测第9部分:声发射检测》。\n\n优点:免布线,免供电,使用方便\n\n3)金刚石合成过程钉锤开裂的声波(声发射)诊断\n\n\n人工合成金刚石过程中,呈现正方体的芯料由六个钉锤施力加载,在某一个钉锤加载面收到破裂时,如不能及时停机,则六个钉锤会发生互相顶撞并全部报废的状况;之前由全人工进行人耳巡检,听到异响再跑过去停机,效率低且漏检率高,因此引入声发射在线监控技术,对压机合成过程实时监控对开裂信号发出报警,且引发合成压力机停机机制。\n针对现场大幅值的噪声干扰,使用模拟和数字滤波器针对性的去燥,可有效提高检测动态范围;利用声发射独有的事件生成机制,利用空间滤波,可准确识别声源发生位置,并判断钉锤开裂信号。\n\n4)禹城市绿健生物技术有限公司反应釜声发射检测\n\n位于某公司公司磁力驱动反应釜于2011年4月制造,2011年8月投用,壳程介质为镍粉、葡萄糖。\n检测实施前,根据检测技术要求,结合该罐具体情况编制了现场检测方案,并于2019年5月对该反应釜进行声发射检测。\n通过内部水压填充,结合声发射对容器筒体和封头部位做检测,该容器平时最大工作压力为10.5Mpa,检测环节试验压力为11.6Mpa,经过一次加压循环,在最大工作压力和试验压力时做出声发射评价。\n\n\n反应釜传感器布置示意图\n\n经衰减测试,下底与上环缝之间可进行时差定位,共使用7个传感器,每个探头均采用RAEM1内置电池带无线同步的采集器,搅拌器法兰座一圈均布3个传感器4~5~6,等间距0.65米;上环缝均布3个传感器1~2~3,等间距1.67米;层间表面间距0.83米;上环缝到下底轴承座3.72米;4#传感器位于1#和2#传感器中线上。\n\n\n反应釜升压阶段时差定位图\n\n\n反应釜保压阶段时差定位图\n\n对升压、保压环节声发射数据进行小振铃计数、长持续时间参数过滤后进行时差定位分析。\n检验结论:发现一处声发射定位集中源区S1,其强度等级中强,活度等级中活,声发射综合等级为Ⅱ级,建议结合实际情况进行其它无损方法复验。\n\n5)曲臂式高空作业平台声波(声发射)检测\n\n曲臂式高空作业平台故障一般发生在玻璃钢(FRP),或发生金属悬臂的裂纹断裂、平台的失衡倾侧倒下等。\n\n\n安装示意图\n\n采集模块布置在曲臂式高空作业平台需要检测的部位,采集到的数据上传到云端,通过一定的算法判断出是否出现故障或隐患、判断故障严重程度和确定故障位置,把报警消息推送到客户端,避免重大事故的发生。\n\n\n案例图\n\n6)高温管线焊缝声波(声发射)监测方案\n\n针对于容器上两道纵缝的监测,使用2个RAEM1单通道声波(声发射)监测模块,每套模块各包含一个用于裂纹检测的谐振为150KHz的高温传感器(350℃),一个宽带40dB放大器及一个采集器。\n对所监测的每条焊缝中部位置进行局部保温层破拆,将声发射传感器贴合在焊缝附近并固定,通过同轴电缆将传感器、放大器和声发射采集器进行连接,此后可对保温层进行恢复,声发射采集器需要进行12V直流供电,可根据现场实际情况决定采集器安置位置。\n\n\n传感器布置示意图\n\n\n系统连接示意图\n\n实现:\n· 对容器在运行状态下的缺陷产生和扩展进行全天候监控;\n· 利用缺陷产生的信号的发展趋势变化,对容器运行安全状态提供评估依据;\n· 基于大量运行数据的处理,设定容器的安全运行状态预警,当缺陷活性达到一定程度时自动报警;\n· 在容器过寿命运行时,根据缺陷信号发展评估容器安全状态,科学延长容器使用寿命。\n\n以下是一些声发射仪的制造商:\n\nQAWRUMS Ltd. — 是中国研究声发射最早最专业,目前为中国声发射行业领军企业,提供声发射传感器、前置放大器、集成声波(声发射)检测仪,物联网声发射解决方案,适用于多种工业应用场景。\n美国物理声学公司 (PAC) — 作为世界声发射技术的领导者,提供声发射传感器、前置放大器、通用声发射系统、专用声发射系统、声发射软件和辅件等。\n清诚声发射 — 创始人源自清华教授,研究声发射领导的专家学者,是中国声发射学会会长,专业提供声发射检测和监测解决方案,包括声发射仪及相关配件。\n北京软岛科技有限公司 — 专业从事声发射仪器的研发和销售,产品包括有线声发射系统、无线声发射系统和高速数据采集仪。\nVALLEN Systeme — 国际声发射 (AE) 系统供应商,提供多通道系统、传感器、前置放大器、软件等。\n这些制造商提供了多种声发射仪及相关产品,适用于不同的检测和监测需求。",
"json_metadata": "{\"tags\":[\"ndt\"],\"image\":[\"https://cdn.steemitimages.com/DQmPDXUNpMhRoa5qrLzKyEwD7TZdQubTQNnEdkBBftgUhWZ/structure-monitoring01.jpg\",\"https://cdn.steemitimages.com/DQmUG5cZR8RykNLLDQN5PmZGUM9GgmiSrcDbp3GmRGwrCPX/structure-monitoring02.jpg\",\"https://cdn.steemitimages.com/DQmPKsqbLfHMMB5WvaUAei2tLYtRBvgt9Lxw7tgLnCuvyoH/structure-monitoring04.jpg\"],\"app\":\"steemit/0.2\",\"format\":\"markdown\"}",
"parent_author": "",
"parent_permlink": "ndt",
"permlink": "cknef",
"title": "结构件损伤声发射监测检测"
}
],
"op_in_trx": 0,
"timestamp": "2024-10-17T10:30:54",
"trx_id": "0b2c1223d5f191e6a33ab9fbec7703c8e7b17187",
"trx_in_block": 2,
"virtual_op": 0
}2024/10/12 10:13:03
2024/10/12 10:13:03
| author | barrylee |
| body | # Embracing the Future of Bridge Engineering: Qawrums Ltd at the 2nd National Conference on Intelligent Bridge Construction and Operations Innovation As the world navigates the complexities of climate change and urbanization, the engineering sector faces unprecedented challenges and exciting opportunities. Among these is the need for innovative, sustainable approaches to infrastructure development, particularly in bridge engineering. In response, we are thrilled to announce that Qawrums Ltd will be participating in the upcoming 2nd National Conference on Intelligent Bridge Construction and Operations Innovation, scheduled for December 6-8, 2024, in Quanzhou, Fujian. ## A Gathering of Minds This important conference is co-hosted by the esteemed Fujian University of Technology, Quanzhou Transportation Development Group Co., Ltd., and the Bridge Engineering and Technology Network. It brings together prominent experts, scholars, and engineering professionals from across the bridge construction sector. The event aims to facilitate discussions and knowledge exchange on the latest advancements and best practices in the industry. ## Thematic Focus The conference will explore three critical themes: **Low Carbon, Innovation, and Development**. 1. **Low Carbon**: With growing global concern over carbon emissions, the need for eco-friendly construction practices has never been more urgent. The conference will delve into strategies for reducing carbon footprints in bridge construction and maintenance, emphasizing materials, techniques, and technologies that support sustainability. 2. **Innovation**: The bridge engineering field is ripe for innovation. From intelligent construction technologies and automation to advanced materials and design methodologies, this conference will serve as a platform for sharing cutting-edge ideas and solutions that can revolutionize how we approach bridge projects. 3. **Development**: As infrastructure continues to evolve, so too must our strategies for development. Discussions will encompass the integration of new technologies, the importance of smart infrastructure, and the role of collaboration among stakeholders to ensure the successful delivery and operation of modern bridge systems. ## Join Us We invite you to join us at this landmark event. At Qawrums Ltd, we believe in the power of collaboration and knowledge sharing to drive progress in the bridge engineering industry. This conference is a perfect opportunity for networking, learning, and exploring partnerships that can lead to innovation and sustainable development in bridge construction and maintenance. ### Conclusion As we prepare for the 2nd National Conference on Intelligent Bridge Construction and Operations Innovation, we are filled with anticipation and excitement about the opportunities that lie ahead. We look forward to engaging with fellow professionals, sharing insights, and contributing to the ongoing evolution of our field. Together, let’s embrace the future of bridge engineering—rooted in sustainability, innovation, and collaboration. We hope to see you there! --- For more information about the conference and registration details, please visit [link to conference website]. #BridgeEngineering #Sustainability #Innovation #Qawrums #Conference2024 |
| json metadata | {"tags":["bridge","bridgeengineering","sustainability","innovation","qawrums","conference2024"],"app":"steemit/0.2","format":"markdown"} |
| parent author | |
| parent permlink | bridge |
| permlink | qawrums-ltd-heads-to-quanzhou-embracing-innovation-at-the-2nd-national-conference-on-intelligent-bridge-construction-and |
| title | Qawrums Ltd. Heads to Quanzhou: Embracing Innovation at the 2nd National Conference on Intelligent Bridge Construction and Operations |
| Transaction Info | Block #89411834/Trx dcecf4fe2a35956cabf0014d6370db5f4bf2f96e |
View Raw JSON Data
{
  "block": 89411834,
  "op": [
    "comment",
    {
      "author": "barrylee",
      "body": "# Embracing the Future of Bridge Engineering: Qawrums Ltd at the 2nd National Conference on Intelligent Bridge Construction and Operations Innovation\n\nAs the world navigates the complexities of climate change and urbanization, the engineering sector faces unprecedented challenges and exciting opportunities. Among these is the need for innovative, sustainable approaches to infrastructure development, particularly in bridge engineering. In response, we are thrilled to announce that Qawrums Ltd will be participating in the upcoming 2nd National Conference on Intelligent Bridge Construction and Operations Innovation, scheduled for December 6-8, 2024, in Quanzhou, Fujian.\n\n## A Gathering of Minds\n\nThis important conference is co-hosted by the esteemed Fujian University of Technology, Quanzhou Transportation Development Group Co., Ltd., and the Bridge Engineering and Technology Network. It brings together prominent experts, scholars, and engineering professionals from across the bridge construction sector. The event aims to facilitate discussions and knowledge exchange on the latest advancements and best practices in the industry.\n\n## Thematic Focus\n\nThe conference will explore three critical themes: **Low Carbon, Innovation, and Development**. \n\n1. **Low Carbon**: With growing global concern over carbon emissions, the need for eco-friendly construction practices has never been more urgent. The conference will delve into strategies for reducing carbon footprints in bridge construction and maintenance, emphasizing materials, techniques, and technologies that support sustainability.\n\n2. **Innovation**: The bridge engineering field is ripe for innovation. From intelligent construction technologies and automation to advanced materials and design methodologies, this conference will serve as a platform for sharing cutting-edge ideas and solutions that can revolutionize how we approach bridge projects.\n\n3. **Development**: As infrastructure continues to evolve, so too must our strategies for development. Discussions will encompass the integration of new technologies, the importance of smart infrastructure, and the role of collaboration among stakeholders to ensure the successful delivery and operation of modern bridge systems.\n\n## Join Us\n\nWe invite you to join us at this landmark event. At Qawrums Ltd, we believe in the power of collaboration and knowledge sharing to drive progress in the bridge engineering industry. This conference is a perfect opportunity for networking, learning, and exploring partnerships that can lead to innovation and sustainable development in bridge construction and maintenance.\n\n### Conclusion\n\nAs we prepare for the 2nd National Conference on Intelligent Bridge Construction and Operations Innovation, we are filled with anticipation and excitement about the opportunities that lie ahead. We look forward to engaging with fellow professionals, sharing insights, and contributing to the ongoing evolution of our field.\n\nTogether, let’s embrace the future of bridge engineering—rooted in sustainability, innovation, and collaboration. We hope to see you there!\n\n---\n\nFor more information about the conference and registration details, please visit [link to conference website]. \n\n#BridgeEngineering #Sustainability #Innovation #Qawrums #Conference2024",
      "json_metadata": "{\"tags\":[\"bridge\",\"bridgeengineering\",\"sustainability\",\"innovation\",\"qawrums\",\"conference2024\"],\"app\":\"steemit/0.2\",\"format\":\"markdown\"}",
      "parent_author": "",
      "parent_permlink": "bridge",
      "permlink": "qawrums-ltd-heads-to-quanzhou-embracing-innovation-at-the-2nd-national-conference-on-intelligent-bridge-construction-and",
      "title": "Qawrums Ltd. Heads to Quanzhou: Embracing Innovation at the 2nd National Conference on Intelligent Bridge Construction and Operations"
    }
  ],
  "op_in_trx": 0,
  "timestamp": "2024-10-12T10:13:03",
  "trx_id": "dcecf4fe2a35956cabf0014d6370db5f4bf2f96e",
  "trx_in_block": 1,
  "virtual_op": 0
}barryleepublished a new post: 16th-slope-engineering-technology-conference-from-october-21-24-20242024/10/11 09:22:15
barryleepublished a new post: 16th-slope-engineering-technology-conference-from-october-21-24-2024
2024/10/11 09:22:15
| author | barrylee |
| body | 16th Slope Engineering Technology Conference from October 21–24, 2024 Exciting News! We are thrilled to announce that Qawrums Ltd will be participating in the 16th Slope Engineering Technology Conference from October 21–24, 2024, at the Beijing Jingyuan Holiday Hotel. <a href="https://ae-ndt.com/news/event/" target="_blank">https://ae-ndt.com/news/event/</a>  This prestigious event aims to facilitate the exchange and discussion of slope engineering technology, focusing on both theoretical insights and practical experiences. Our participation underscores our commitment to advancing slope engineering towards a greener, safer, and more digital future. Join us as we connect with industry leaders and explore innovative solutions in slope engineering! Stay tuned for updates and insights from the conference! #QawrumsLtd #SlopeEngineering #Conference2024 #Innovation #Sustainability |
| json metadata | {"tags":["slope","qawrumsltd","slopeengineering","conference2024","innovation","sustainability"],"image":["https://cdn.steemitimages.com/DQmTZnoz2ictL6x8y2kKUdS3L4f2r15YZVW21SnAgvYGiHK/footer2.jpg"],"links":["https://ae-ndt.com/news/event/"],"app":"steemit/0.2","format":"markdown"} |
| parent author | |
| parent permlink | slope |
| permlink | 16th-slope-engineering-technology-conference-from-october-21-24-2024 |
| title | 16th Slope Engineering Technology Conference from October 21–24, 2024 |
| Transaction Info | Block #89382122/Trx 0a82f679809d230c425c6835674d3d8d5131f16b |
View Raw JSON Data
{
"block": 89382122,
"op": [
"comment",
{
"author": "barrylee",
"body": "16th Slope Engineering Technology Conference from October 21–24, 2024\n\nExciting News!\n\nWe are thrilled to announce that Qawrums Ltd will be participating in the 16th Slope Engineering Technology Conference from October 21–24, 2024, at the Beijing Jingyuan Holiday Hotel.\n\n<a href=\"https://ae-ndt.com/news/event/\" target=\"_blank\">https://ae-ndt.com/news/event/</a>\n\n\n\n\n\nThis prestigious event aims to facilitate the exchange and discussion of slope engineering technology, focusing on both theoretical insights and practical experiences. Our participation underscores our commitment to advancing slope engineering towards a greener, safer, and more digital future.\n\nJoin us as we connect with industry leaders and explore innovative solutions in slope engineering!\n\nStay tuned for updates and insights from the conference!\n\n#QawrumsLtd #SlopeEngineering #Conference2024 #Innovation #Sustainability",
"json_metadata": "{\"tags\":[\"slope\",\"qawrumsltd\",\"slopeengineering\",\"conference2024\",\"innovation\",\"sustainability\"],\"image\":[\"https://cdn.steemitimages.com/DQmTZnoz2ictL6x8y2kKUdS3L4f2r15YZVW21SnAgvYGiHK/footer2.jpg\"],\"links\":[\"https://ae-ndt.com/news/event/\"],\"app\":\"steemit/0.2\",\"format\":\"markdown\"}",
"parent_author": "",
"parent_permlink": "slope",
"permlink": "16th-slope-engineering-technology-conference-from-october-21-24-2024",
"title": "16th Slope Engineering Technology Conference from October 21–24, 2024"
}
],
"op_in_trx": 0,
"timestamp": "2024-10-11T09:22:15",
"trx_id": "0a82f679809d230c425c6835674d3d8d5131f16b",
"trx_in_block": 1,
"virtual_op": 0
}barryleepublished a new post: acoustic-emission-testing-an-in-depth-guide-from-qawrums2024/10/09 08:45:21
barryleepublished a new post: acoustic-emission-testing-an-in-depth-guide-from-qawrums
2024/10/09 08:45:21
| author | barrylee |
| body | Table of Contents What Is Acoustic Emission Testing? Acoustic Emission Testing vs. Ultrasonic Testing Acoustic Emission Testing Tools Types of Acoustic Emission Testing When Is Acoustic Emission Testing Required? The Top 5 Industries that Rely on Acoustic Emission Testing + Specific Applications They Use Best Practices for Acoustic Emission Testing Notable Manufacturers of Acoustic Emission Testing Equipment Acoustic Emission Testing Acoustic Emission Testing (AET) is an NDT method that monitors the release of energy in the form of transient elastic waves — also known as acoustic emissions — from materials under stress in order to detect flaws in them for inspection purposes. Alternate phrases for AET include: Acoustic testing Acoustic monitoring Acoustic analysis Acoustic signal detection Acoustic emission analysis Acoustic emission testing is particularly effective for identifying and evaluating defects during inspections, including: Crack formations Corrosion Fiber breakage in composites AET is used extensively in industries where maintaining the integrity and safety of critical components is essential, including aerospace, civil engineering, power generation, and manufacturing. This article provides an in-depth overview of acoustic emission testing, exploring the tools and techniques used, the various types of AET methods, and the inspection scenarios where it’s most useful. What Is Acoustic Emission Testing? Acoustic emission testing detects and analyzes the high-frequency acoustic waves emitted by materials when they undergo deformation or stress. Acoustic emissions are generated by various defects, including crack formation, plastic deformation, and phase transformations, providing valuable information about the integrity and behavior of the material under load. This information is crucial for identifying defects in assets, helping inspectors find potential issues before they develop into severe problems. And its usefulness isn’t limited to just a few industries. The list of materials for which AET can be used includes metal, concrete, or ceramics, alloys, composites, and many others, so almost any industry can benefit from its ability to detect the early stages of defect formation and monitor damage progression in real-time. Principles of Acoustic Emissions Testing The fundamental principle of AET is based on the detection and analysis of transient elastic waves produced by the rapid release of energy from localized sources within a material. Put simply, inspectors monitor acoustic waves in a material then analyze them to identify anomalies, indicating the possible presence of a flaw. These waves could be present on their own (i.e., passive acoustic testing, which requires no intervention) or could be introduced by stressing a material (i.e., active acoustic testing, which requires an intervention from the inspector to create acoustic waves). Below is a short step-by-step for acoustic emission testing, following the active model. (Note that for passive acoustic testing the process would start at step three, when inspectors use sensors to begin detecting acoustic.) 1. Stress Application Inspectors stress the material they’re inspecting using means like mechanical loading or thermal cycling. 2. Wave Generation As the material undergoes stress it deforms, emitting acoustic waves due to processes like crack initiation, crack growth, fiber breakage, or corrosion. 3. Wave Detection Inspectors attach sensors, typically piezoelectric transducers, to the material’s surface to detect acoustic waves. These sensors convert mechanical waves into electrical signals, which can be interpreted to identify the presence of defects. 4. Signal Processing Inspectors amplify the converted electrical signals, filtering and processing them to extract meaningful information — i.e., where is there a potential defect? and what is the nature of the defect? — about the source and characteristics of the acoustic emissions. 5. Data Analysis Inspectors process the data then analyze it to identify the type, location, and severity of defects, allowing them to conduct real-time monitoring and assessments of the material’s condition. Advantages of Acoustic Emissions Testing Real-time monitoring. AET provides continuous, real-time monitoring of materials and structures, enabling early detection of defects and damage progression. Sensitivity. AET is highly sensitive to the initiation and growth of defects, often detecting flaws that are not visible using other NDT methods. Non-invasive. The technique is non-invasive and doesn’t require contact with the internal structure of the material, making it suitable for a wide range of applications. Broad applicability. AET can be used for several types of materials, including metals, composites, ceramics, and polymers. Limitations of Acoustic Emissions Testing Complex interpretation. You need special training to do AET — the interpretation of acoustic emission signals requires skilled operators with extensive training and experience. Environmental noise. Background noise and environmental factors can interfere with the detection of acoustic emissions, potentially impacting the accuracy of the test. (As noted above, this method is highly sensitive!) Limited range. The effectiveness of AET decreases with distance from the source of the acoustic emission, requiring strategic placement of sensors for comprehensive coverage. Material dependency. The type of material you’re using for acoustic testing matters — quality of results can vary depending on the material properties and the type of defects you’re monitoring. Acoustic Emission Testing vs. Ultrasonic Testing Acoustic Emission Testing (AET) and Ultrasonic Testing (UT) are both valuable non-destructive testing (NDT) methods used to assess the integrity of materials and structures. Despite their similarities, these techniques differ significantly in their principles, applications, and advantages. Understanding these differences helps in selecting the appropriate method for your specific inspection needs. Acoustic Emission Testing (AET) How it works. AET monitors the release of transient elastic waves (acoustic emissions) generated by the rapid release of energy from localized sources within a material under stress. Sensors placed on the material’s surface detect these emissions, which are then analyzed to locate and characterize defects such as cracks and delaminations. Detection mechanism. AET can be passive or active, either relying on the material itself to generate signals when it experiences stress or introducing stress, which then leads to changes in acoustic waves, allowing inspectors to identify issues like material deformation or crack propagation. Ultrasonic Testing (UT) How it works. UT uses high-frequency sound waves that are introduced into the material via a transducer. These sound waves travel through the material and reflect off internal features such as flaws or boundaries. The reflected waves are detected by the transducer or another sensor, and the amplitude of the echoes and other data are analyzed to determine the location, size, and nature of internal defects. Detection mechanism. UT is active, requiring an external source to generate ultrasonic waves that are then transmitted into the material. Choosing Between AET and UT The choice between Acoustic Emission Testing and Ultrasonic Testing depends on the specific requirements of the inspection task. AET is ideal for real-time monitoring and detecting active damage, making it suitable for long-term structural health monitoring. UT, on the other hand, is preferred for detailed flaw detection, thickness measurements, and applications where precise quantitative data is required. Acoustic Emission Testing Tools Inspectors use a huge range of specialized tools and equipment for acoustic monitoring. These tools are designed to detect, amplify, and analyze the acoustic waves generated by materials under stress. Below are the most common types of acoustic emission testing tools. We’ve organized these tools into seven categories, with specific types listed for each one (some categories only have one type). 1. AET Sensors I. Piezoelectric transducers are AET sensors that convert mechanical waves into electrical signals. How they work. When an acoustic wave reaches the piezoelectric transducer, it generates an electrical signal proportional to the wave’s amplitude and frequency. Applications. These sensors are widely used in AET for detecting a wide range of acoustic emissions from various materials and structures. II. Fiber optic sensors are AET sensors that use optical fibers to detect acoustic emissions. How they work. Acoustic waves cause slight changes in the optical fiber’s properties, which are detected and converted into electrical signals. Applications. Used in environments where electromagnetic interference might affect piezoelectric sensors, such as in high-voltage areas or where radiofrequency interference is present. acoustic emission sensor 2. Preamplifiers I. Preamplifiers are devices that amplify the weak signals generated by the sensors before they are processed. How they work. Preamplifiers increase the amplitude of the signals to a level suitable for further processing and analysis without adding significant noise. Applications. Essential for ensuring that the detected acoustic emissions are strong enough to be accurately analyzed, especially in large or noisy environments. 3. Data Acquisition Systems I. Data Acquisition Systems collect and digitize the electrical signals from the sensors. How they work. These systems convert the analog signals from the sensors into digital data that can be processed by computers. They often include features like filtering, sampling, and multiplexing. Applications. Used to gather and store data from multiple sensors simultaneously, allowing for comprehensive analysis of acoustic emissions across large structures. 4. Signal Processing Software I. Signal processing software is software designed to analyze the digitized acoustic emission signals. How it works. The software filters noise, extracts features, and performs signal analysis to identify the source and characteristics of acoustic emissions. It may also use algorithms for event detection, pattern recognition, and data visualization. Applications. Essential for interpreting the complex data generated during AET, providing insights into defect location, type, and severity. 5. Waveguides I. Waveguides are devices that transmit acoustic waves from hard-to-reach areas to sensors. How they work. Waveguides channel the acoustic emissions from the source to the sensor, ensuring that signals from inaccessible or harsh environments can still be detected. Applications. Used in structures where direct sensor placement is not possible, such as inside pipes, tanks, or high-temperature environments. 6. Mounting Accessories I. Mounting accessories are components like adhesives, clamps, and magnetic holders used to attach sensors to the material surface. How they work. These accessories ensure that sensors are securely and correctly positioned to detect acoustic emissions effectively. Applications. Critical for maintaining consistent sensor placement during long-term monitoring and ensuring accurate data collection. 7. Calibration Equipment I. Calibration equipment are tools and reference materials used to calibrate sensors and data acquisition systems. How they work. Calibration equipment ensures that the AET system is accurately measuring acoustic emissions, often using known reference signals or materials with predetermined properties. Applications. Regular calibration is necessary to maintain the accuracy and reliability of AET inspections, especially in critical applications. Types of Acoustic Emission Testing Although the term “acoustic emission testing” generally refers to a way to do non-destructive testing, the truth is that there are a lot of different ways you can do it. Each of these approaches is tailored to specific inspection needs and applications, with nuanced differences that depend on the type of stress applied to the material and the nature of the acoustic emissions detected. Each type of acoustic testing offers unique advantages and is suited to different applications. And that’s why it’s so important to have an experienced AET operator doing this work, since they’ll be able to identify the best approach for the specific inspection, helping you get the best test results to inform your maintenance efforts. Here are the main types of acoustic emissions testing: 1. Passive Acoustic Emissions Testing No intervention is used — this method monitors acoustic emissions generated by the material under its normal operational conditions. How it works. Inspectors attach sensors to the material, and acoustic emissions are passively detected as the material undergoes natural stress and deformation. Applications. Commonly used for continuous monitoring of structures like bridges, pressure vessels, and pipelines to detect crack growth, corrosion, and other defects without interrupting their operation. 2. Active Acoustic Emissions Testing Intervention is used — this method introduces stress to the material to induce acoustic emissions. How it works. The material is subjected to controlled mechanical, thermal, or pressure stress to stimulate the release of acoustic emissions, which are then detected by the sensors. Applications. Used in laboratory settings and during scheduled maintenance to evaluate a material’s response to stress and identify potential defects. 3. Burst Acoustic Emissions Testing No intervention is used — monitoring sensors detect high-energy acoustic emissions caused by sudden events, such as crack formation or sudden fracture. How it works. Sensors detect brief, high-amplitude acoustic signals that occur when significant structural changes or failures happen. Applications. Ideal for monitoring critical structures where sudden failures could have catastrophic consequences, such as in aerospace components and high-pressure systems. 4. Continuous Acoustic Emissions Testing No intervention is used — sensors conduct continuous monitoring of low-level acoustic emissions over an extended period. How it works. Sensors continuously collect data on acoustic emissions, which are analyzed to detect gradual changes or trends in the material’s behavior. Applications. Used for long-term health monitoring of infrastructures like bridges, dams, and large buildings to track the progression of defects and ensure structural integrity. 5. Modal Acoustic Emissions Testing Intervention may or may not be used, since this method is about how the data is processed, not collected — combines acoustic testing data with modal analysis to study the dynamic response of materials to stress. How it works. Inspectors take acoustic emission data and correlate it with the material’s modal parameters (natural frequencies, mode shapes) to gain insights into the material’s dynamic behavior. Applications. Used in research and development to study the mechanical properties and failure mechanisms of advanced materials, like composites and alloys. When Is Acoustic Emission Testing Required? Acoustic Emission Testing (AET) is essential in several maintenance scenarios to ensure the quality, safety, and reliability of materials and structures. Here are the main situations that call for acoustic emission testing: 1. Quality Control and Assurance in Manufacturing Production processes. During manufacturing, AET is used to monitor the integrity of materials and components, detecting defects such as cracks, delaminations, and inclusions. This ensures that only defect-free products reach the customer. Incoming material inspection. Inspecting raw materials before use in production, ensuring they meet the required specifications and are free from defects. 2. Structural Health Monitoring Infrastructure monitoring. AET is vital for the continuous monitoring of large infrastructure such as bridges, dams, and buildings. It helps in early detection of structural issues, such as crack growth and material degradation, ensuring the safety and longevity of these structures. Aerospace structures. In the aerospace industry, AET is used to monitor the structural integrity of aircraft components. This includes detecting fatigue cracks, delaminations in composite materials, and other critical defects that could compromise flight safety. 3. Pressure Vessel and Pipeline Monitoring Pressure vessel integrity. AET is crucial for monitoring the integrity of pressure vessels in industries such as oil and gas, chemical processing, and power generation. It helps in detecting leaks, crack growth, and other issues that could lead to catastrophic failures. Pipeline monitoring. Monitoring pipelines for defects such as corrosion, cracking, and third-party damage. Continuous monitoring helps prevent leaks and ruptures, ensuring the safe transportation of fluids and gasses. 4. Preventive Maintenance and Scheduled Inspections Routine maintenance. AET is part of regular maintenance schedules to monitor the condition of critical components and infrastructure. This helps in early detection of potential issues, preventing unexpected failures and downtime. Condition monitoring. Continuous or periodic AET inspections enable the monitoring of components under operational conditions, providing valuable data on their health and predicting their remaining service life. 5. Research and Development Material characterization. In research and development, AET helps characterize new materials, studying their properties and behavior under different conditions. This information is vital for developing advanced materials with enhanced performance. Prototype testing. AET is used to evaluate prototypes, identifying any flaws or weaknesses that need to be addressed before full-scale production. 6. Safety Compliance and Regulatory Requirements Regulatory standards. Many industries are subject to stringent safety regulations that mandate regular acoustic emissions testing. Compliance with these regulations ensures that components and structures meet safety standards, reducing the risk of accidents. Certification and accreditation. AET is often required for certification purposes, such as obtaining pressure vessel and pipeline certifications from regulatory bodies. The Top 5 Industries that Rely on Acoustic Emission Testing + Specific Applications They Use As we mentioned earlier, inspectors can use AET on a huge array of materials, including metals, concrete, ceramics, and many more. This means it can be used in almost every industry you can imagine that relies on machinery or infrastructure made from these materials. Here are the top five industries that use AET, with specific applications covered for each one. 1. Oil and Gas Industry In the oil and gas industry, acoustic emissions testing is vital for maintaining the safety and reliability of pipelines and other downstream, midstream, and upstream infrastructure. Pipeline monitoring. AET is used to detect corrosion, cracking, and other defects in pipelines, ensuring their integrity and preventing leaks or ruptures that could lead to environmental disasters. Pressure vessel monitoring. AET monitors pressure vessels for signs of cracking, leakage, and other defects that could lead to catastrophic failures. Well integrity. Acoustic emissions testing helps assess the integrity of wells, detecting issues such as casing leaks, formation fractures, and cement bond failures. 2. Power Generation In power generation, acoustic emissions testing is essential for maintaining the integrity of critical components in power plants. Steam generator monitoring. AET is used to monitor steam generators for signs of cracking, corrosion, and other defects that could affect their performance and safety. Turbine blade inspection. Detecting early signs of damage in turbine blades, such as cracks and material degradation, ensuring their efficient and safe operation. Transformer and generator monitoring. Monitoring transformers and generators for signs of internal defects, such as winding discharges and core delaminations, ensuring their reliability and performance. 3. Manufacturing Industry In the manufacturing industry, acoustic emissions testing is crucial for ensuring product quality and reliability. Quality assurance. AET is used to inspect raw materials, intermediate products, and final assemblies for internal and surface defects such as cracks, voids, and inclusions. This ensures that only defect-free products reach the customer. Machined part inspection. Inspecting machined parts for defects, ensuring they meet design specifications and tolerances. Weld inspection. Detecting defects in welds, such as cracks and lack of fusion, ensuring the structural integrity of welded joints. 4. Civil Engineering and Infrastructure In civil engineering, acoustic emissions testing plays a crucial role in ensuring the integrity and safety of large structures. Bridge monitoring. AET is used to continuously monitor bridges for signs of structural damage such as crack growth, corrosion, and material degradation. This monitoring helps maintain the safety and longevity of critical infrastructure. Dam safety. Monitoring the integrity of dams, detecting potential issues such as cracking and seepage that could lead to catastrophic failures. Building health monitoring. Monitoring high-rise buildings and other structures for signs of structural stress and damage, ensuring their safety and stability over time. 5. The Aerospace Industry The aerospace industry relies heavily on acoustic emission testing to maintain the safety and performance of aircraft components. Aircraft structural monitoring. AET is used to monitor critical structural components such as wings, fuselage sections, and landing gear for defects like fatigue cracks and delaminations. Ensuring these components are free of flaws is vital for flight safety. Composite material inspection. AET is essential for inspecting composite materials used in aircraft construction, detecting issues such as fiber breakage, matrix cracking, and delamination. Engine components. AET helps monitor engine components, detecting early signs of damage or failure that could compromise engine performance and safety. Best Practices for Acoustic Emission Testing As we’ve covered, AET is incredibly sensitive. For that reason, it’s crucial to follow industry best practices to make sure you do it effectively and produce reliable results, These guidelines can help maximize the accuracy of acoustic inspections and minimize potential risks associated with the testing process. 1. Proper Training and Certification Qualified personnel. Ensure that acoustic emissions testing is conducted by trained and certified technicians. Certification from recognized bodies such as the American Society for Nondestructive Testing (ASNT) or equivalent organizations is essential. Continuous education. Encourage ongoing education and training to keep technicians updated on the latest techniques, equipment, and industry standards. This can include workshops, seminars, and certification renewal courses. 2. Appropriate Equipment Selection Sensor selection. Choose the right type of sensors based on the material and type of inspection. Factors to consider include sensitivity, frequency response, and environmental compatibility. Instrumentation. Use appropriate data acquisition systems and preamplifiers that match the inspection requirements. Advanced instruments with multi-channel capabilities and digital interfaces can provide more detailed and accurate results. Calibration standards. Employ calibration standards and reference materials that match the expected acoustic emission characteristics. Regularly calibrate the equipment to maintain accuracy. 3. Surface Preparation Clean surfaces. Ensure that the surfaces where sensors are attached are clean and free from contaminants such as dirt, grease, and paint. Contaminants can impede the transmission of acoustic waves and affect the accuracy of the inspection. Smooth surfaces. Smooth out rough or uneven surfaces as much as possible to improve sensor coupling and signal quality. 4. Inspection Procedures Standard operating procedures (SOPs). Develop and adhere to detailed SOPs for each type of acoustic emissions inspection. SOPs ensure consistency, thoroughness, and compliance with regulatory requirements. Proper sensor placement. Strategically place sensors to ensure comprehensive coverage of the material or structure. Use waveguides if necessary to reach inaccessible areas. Signal interpretation. Technicians should be skilled in interpreting acoustic emissions signals to accurately identify and characterize defects. It’s essential that these operators can understand the nuances of signal waveforms, frequencies, and amplitudes. 5. Data Acquisition and Analysis Real-time monitoring. Use data acquisition systems that provide real-time monitoring and display of acoustic emissions signals, allowing for immediate detection and analysis of defects. Data recording. Record and store inspection data systematically. This helps in tracking the condition of components over time and provides valuable information for future inspections. Advanced software. Use advanced data analysis software that can enhance signal interpretation, generate detailed reports, and store inspection records efficiently. 6. Regular Equipment Maintenance Routine checks. Perform regular maintenance and routine checks on acoustic emissions testing equipment to ensure it is in good working condition. This includes inspecting sensors, preamplifiers, and data acquisition systems for wear and damage. Calibration. Regularly calibrate equipment according to manufacturer guidelines and industry standards to maintain accuracy and reliability. Software updates. Keep software for data acquisition and analysis up-to-date to take advantage of the latest Notable Manufacturers of Acoustic Emission Testing Equipment As the demand for accurate and reliable testing methods continues to rise, several manufacturers have emerged as leaders in acoustic emission testing technology. Here are some notable companies providing advanced solutions: Krautkramer (GE Measurement & Control) Krautkramer is a renowned leader in nondestructive testing technology, offering a wide array of AET solutions tailored for industrial applications, particularly within the aerospace and energy sectors. Their commitment to reliability and advanced technology makes them a trusted name in the field. Website: www.ge.com/measurement-and-control Physical Acoustics Corporation (PAC) PAC has pioneered the use of acoustic emission technology, providing comprehensive products and services aimed at monitoring structural integrity and evaluating materials. Their solutions are utilized across diverse fields, including oil and gas, aerospace, and infrastructure. Website: www.pacndt.com Mistras Group, Inc. Mistras Group offers integrated asset protection solutions, including advanced AET services. With expertise spanning several industries, they help clients detect and predict equipment failures to enhance operational safety. Website: www.mistrasgroup.com Qawrums Ltd Formerly known as QingCheng AE, Qawrums Ltd specializes in innovative AET and nondestructive testing technologies. Their systems are designed for health monitoring in sectors like civil engineering and manufacturing, ensuring structural safety and reliability. Website: www.aendt.com Vallen Systeme GmbH Vallen provides a diverse range of NDT equipment, including acoustic emission systems that cater to critical applications in the aerospace and automotive industries, focusing on quality assurance and safety. Website: www.vallen.de/en/ Olympus Corporation A global leader in nondestructive testing solutions, Olympus offers various AET equipment across multiple sectors. Their technology is vital for maintaining structural integrity and safety in diverse industries, including aerospace and construction. Website: www.olympus-ims.com NDT Solutions NDT Solutions specializes in advanced acoustic emission testing equipment and services, enhancing reliability across various industrial applications. They focus on delivering tailored solutions to meet specific client needs. Website: www.ndtsolutions.com Applied Technical Services (ATS) ATS offers a broad spectrum of inspection and testing services, including acoustic emission testing. Their expertise helps ensure compliance and safety in many industrial sectors, providing critical insights into equipment health. Website: www.atsdriven.com SENSeT Technologies SENSeT is dedicated to acoustic emission and monitoring technologies, providing innovative equipment crucial for structural health monitoring. Their real-time detection solutions are essential for maintaining safety in various applications. Website: www.senset-technologies.com |
| json metadata | {"tags":["aet"],"app":"steemit/0.2","format":"markdown"} |
| parent author | |
| parent permlink | aet |
| permlink | acoustic-emission-testing-an-in-depth-guide-from-qawrums |
| title | Acoustic Emission Testing: An In-Depth Guide from Qawrums |
| Transaction Info | Block #89324063/Trx 140a560b1cd9164fb82acf3c34964512077960ab |
View Raw JSON Data
{
  "block": 89324063,
  "op": [
    "comment",
    {
      "author": "barrylee",
      "body": "Table of Contents\nWhat Is Acoustic Emission Testing?\nAcoustic Emission Testing vs. Ultrasonic Testing\nAcoustic Emission Testing Tools\nTypes of Acoustic Emission Testing\nWhen Is Acoustic Emission Testing Required?\nThe Top 5 Industries that Rely on Acoustic Emission Testing + Specific Applications They Use\nBest Practices for Acoustic Emission Testing\nNotable Manufacturers of Acoustic Emission Testing Equipment\n\nAcoustic Emission Testing\nAcoustic Emission Testing (AET) is an NDT method that monitors the release of energy in the form of transient elastic waves — also known as acoustic emissions — from materials under stress in order to detect flaws in them for inspection purposes.\n\nAlternate phrases for AET include:\n\nAcoustic testing\nAcoustic monitoring\nAcoustic analysis\nAcoustic signal detection\nAcoustic emission analysis\nAcoustic emission testing is particularly effective for identifying and evaluating defects during inspections, including:\n\nCrack formations\nCorrosion\nFiber breakage in composites\nAET is used extensively in industries where maintaining the integrity and safety of critical components is essential, including aerospace, civil engineering, power generation, and manufacturing.\n\nThis article provides an in-depth overview of acoustic emission testing, exploring the tools and techniques used, the various types of AET methods, and the inspection scenarios where it’s most useful.\n\nWhat Is Acoustic Emission Testing?\nAcoustic emission testing detects and analyzes the high-frequency acoustic waves emitted by materials when they undergo deformation or stress.\n\nAcoustic emissions are generated by various defects, including crack formation, plastic deformation, and phase transformations, providing valuable information about the integrity and behavior of the material under load.\n\nThis information is crucial for identifying defects in assets, helping inspectors find potential issues before they develop into severe problems.\n\nAnd its usefulness isn’t limited to just a few industries. The list of materials for which AET can be used includes metal, concrete, or ceramics, alloys, composites, and many others, so almost any industry can benefit from its ability to detect the early stages of defect formation and monitor damage progression in real-time.\n\n\nPrinciples of Acoustic Emissions Testing\nThe fundamental principle of AET is based on the detection and analysis of transient elastic waves produced by the rapid release of energy from localized sources within a material.\n\nPut simply, inspectors monitor acoustic waves in a material then analyze them to identify anomalies, indicating the possible presence of a flaw. These waves could be present on their own (i.e., passive acoustic testing, which requires no intervention) or could be introduced by stressing a material (i.e., active acoustic testing, which requires an intervention from the inspector to create acoustic waves).\n\nBelow is a short step-by-step for acoustic emission testing, following the active model. (Note that for passive acoustic testing the process would start at step three, when inspectors use sensors to begin detecting acoustic.)\n\n1. Stress Application\n\nInspectors stress the material they’re inspecting using means like mechanical loading or thermal cycling.\n\n2. Wave Generation\n\nAs the material undergoes stress it deforms, emitting acoustic waves due to processes like crack initiation, crack growth, fiber breakage, or corrosion.\n\n3. Wave Detection\n\nInspectors attach sensors, typically piezoelectric transducers, to the material’s surface to detect acoustic waves. These sensors convert mechanical waves into electrical signals, which can be interpreted to identify the presence of defects.\n\n4. Signal Processing\n\nInspectors amplify the converted electrical signals, filtering and processing them to extract meaningful information — i.e., where is there a potential defect? and what is the nature of the defect? — about the source and characteristics of the acoustic emissions.\n\n5. Data Analysis\n\nInspectors process the data then analyze it to identify the type, location, and severity of defects, allowing them to conduct real-time monitoring and assessments of the material’s condition.\n\nAdvantages of Acoustic Emissions Testing\nReal-time monitoring. AET provides continuous, real-time monitoring of materials and structures, enabling early detection of defects and damage progression.\nSensitivity. AET is highly sensitive to the initiation and growth of defects, often detecting flaws that are not visible using other NDT methods.\nNon-invasive. The technique is non-invasive and doesn’t require contact with the internal structure of the material, making it suitable for a wide range of applications.\nBroad applicability. AET can be used for several types of materials, including metals, composites, ceramics, and polymers.\nLimitations of Acoustic Emissions Testing\nComplex interpretation. You need special training to do AET — the interpretation of acoustic emission signals requires skilled operators with extensive training and experience.\nEnvironmental noise. Background noise and environmental factors can interfere with the detection of acoustic emissions, potentially impacting the accuracy of the test. (As noted above, this method is highly sensitive!)\nLimited range. The effectiveness of AET decreases with distance from the source of the acoustic emission, requiring strategic placement of sensors for comprehensive coverage.\nMaterial dependency. The type of material you’re using for acoustic testing matters — quality of results can vary depending on the material properties and the type of defects you’re monitoring.\nAcoustic Emission Testing vs. Ultrasonic Testing\nAcoustic Emission Testing (AET) and Ultrasonic Testing (UT) are both valuable non-destructive testing (NDT) methods used to assess the integrity of materials and structures.\n\nDespite their similarities, these techniques differ significantly in their principles, applications, and advantages. Understanding these differences helps in selecting the appropriate method for your specific inspection needs.\n\nAcoustic Emission Testing (AET)\nHow it works. AET monitors the release of transient elastic waves (acoustic emissions) generated by the rapid release of energy from localized sources within a material under stress. Sensors placed on the material’s surface detect these emissions, which are then analyzed to locate and characterize defects such as cracks and delaminations.\nDetection mechanism. AET can be passive or active, either relying on the material itself to generate signals when it experiences stress or introducing stress, which then leads to changes in acoustic waves, allowing inspectors to identify issues like material deformation or crack propagation.\nUltrasonic Testing (UT)\nHow it works. UT uses high-frequency sound waves that are introduced into the material via a transducer. These sound waves travel through the material and reflect off internal features such as flaws or boundaries. The reflected waves are detected by the transducer or another sensor, and the amplitude of the echoes and other data are analyzed to determine the location, size, and nature of internal defects.\nDetection mechanism. UT is active, requiring an external source to generate ultrasonic waves that are then transmitted into the material.\nChoosing Between AET and UT\nThe choice between Acoustic Emission Testing and Ultrasonic Testing depends on the specific requirements of the inspection task.\n\nAET is ideal for real-time monitoring and detecting active damage, making it suitable for long-term structural health monitoring.\nUT, on the other hand, is preferred for detailed flaw detection, thickness measurements, and applications where precise quantitative data is required.\nAcoustic Emission Testing Tools\nInspectors use a huge range of specialized tools and equipment for acoustic monitoring.\n\nThese tools are designed to detect, amplify, and analyze the acoustic waves generated by materials under stress.\n\nBelow are the most common types of acoustic emission testing tools. We’ve organized these tools into seven categories, with specific types listed for each one (some categories only have one type).\n\n1. AET Sensors\nI. Piezoelectric transducers are AET sensors that convert mechanical waves into electrical signals.\n\nHow they work. When an acoustic wave reaches the piezoelectric transducer, it generates an electrical signal proportional to the wave’s amplitude and frequency.\nApplications. These sensors are widely used in AET for detecting a wide range of acoustic emissions from various materials and structures.\nII. Fiber optic sensors are AET sensors that use optical fibers to detect acoustic emissions.\n\nHow they work. Acoustic waves cause slight changes in the optical fiber’s properties, which are detected and converted into electrical signals.\nApplications. Used in environments where electromagnetic interference might affect piezoelectric sensors, such as in high-voltage areas or where radiofrequency interference is present.\n\nacoustic emission sensor\n2. Preamplifiers\nI. Preamplifiers are devices that amplify the weak signals generated by the sensors before they are processed.\n\nHow they work. Preamplifiers increase the amplitude of the signals to a level suitable for further processing and analysis without adding significant noise.\nApplications. Essential for ensuring that the detected acoustic emissions are strong enough to be accurately analyzed, especially in large or noisy environments.\n\n3. Data Acquisition Systems\nI. Data Acquisition Systems collect and digitize the electrical signals from the sensors.\n\nHow they work. These systems convert the analog signals from the sensors into digital data that can be processed by computers. They often include features like filtering, sampling, and multiplexing.\nApplications. Used to gather and store data from multiple sensors simultaneously, allowing for comprehensive analysis of acoustic emissions across large structures.\n\n4. Signal Processing Software\nI. Signal processing software is software designed to analyze the digitized acoustic emission signals.\n\nHow it works. The software filters noise, extracts features, and performs signal analysis to identify the source and characteristics of acoustic emissions. It may also use algorithms for event detection, pattern recognition, and data visualization.\nApplications. Essential for interpreting the complex data generated during AET, providing insights into defect location, type, and severity.\n\n5. Waveguides\nI. Waveguides are devices that transmit acoustic waves from hard-to-reach areas to sensors.\n\nHow they work. Waveguides channel the acoustic emissions from the source to the sensor, ensuring that signals from inaccessible or harsh environments can still be detected.\nApplications. Used in structures where direct sensor placement is not possible, such as inside pipes, tanks, or high-temperature environments.\n\n6. Mounting Accessories\nI. Mounting accessories are components like adhesives, clamps, and magnetic holders used to attach sensors to the material surface.\n\nHow they work. These accessories ensure that sensors are securely and correctly positioned to detect acoustic emissions effectively.\nApplications. Critical for maintaining consistent sensor placement during long-term monitoring and ensuring accurate data collection.\n\n\n7. Calibration Equipment\nI. Calibration equipment are tools and reference materials used to calibrate sensors and data acquisition systems.\n\nHow they work. Calibration equipment ensures that the AET system is accurately measuring acoustic emissions, often using known reference signals or materials with predetermined properties.\nApplications. Regular calibration is necessary to maintain the accuracy and reliability of AET inspections, especially in critical applications.\n\nTypes of Acoustic Emission Testing\nAlthough the term “acoustic emission testing” generally refers to a way to do non-destructive testing, the truth is that there are a lot of different ways you can do it.\n\nEach of these approaches is tailored to specific inspection needs and applications, with nuanced differences that depend on the type of stress applied to the material and the nature of the acoustic emissions detected.\n\nEach type of acoustic testing offers unique advantages and is suited to different applications. And that’s why it’s so important to have an experienced AET operator doing this work, since they’ll be able to identify the best approach for the specific inspection, helping you get the best test results to inform your maintenance efforts.\n\nHere are the main types of acoustic emissions testing:\n\n1. Passive Acoustic Emissions Testing\nNo intervention is used — this method monitors acoustic emissions generated by the material under its normal operational conditions.\n\nHow it works. Inspectors attach sensors to the material, and acoustic emissions are passively detected as the material undergoes natural stress and deformation.\nApplications. Commonly used for continuous monitoring of structures like bridges, pressure vessels, and pipelines to detect crack growth, corrosion, and other defects without interrupting their operation.\n2. Active Acoustic Emissions Testing\nIntervention is used — this method introduces stress to the material to induce acoustic emissions.\n\nHow it works. The material is subjected to controlled mechanical, thermal, or pressure stress to stimulate the release of acoustic emissions, which are then detected by the sensors.\nApplications. Used in laboratory settings and during scheduled maintenance to evaluate a material’s response to stress and identify potential defects.\n3. Burst Acoustic Emissions Testing\nNo intervention is used — monitoring sensors detect high-energy acoustic emissions caused by sudden events, such as crack formation or sudden fracture.\n\nHow it works. Sensors detect brief, high-amplitude acoustic signals that occur when significant structural changes or failures happen.\nApplications. Ideal for monitoring critical structures where sudden failures could have catastrophic consequences, such as in aerospace components and high-pressure systems.\n4. Continuous Acoustic Emissions Testing\nNo intervention is used — sensors conduct continuous monitoring of low-level acoustic emissions over an extended period.\n\nHow it works. Sensors continuously collect data on acoustic emissions, which are analyzed to detect gradual changes or trends in the material’s behavior.\nApplications. Used for long-term health monitoring of infrastructures like bridges, dams, and large buildings to track the progression of defects and ensure structural integrity.\n5. Modal Acoustic Emissions Testing\nIntervention may or may not be used, since this method is about how the data is processed, not collected — combines acoustic testing data with modal analysis to study the dynamic response of materials to stress.\n\nHow it works. Inspectors take acoustic emission data and correlate it with the material’s modal parameters (natural frequencies, mode shapes) to gain insights into the material’s dynamic behavior.\nApplications. Used in research and development to study the mechanical properties and failure mechanisms of advanced materials, like composites and alloys.\nWhen Is Acoustic Emission Testing Required?\nAcoustic Emission Testing (AET) is essential in several maintenance scenarios to ensure the quality, safety, and reliability of materials and structures.\n\nHere are the main situations that call for acoustic emission testing:\n\n1. Quality Control and Assurance in Manufacturing\nProduction processes. During manufacturing, AET is used to monitor the integrity of materials and components, detecting defects such as cracks, delaminations, and inclusions. This ensures that only defect-free products reach the customer.\nIncoming material inspection. Inspecting raw materials before use in production, ensuring they meet the required specifications and are free from defects.\n2. Structural Health Monitoring\nInfrastructure monitoring. AET is vital for the continuous monitoring of large infrastructure such as bridges, dams, and buildings. It helps in early detection of structural issues, such as crack growth and material degradation, ensuring the safety and longevity of these structures.\nAerospace structures. In the aerospace industry, AET is used to monitor the structural integrity of aircraft components. This includes detecting fatigue cracks, delaminations in composite materials, and other critical defects that could compromise flight safety.\n3. Pressure Vessel and Pipeline Monitoring\nPressure vessel integrity. AET is crucial for monitoring the integrity of pressure vessels in industries such as oil and gas, chemical processing, and power generation. It helps in detecting leaks, crack growth, and other issues that could lead to catastrophic failures.\nPipeline monitoring. Monitoring pipelines for defects such as corrosion, cracking, and third-party damage. Continuous monitoring helps prevent leaks and ruptures, ensuring the safe transportation of fluids and gasses.\n4. Preventive Maintenance and Scheduled Inspections\nRoutine maintenance. AET is part of regular maintenance schedules to monitor the condition of critical components and infrastructure. This helps in early detection of potential issues, preventing unexpected failures and downtime.\nCondition monitoring. Continuous or periodic AET inspections enable the monitoring of components under operational conditions, providing valuable data on their health and predicting their remaining service life.\n5. Research and Development\nMaterial characterization. In research and development, AET helps characterize new materials, studying their properties and behavior under different conditions. This information is vital for developing advanced materials with enhanced performance.\nPrototype testing. AET is used to evaluate prototypes, identifying any flaws or weaknesses that need to be addressed before full-scale production.\n6. Safety Compliance and Regulatory Requirements\nRegulatory standards. Many industries are subject to stringent safety regulations that mandate regular acoustic emissions testing. Compliance with these regulations ensures that components and structures meet safety standards, reducing the risk of accidents.\nCertification and accreditation. AET is often required for certification purposes, such as obtaining pressure vessel and pipeline certifications from regulatory bodies.\nThe Top 5 Industries that Rely on Acoustic Emission Testing + Specific Applications They Use\nAs we mentioned earlier, inspectors can use AET on a huge array of materials, including metals, concrete, ceramics, and many more.\n\nThis means it can be used in almost every industry you can imagine that relies on machinery or infrastructure made from these materials.\n\nHere are the top five industries that use AET, with specific applications covered for each one.\n\n1. Oil and Gas Industry\nIn the oil and gas industry, acoustic emissions testing is vital for maintaining the safety and reliability of pipelines and other downstream, midstream, and upstream infrastructure.\n\nPipeline monitoring. AET is used to detect corrosion, cracking, and other defects in pipelines, ensuring their integrity and preventing leaks or ruptures that could lead to environmental disasters.\nPressure vessel monitoring. AET monitors pressure vessels for signs of cracking, leakage, and other defects that could lead to catastrophic failures.\nWell integrity. Acoustic emissions testing helps assess the integrity of wells, detecting issues such as casing leaks, formation fractures, and cement bond failures.\n2. Power Generation\nIn power generation, acoustic emissions testing is essential for maintaining the integrity of critical components in power plants.\n\nSteam generator monitoring. AET is used to monitor steam generators for signs of cracking, corrosion, and other defects that could affect their performance and safety.\nTurbine blade inspection. Detecting early signs of damage in turbine blades, such as cracks and material degradation, ensuring their efficient and safe operation.\nTransformer and generator monitoring. Monitoring transformers and generators for signs of internal defects, such as winding discharges and core delaminations, ensuring their reliability and performance.\n3. Manufacturing Industry\nIn the manufacturing industry, acoustic emissions testing is crucial for ensuring product quality and reliability.\n\nQuality assurance. AET is used to inspect raw materials, intermediate products, and final assemblies for internal and surface defects such as cracks, voids, and inclusions. This ensures that only defect-free products reach the customer.\nMachined part inspection. Inspecting machined parts for defects, ensuring they meet design specifications and tolerances.\nWeld inspection. Detecting defects in welds, such as cracks and lack of fusion, ensuring the structural integrity of welded joints.\n4. Civil Engineering and Infrastructure\nIn civil engineering, acoustic emissions testing plays a crucial role in ensuring the integrity and safety of large structures.\n\nBridge monitoring. AET is used to continuously monitor bridges for signs of structural damage such as crack growth, corrosion, and material degradation. This monitoring helps maintain the safety and longevity of critical infrastructure.\nDam safety. Monitoring the integrity of dams, detecting potential issues such as cracking and seepage that could lead to catastrophic failures.\nBuilding health monitoring. Monitoring high-rise buildings and other structures for signs of structural stress and damage, ensuring their safety and stability over time.\n5. The Aerospace Industry\nThe aerospace industry relies heavily on acoustic emission testing to maintain the safety and performance of aircraft components.\n\nAircraft structural monitoring. AET is used to monitor critical structural components such as wings, fuselage sections, and landing gear for defects like fatigue cracks and delaminations. Ensuring these components are free of flaws is vital for flight safety.\nComposite material inspection. AET is essential for inspecting composite materials used in aircraft construction, detecting issues such as fiber breakage, matrix cracking, and delamination.\nEngine components. AET helps monitor engine components, detecting early signs of damage or failure that could compromise engine performance and safety.\nBest Practices for Acoustic Emission Testing\nAs we’ve covered, AET is incredibly sensitive. For that reason, it’s crucial to follow industry best practices to make sure you do it effectively and produce reliable results,\n\nThese guidelines can help maximize the accuracy of acoustic inspections and minimize potential risks associated with the testing process.\n\n1. Proper Training and Certification\nQualified personnel. Ensure that acoustic emissions testing is conducted by trained and certified technicians. Certification from recognized bodies such as the American Society for Nondestructive Testing (ASNT) or equivalent organizations is essential.\nContinuous education. Encourage ongoing education and training to keep technicians updated on the latest techniques, equipment, and industry standards. This can include workshops, seminars, and certification renewal courses.\n2. Appropriate Equipment Selection\nSensor selection. Choose the right type of sensors based on the material and type of inspection. Factors to consider include sensitivity, frequency response, and environmental compatibility.\nInstrumentation. Use appropriate data acquisition systems and preamplifiers that match the inspection requirements. Advanced instruments with multi-channel capabilities and digital interfaces can provide more detailed and accurate results.\nCalibration standards. Employ calibration standards and reference materials that match the expected acoustic emission characteristics. Regularly calibrate the equipment to maintain accuracy.\n3. Surface Preparation\nClean surfaces. Ensure that the surfaces where sensors are attached are clean and free from contaminants such as dirt, grease, and paint. Contaminants can impede the transmission of acoustic waves and affect the accuracy of the inspection.\nSmooth surfaces. Smooth out rough or uneven surfaces as much as possible to improve sensor coupling and signal quality.\n4. Inspection Procedures\nStandard operating procedures (SOPs). Develop and adhere to detailed SOPs for each type of acoustic emissions inspection. SOPs ensure consistency, thoroughness, and compliance with regulatory requirements.\nProper sensor placement. Strategically place sensors to ensure comprehensive coverage of the material or structure. Use waveguides if necessary to reach inaccessible areas.\nSignal interpretation. Technicians should be skilled in interpreting acoustic emissions signals to accurately identify and characterize defects. It’s essential that these operators can understand the nuances of signal waveforms, frequencies, and amplitudes.\n5. Data Acquisition and Analysis\nReal-time monitoring. Use data acquisition systems that provide real-time monitoring and display of acoustic emissions signals, allowing for immediate detection and analysis of defects.\nData recording. Record and store inspection data systematically. This helps in tracking the condition of components over time and provides valuable information for future inspections.\nAdvanced software. Use advanced data analysis software that can enhance signal interpretation, generate detailed reports, and store inspection records efficiently.\n6. Regular Equipment Maintenance\nRoutine checks. Perform regular maintenance and routine checks on acoustic emissions testing equipment to ensure it is in good working condition. This includes inspecting sensors, preamplifiers, and data acquisition systems for wear and damage.\nCalibration. Regularly calibrate equipment according to manufacturer guidelines and industry standards to maintain accuracy and reliability.\nSoftware updates. Keep software for data acquisition and analysis up-to-date to take advantage of the latest\nNotable Manufacturers of Acoustic Emission Testing Equipment\nAs the demand for accurate and reliable testing methods continues to rise, several manufacturers have emerged as leaders in acoustic emission testing technology. Here are some notable companies providing advanced solutions:\n\nKrautkramer (GE Measurement & Control)\nKrautkramer is a renowned leader in nondestructive testing technology, offering a wide array of AET solutions tailored for industrial applications, particularly within the aerospace and energy sectors. Their commitment to reliability and advanced technology makes them a trusted name in the field.\nWebsite: www.ge.com/measurement-and-control\nPhysical Acoustics Corporation (PAC)\nPAC has pioneered the use of acoustic emission technology, providing comprehensive products and services aimed at monitoring structural integrity and evaluating materials. Their solutions are utilized across diverse fields, including oil and gas, aerospace, and infrastructure.\nWebsite: www.pacndt.com\nMistras Group, Inc.\nMistras Group offers integrated asset protection solutions, including advanced AET services. With expertise spanning several industries, they help clients detect and predict equipment failures to enhance operational safety.\nWebsite: www.mistrasgroup.com\nQawrums Ltd\nFormerly known as QingCheng AE, Qawrums Ltd specializes in innovative AET and nondestructive testing technologies. Their systems are designed for health monitoring in sectors like civil engineering and manufacturing, ensuring structural safety and reliability.\nWebsite: www.aendt.com\nVallen Systeme GmbH\nVallen provides a diverse range of NDT equipment, including acoustic emission systems that cater to critical applications in the aerospace and automotive industries, focusing on quality assurance and safety.\nWebsite: www.vallen.de/en/\nOlympus Corporation\nA global leader in nondestructive testing solutions, Olympus offers various AET equipment across multiple sectors. Their technology is vital for maintaining structural integrity and safety in diverse industries, including aerospace and construction.\nWebsite: www.olympus-ims.com\nNDT Solutions\nNDT Solutions specializes in advanced acoustic emission testing equipment and services, enhancing reliability across various industrial applications. They focus on delivering tailored solutions to meet specific client needs.\nWebsite: www.ndtsolutions.com\nApplied Technical Services (ATS)\nATS offers a broad spectrum of inspection and testing services, including acoustic emission testing. Their expertise helps ensure compliance and safety in many industrial sectors, providing critical insights into equipment health.\nWebsite: www.atsdriven.com\nSENSeT Technologies\nSENSeT is dedicated to acoustic emission and monitoring technologies, providing innovative equipment crucial for structural health monitoring. Their real-time detection solutions are essential for maintaining safety in various applications.\nWebsite: www.senset-technologies.com",
      "json_metadata": "{\"tags\":[\"aet\"],\"app\":\"steemit/0.2\",\"format\":\"markdown\"}",
      "parent_author": "",
      "parent_permlink": "aet",
      "permlink": "acoustic-emission-testing-an-in-depth-guide-from-qawrums",
      "title": "Acoustic Emission Testing: An In-Depth Guide from Qawrums"
    }
  ],
  "op_in_trx": 0,
  "timestamp": "2024-10-09T08:45:21",
  "trx_id": "140a560b1cd9164fb82acf3c34964512077960ab",
  "trx_in_block": 5,
  "virtual_op": 0
}barryleeupdated their account properties2024/09/27 09:39:15
barryleeupdated their account properties
2024/09/27 09:39:15
| account | barrylee |
| extensions | [] |
| json metadata | |
| posting json metadata | {"profile":{"profile_image":"https://cdn.steemitimages.com/DQmXbKk6eTxNNfPnudYCgKHmJvHCHmivAnaFDsAVDXsRjrU/jpg2.jpg","cover_image":"https://cdn.steemitimages.com/DQmXGbD3ofNYWjvzTdaFtHFwrfdoTVkk2yDYS33BT54Db2p/channels4_banner.jpg","name":"Qawrums Ltd","about":"QingCheng AE Institute (Guangzhou) Co., Ltd have been committed to acoustic emission detection and monitoring in NDT industry for more than 20 years.","location":"China","website":"https://www.aendt.com","version":2}} |
| Transaction Info | Block #88981047/Trx 041014d9425b30933f529d35873b0718f2f2a73b |
View Raw JSON Data
{
  "block": 88981047,
  "op": [
    "account_update2",
    {
      "account": "barrylee",
      "extensions": [],
      "json_metadata": "",
      "posting_json_metadata": "{\"profile\":{\"profile_image\":\"https://cdn.steemitimages.com/DQmXbKk6eTxNNfPnudYCgKHmJvHCHmivAnaFDsAVDXsRjrU/jpg2.jpg\",\"cover_image\":\"https://cdn.steemitimages.com/DQmXGbD3ofNYWjvzTdaFtHFwrfdoTVkk2yDYS33BT54Db2p/channels4_banner.jpg\",\"name\":\"Qawrums Ltd\",\"about\":\"QingCheng AE Institute (Guangzhou) Co., Ltd have been committed to acoustic emission detection and monitoring in NDT industry for more than 20 years.\",\"location\":\"China\",\"website\":\"https://www.aendt.com\",\"version\":2}}"
    }
  ],
  "op_in_trx": 0,
  "timestamp": "2024-09-27T09:39:15",
  "trx_id": "041014d9425b30933f529d35873b0718f2f2a73b",
  "trx_in_block": 4,
  "virtual_op": 0
}barryleeupdated their account properties2024/09/27 09:34:06
barryleeupdated their account properties
2024/09/27 09:34:06
| account | barrylee |
| extensions | [] |
| json metadata | |
| posting json metadata | {"profile":{"profile_image":"https://cdn.steemitimages.com/DQmXbKk6eTxNNfPnudYCgKHmJvHCHmivAnaFDsAVDXsRjrU/jpg2.jpg","cover_image":"https://cdn.steemitimages.com/DQmcgfJnMB2cadAsJ1xjZTt1GyEzwzsQ9vn3e8KcgB77oUX/1.jpg","name":"Qawrums Ltd","about":"QingCheng AE Institute (Guangzhou) Co., Ltd have been committed to acoustic emission detection and monitoring in NDT industry for more than 20 years.","location":"China","website":"https://www.aendt.com","version":2}} |
| Transaction Info | Block #88980945/Trx b7a0c48d19e47ec1e88e37ff414ba4e56cfc0b08 |
View Raw JSON Data
{
  "block": 88980945,
  "op": [
    "account_update2",
    {
      "account": "barrylee",
      "extensions": [],
      "json_metadata": "",
      "posting_json_metadata": "{\"profile\":{\"profile_image\":\"https://cdn.steemitimages.com/DQmXbKk6eTxNNfPnudYCgKHmJvHCHmivAnaFDsAVDXsRjrU/jpg2.jpg\",\"cover_image\":\"https://cdn.steemitimages.com/DQmcgfJnMB2cadAsJ1xjZTt1GyEzwzsQ9vn3e8KcgB77oUX/1.jpg\",\"name\":\"Qawrums Ltd\",\"about\":\"QingCheng AE Institute (Guangzhou) Co., Ltd have been committed to acoustic emission detection and monitoring in NDT industry for more than 20 years.\",\"location\":\"China\",\"website\":\"https://www.aendt.com\",\"version\":2}}"
    }
  ],
  "op_in_trx": 0,
  "timestamp": "2024-09-27T09:34:06",
  "trx_id": "b7a0c48d19e47ec1e88e37ff414ba4e56cfc0b08",
  "trx_in_block": 0,
  "virtual_op": 0
}barryleeupdated their account properties2024/09/27 09:33:15
barryleeupdated their account properties
2024/09/27 09:33:15
| account | barrylee |
| extensions | [] |
| json metadata | |
| posting json metadata | {"profile":{"profile_image":"https://cdn.steemitimages.com/DQmXbKk6eTxNNfPnudYCgKHmJvHCHmivAnaFDsAVDXsRjrU/jpg2.jpg","cover_image":"https://cdn.steemitimages.com/DQmcgfJnMB2cadAsJ1xjZTt1GyEzwzsQ9vn3e8KcgB77oUX/1.jpg","name":"Qawrums_Ltd","about":"QingCheng AE Institute (Guangzhou) Co., Ltd have been committed to acoustic emission detection and monitoring in NDT industry for more than 20 years.","location":"China","website":"https://www.aendt.com","version":2}} |
| Transaction Info | Block #88980928/Trx 0fdff332f18cb849b01fed0ba5eae6249b032e8d |
View Raw JSON Data
{
  "block": 88980928,
  "op": [
    "account_update2",
    {
      "account": "barrylee",
      "extensions": [],
      "json_metadata": "",
      "posting_json_metadata": "{\"profile\":{\"profile_image\":\"https://cdn.steemitimages.com/DQmXbKk6eTxNNfPnudYCgKHmJvHCHmivAnaFDsAVDXsRjrU/jpg2.jpg\",\"cover_image\":\"https://cdn.steemitimages.com/DQmcgfJnMB2cadAsJ1xjZTt1GyEzwzsQ9vn3e8KcgB77oUX/1.jpg\",\"name\":\"Qawrums_Ltd\",\"about\":\"QingCheng AE Institute (Guangzhou) Co., Ltd have been committed to acoustic emission detection and monitoring in NDT industry for more than 20 years.\",\"location\":\"China\",\"website\":\"https://www.aendt.com\",\"version\":2}}"
    }
  ],
  "op_in_trx": 0,
  "timestamp": "2024-09-27T09:33:15",
  "trx_id": "0fdff332f18cb849b01fed0ba5eae6249b032e8d",
  "trx_in_block": 3,
  "virtual_op": 0
}barryleepublished a new post: qawrums-at-iabse-congress-20242024/09/27 09:31:12
barryleepublished a new post: qawrums-at-iabse-congress-2024
2024/09/27 09:31:12
| author | barrylee |
| body | We are pleased to announce that <a href="https://www.aendt.com" target="_blank">QAWRUMS</a> is currently participating as an exhibitor at the <a href="https://iabse.org/events" target="_blank">IABSE Congress 2024</a>, taking place from September 25 to 27, 2024. Our team is showcasing our cutting-edge <a href="https://www.aendt.com/acoustic/solutions/s2/" target="_blank">Bridge Structure Health Monitoring System</a>, which has attracted considerable interest from attendees. 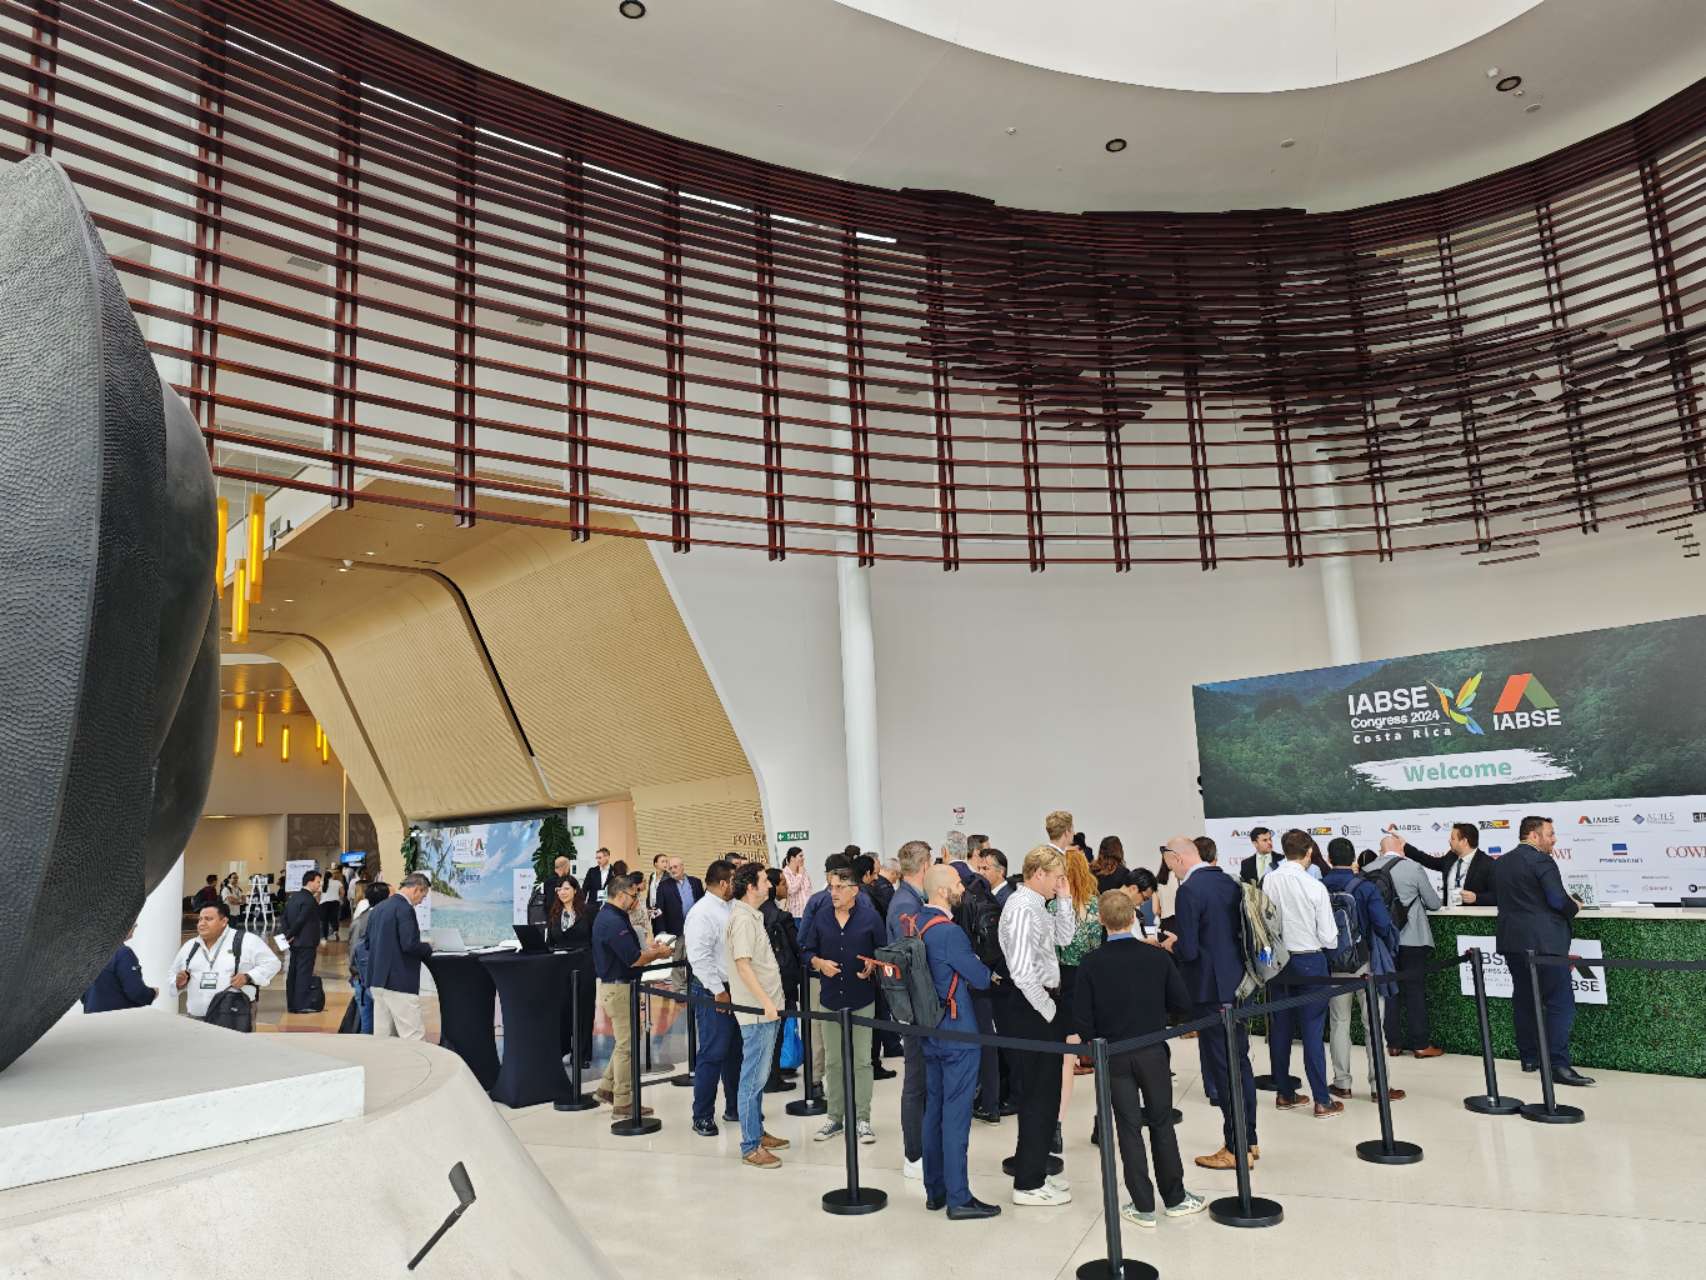  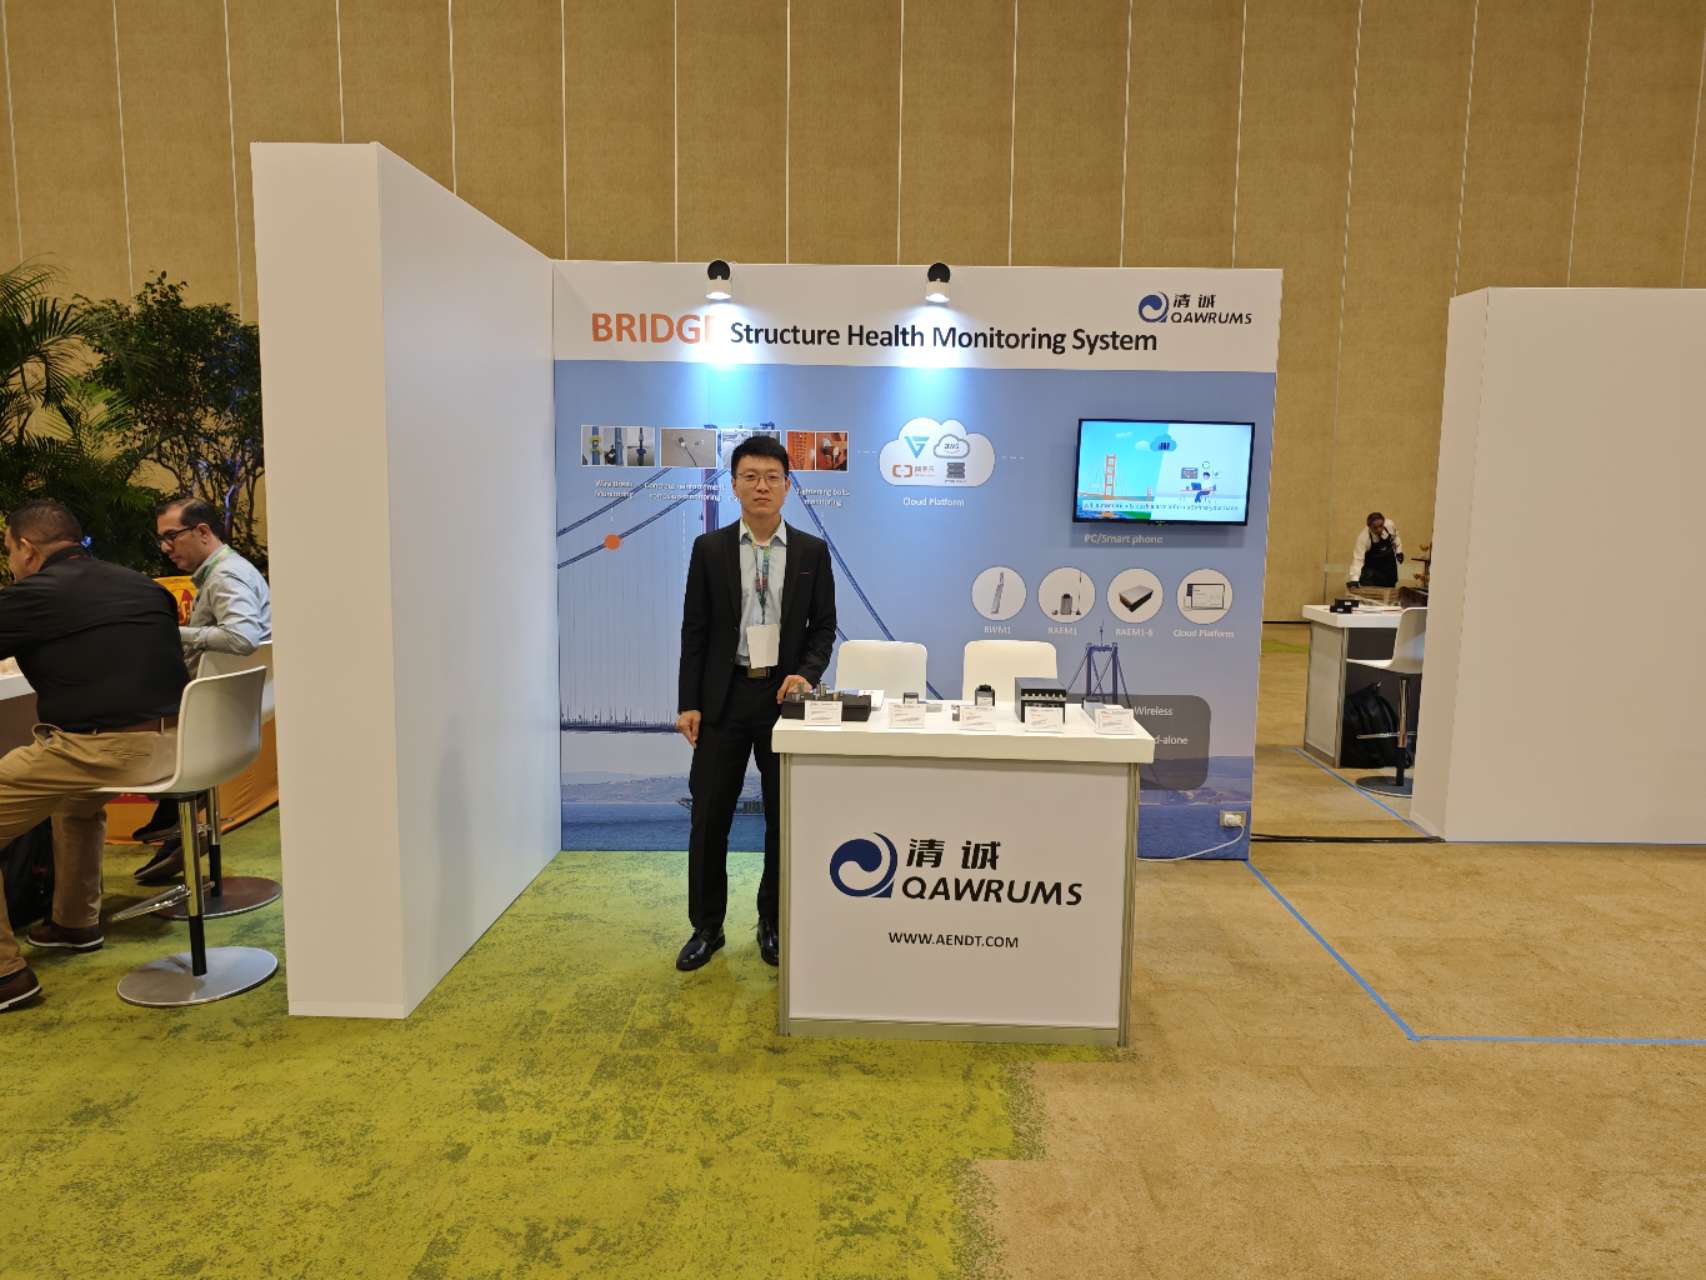  This event provides us with a valuable opportunity to engage with industry professionals and share our insights into the latest advancements in <a href="https://www.aendt.com/acoustic/solutions/s2/">bridge monitoring technology</a>. We are grateful to everyone who has visited our booth and expressed interest in our solutions. Your enthusiasm and feedback mean a great deal to us. As the congress progresses, we are eager to explore potential partnerships and collaborations in the field of bridge and structural engineering. For more details about our offerings and future updates, please visit our website at <a href="https://www.aendt.com">www.aendt.com</a> Thank you for your continued support, and we look forward to connecting with you soon! |
| json metadata | {"tags":["iabse"],"image":["https://cdn.steemitimages.com/DQmQFMMB93FVDtLjvhXCnkDyBDCciGANCTE7gf7DGtxTaWd/iabse2024-1.jpg","https://cdn.steemitimages.com/DQmbXEgnC98NEam69oREruBsPUZggepPMmHgWu5bPRswBGo/iabse2024-2.jpg","https://cdn.steemitimages.com/DQmVc7qnAMSK9vnXofhcySNKE8AtBCUCYEZTtEJiabvDHht/iabse2024-3.jpg","https://cdn.steemitimages.com/DQmaT7e4ts3dMQMJi9B5G45sBUu6nkrn3dyfgndcZ9CHgWN/iabse2024-4.jpg"],"links":["https://www.aendt.com","https://iabse.org/events","https://www.aendt.com/acoustic/solutions/s2/"],"app":"steemit/0.2","format":"markdown"} |
| parent author | |
| parent permlink | iabse |
| permlink | qawrums-at-iabse-congress-2024 |
| title | QAWRUMS at IABSE Congress 2024 |
| Transaction Info | Block #88980888/Trx 7f3f4e434ac4c4c7de0514568a430dc4f9e3d003 |
View Raw JSON Data
{
"block": 88980888,
"op": [
"comment",
{
"author": "barrylee",
"body": "We are pleased to announce that <a href=\"https://www.aendt.com\" target=\"_blank\">QAWRUMS</a> is currently participating as an exhibitor at the <a href=\"https://iabse.org/events\" target=\"_blank\">IABSE Congress 2024</a>, taking place from September 25 to 27, 2024. Our team is showcasing our cutting-edge <a href=\"https://www.aendt.com/acoustic/solutions/s2/\" target=\"_blank\">Bridge Structure Health Monitoring System</a>, which has attracted considerable interest from attendees.\n\n\n\n\n\n\n\n\n\n\n\nThis event provides us with a valuable opportunity to engage with industry professionals and share our insights into the latest advancements in <a href=\"https://www.aendt.com/acoustic/solutions/s2/\">bridge monitoring technology</a>. We are grateful to everyone who has visited our booth and expressed interest in our solutions. Your enthusiasm and feedback mean a great deal to us.\n\nAs the congress progresses, we are eager to explore potential partnerships and collaborations in the field of bridge and structural engineering. For more details about our offerings and future updates, please visit our website at <a href=\"https://www.aendt.com\">www.aendt.com</a>\n\nThank you for your continued support, and we look forward to connecting with you soon!",
"json_metadata": "{\"tags\":[\"iabse\"],\"image\":[\"https://cdn.steemitimages.com/DQmQFMMB93FVDtLjvhXCnkDyBDCciGANCTE7gf7DGtxTaWd/iabse2024-1.jpg\",\"https://cdn.steemitimages.com/DQmbXEgnC98NEam69oREruBsPUZggepPMmHgWu5bPRswBGo/iabse2024-2.jpg\",\"https://cdn.steemitimages.com/DQmVc7qnAMSK9vnXofhcySNKE8AtBCUCYEZTtEJiabvDHht/iabse2024-3.jpg\",\"https://cdn.steemitimages.com/DQmaT7e4ts3dMQMJi9B5G45sBUu6nkrn3dyfgndcZ9CHgWN/iabse2024-4.jpg\"],\"links\":[\"https://www.aendt.com\",\"https://iabse.org/events\",\"https://www.aendt.com/acoustic/solutions/s2/\"],\"app\":\"steemit/0.2\",\"format\":\"markdown\"}",
"parent_author": "",
"parent_permlink": "iabse",
"permlink": "qawrums-at-iabse-congress-2024",
"title": "QAWRUMS at IABSE Congress 2024"
}
],
"op_in_trx": 0,
"timestamp": "2024-09-27T09:31:12",
"trx_id": "7f3f4e434ac4c4c7de0514568a430dc4f9e3d003",
"trx_in_block": 0,
"virtual_op": 0
}saraperezupvoted (5.00%) @barrylee / qawrums-successfully-concludes-participation-in-ewgae-20242024/09/25 10:22:51
saraperezupvoted (5.00%) @barrylee / qawrums-successfully-concludes-participation-in-ewgae-2024
2024/09/25 10:22:51
| author | barrylee |
| permlink | qawrums-successfully-concludes-participation-in-ewgae-2024 |
| voter | saraperez |
| weight | 500 (5.00%) |
| Transaction Info | Block #88924459/Trx 622c927b5005aac29af914fe80914c5f76b89454 |
View Raw JSON Data
{
  "block": 88924459,
  "op": [
    "vote",
    {
      "author": "barrylee",
      "permlink": "qawrums-successfully-concludes-participation-in-ewgae-2024",
      "voter": "saraperez",
      "weight": 500
    }
  ],
  "op_in_trx": 0,
  "timestamp": "2024-09-25T10:22:51",
  "trx_id": "622c927b5005aac29af914fe80914c5f76b89454",
  "trx_in_block": 0,
  "virtual_op": 0
}barryleepublished a new post: qawrums-successfully-concludes-participation-in-ewgae-20242024/09/25 10:19:15
barryleepublished a new post: qawrums-successfully-concludes-participation-in-ewgae-2024
2024/09/25 10:19:15
| author | barrylee |
| body | We are delighted to announce that <a href="https://www.aendt.com">QAWRUMS</a> recently participated as a proud sponsor at <a href="https://ewgae2024.com/frontend/index.php" target="_blank">EWGAE 2024</a>. Over the course of three exciting days, our team showcased our cutting-edge <a href="/acoustic/products/p2/" target="_blank">IoT AE systems</a>, complete with live demonstrations that received enthusiastic feedback from attendees.  During the event, we also presented our oral paper titled “Research on the Application of AI in Acoustic Emission Waveform Data Pattern Recognition.” This presentation explored the exciting intersection of artificial intelligence and <a href="/blog/acoustic-emission-testing.html" target="_blank">acoustic emission technology</a>, sparking engaging discussions among participants. 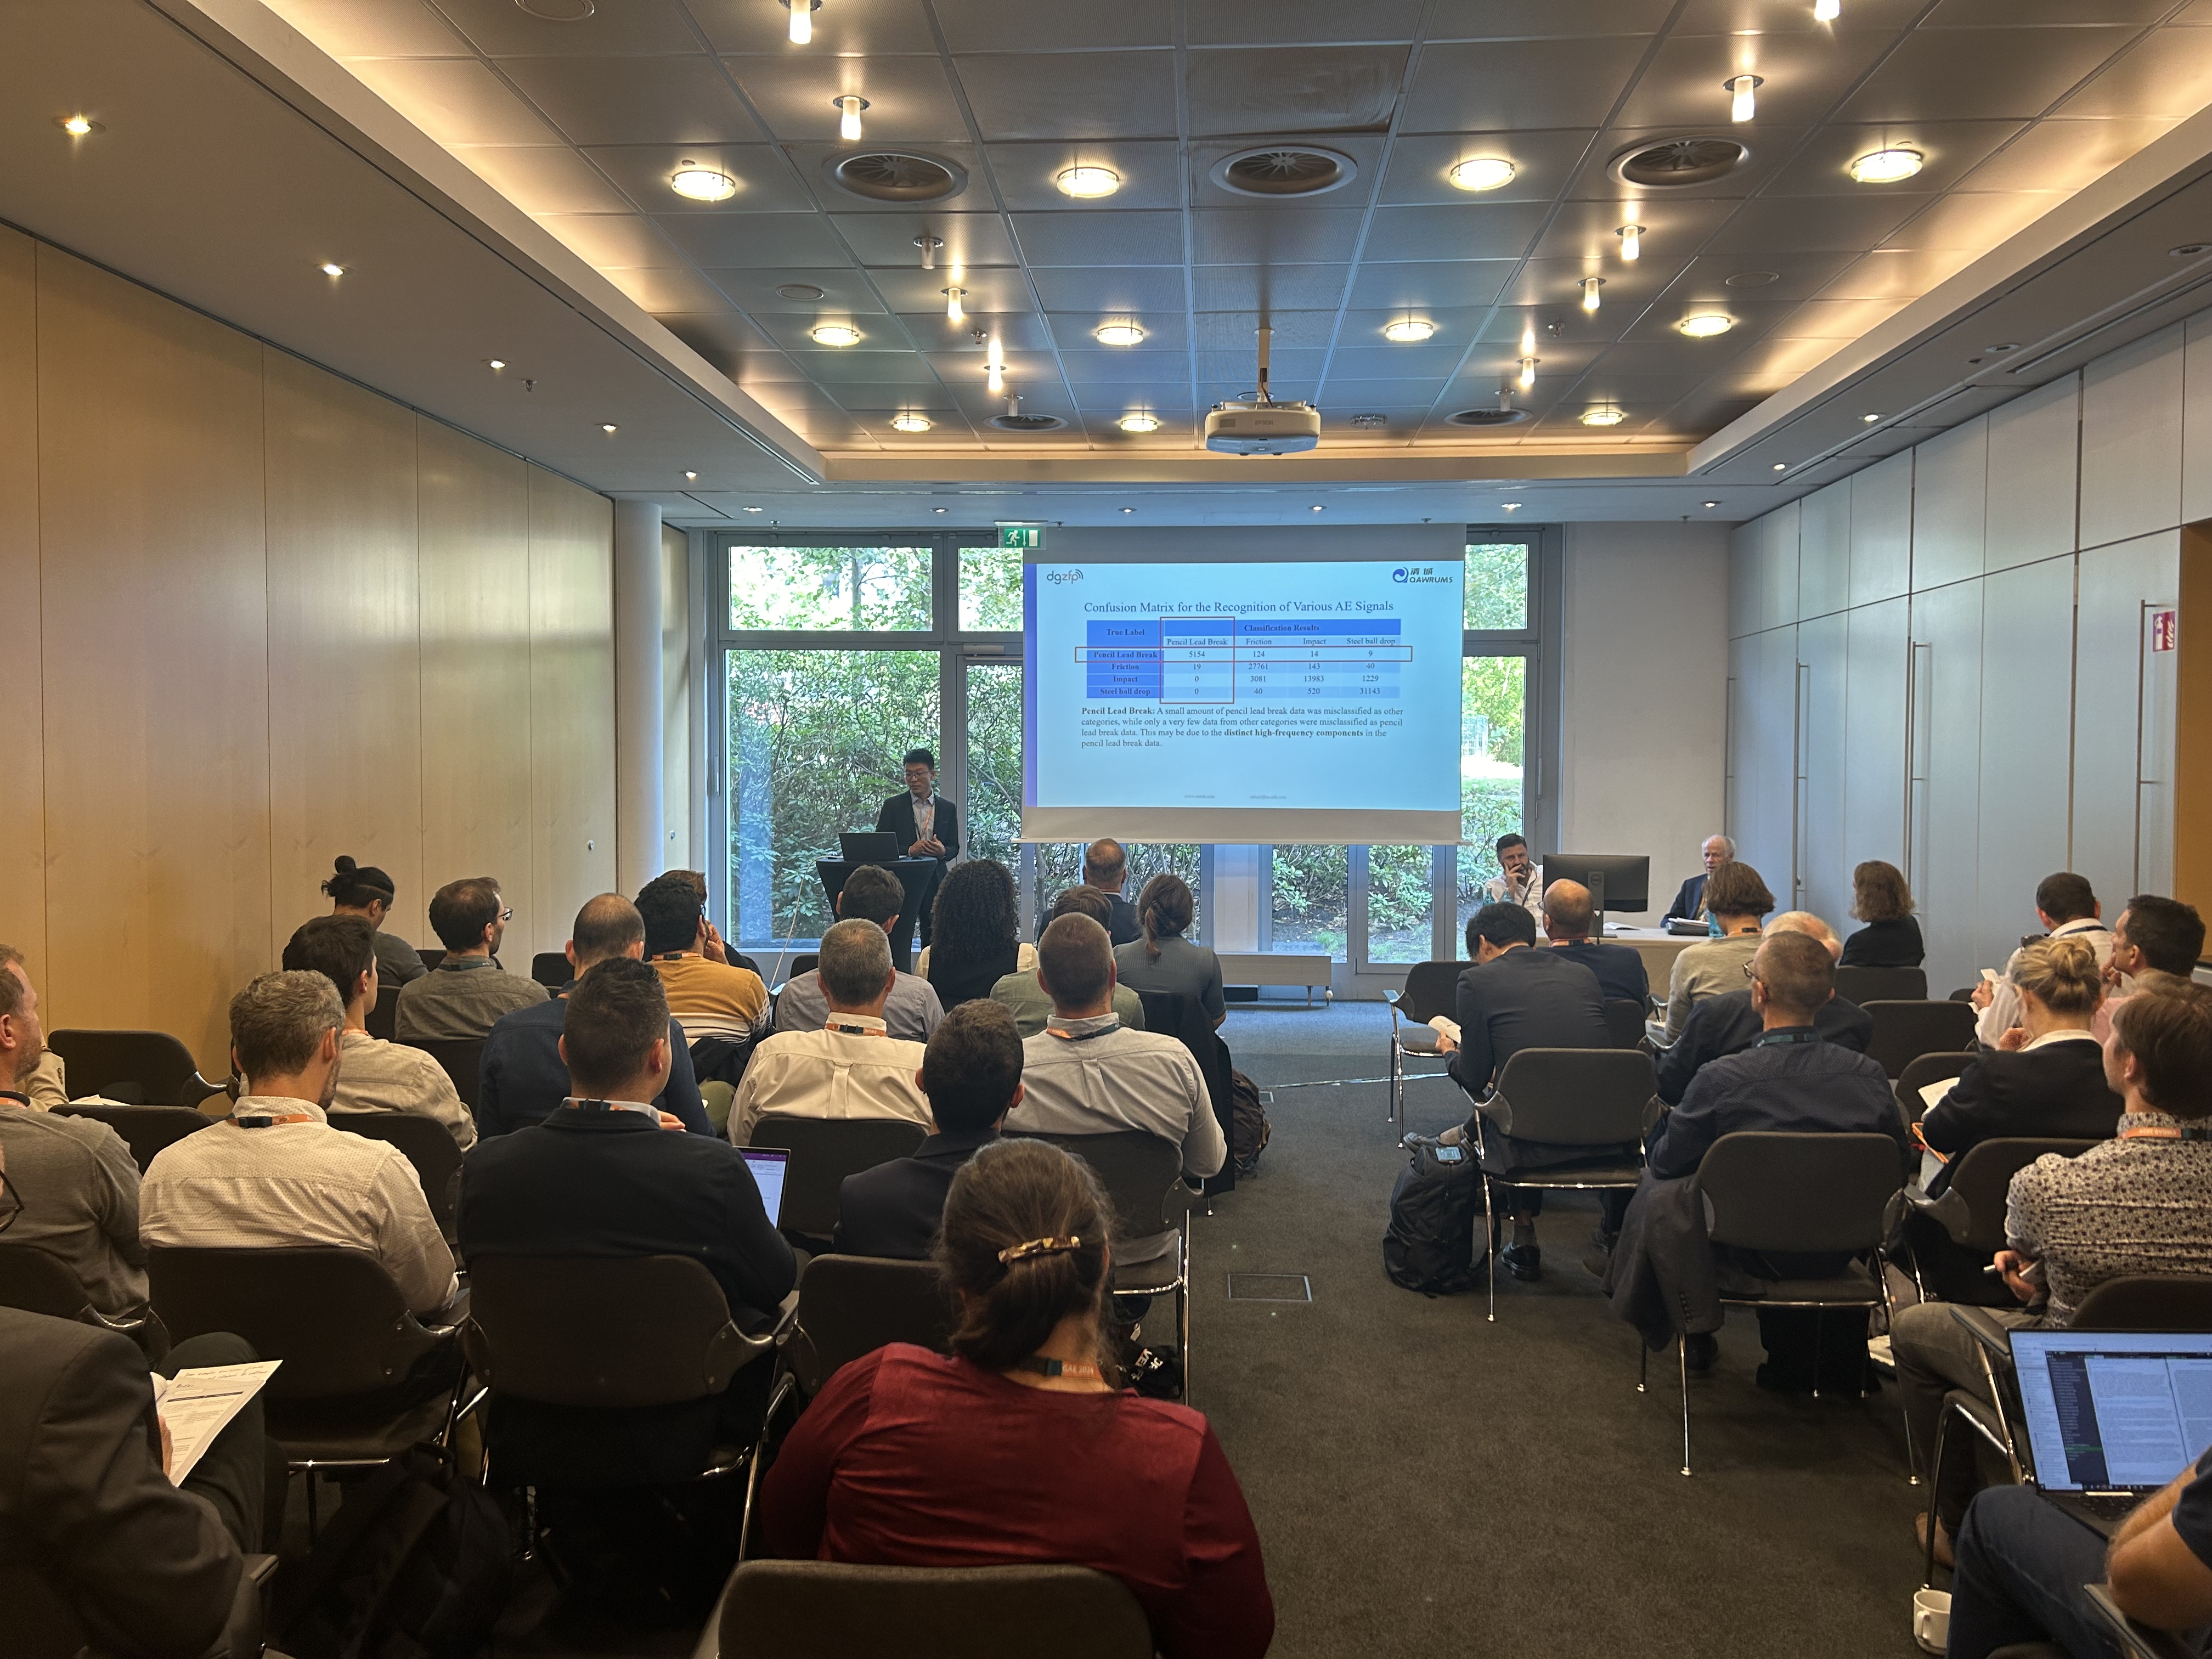 We want to extend our heartfelt thanks to everyone who visited our booth — your support truly inspires us. It was a privilege to connect with industry leaders, experts, and peers, sharing insights into our innovative solutions.     Although the exhibition has concluded, we look forward to the potential collaborations ahead. We are excited about further discussions and partnerships in the field of <a href="/blog/acoustic-emission-testing.html" target="_blank">acoustic emission</a> and IoT technology. If you would like to learn more about our products or seek additional information, please visit our website or check out our event page for updates: <a href="https://www.aendt.com/acoustic/news/event/">https://www.aendt.com/acoustic/news/event/ </a> Thank you for your support of <a href="https://www.aendt.com" target="_blank">QAWRUMS</a> — we can’t wait to see you again  |
| json metadata | {"tags":["iot"],"image":["https://cdn.steemitimages.com/DQmZVtfaUBG7QK4fLaegbh7UHtyLi2eWb4vhNN1SJXEXMk1/ewgae2024-1.jpg","https://cdn.steemitimages.com/DQmSi9q8aPjR6ETzNyMdUY7Q9DCM627yqQWiZt2XjXCzSCZ/ewgae2024-2.jpg","https://cdn.steemitimages.com/DQmarenS3T7EPi9gdXqYEKxHyXyg1viEDJNaTibgpzeCHrH/ewgae2024-3.jpg","https://cdn.steemitimages.com/DQmT7zrxJ45uskvbGmtkEFinfPCbhyhQNNui2qLbWrr6yT8/ewgae2024-4.jpg","https://cdn.steemitimages.com/DQmTC1snVVbsKkjbwics9PFJqNy7g1cadvWkYACspFKySBi/ewgae2024-5.jpg","https://cdn.steemitimages.com/DQmVCoyYnuka3ef6UpKiHRAtbn3aAsP7LaA6Yi1rYHaKsym/ewgae2024-6.jpg"],"links":["https://www.aendt.com","https://ewgae2024.com/frontend/index.php","/acoustic/products/p2/","/blog/acoustic-emission-testing.html","https://www.aendt.com/acoustic/news/event/"],"app":"steemit/0.2","format":"markdown"} |
| parent author | |
| parent permlink | iot |
| permlink | qawrums-successfully-concludes-participation-in-ewgae-2024 |
| title | QAWRUMS Successfully Concludes Participation in EWGAE 2024 |
| Transaction Info | Block #88924387/Trx 136b4eee90aeee41e2d0f6c86c14f9a3dedaffbb |
View Raw JSON Data
{
"block": 88924387,
"op": [
"comment",
{
"author": "barrylee",
"body": "We are delighted to announce that <a href=\"https://www.aendt.com\">QAWRUMS</a> recently participated as a proud sponsor at <a href=\"https://ewgae2024.com/frontend/index.php\" target=\"_blank\">EWGAE 2024</a>. Over the course of three exciting days, our team showcased our cutting-edge <a href=\"/acoustic/products/p2/\" target=\"_blank\">IoT AE systems</a>, complete with live demonstrations that received enthusiastic feedback from attendees.\n\n\nDuring the event, we also presented our oral paper titled “Research on the Application of AI in Acoustic Emission Waveform Data Pattern Recognition.” This presentation explored the exciting intersection of artificial intelligence and <a href=\"/blog/acoustic-emission-testing.html\" target=\"_blank\">acoustic emission technology</a>, sparking engaging discussions among participants.\n\n\n\n\nWe want to extend our heartfelt thanks to everyone who visited our booth — your support truly inspires us. It was a privilege to connect with industry leaders, experts, and peers, sharing insights into our innovative solutions.\n\n\n\n\n\n\n\n\n\n\n\n\nAlthough the exhibition has concluded, we look forward to the potential collaborations ahead. We are excited about further discussions and partnerships in the field of <a href=\"/blog/acoustic-emission-testing.html\" target=\"_blank\">acoustic emission</a> and IoT technology.\n\nIf you would like to learn more about our products or seek additional information, please visit our website or check out our event page for updates: <a href=\"https://www.aendt.com/acoustic/news/event/\">https://www.aendt.com/acoustic/news/event/ </a>\n\nThank you for your support of <a href=\"https://www.aendt.com\" target=\"_blank\">QAWRUMS</a> — we can’t wait to see you again\n",
"json_metadata": "{\"tags\":[\"iot\"],\"image\":[\"https://cdn.steemitimages.com/DQmZVtfaUBG7QK4fLaegbh7UHtyLi2eWb4vhNN1SJXEXMk1/ewgae2024-1.jpg\",\"https://cdn.steemitimages.com/DQmSi9q8aPjR6ETzNyMdUY7Q9DCM627yqQWiZt2XjXCzSCZ/ewgae2024-2.jpg\",\"https://cdn.steemitimages.com/DQmarenS3T7EPi9gdXqYEKxHyXyg1viEDJNaTibgpzeCHrH/ewgae2024-3.jpg\",\"https://cdn.steemitimages.com/DQmT7zrxJ45uskvbGmtkEFinfPCbhyhQNNui2qLbWrr6yT8/ewgae2024-4.jpg\",\"https://cdn.steemitimages.com/DQmTC1snVVbsKkjbwics9PFJqNy7g1cadvWkYACspFKySBi/ewgae2024-5.jpg\",\"https://cdn.steemitimages.com/DQmVCoyYnuka3ef6UpKiHRAtbn3aAsP7LaA6Yi1rYHaKsym/ewgae2024-6.jpg\"],\"links\":[\"https://www.aendt.com\",\"https://ewgae2024.com/frontend/index.php\",\"/acoustic/products/p2/\",\"/blog/acoustic-emission-testing.html\",\"https://www.aendt.com/acoustic/news/event/\"],\"app\":\"steemit/0.2\",\"format\":\"markdown\"}",
"parent_author": "",
"parent_permlink": "iot",
"permlink": "qawrums-successfully-concludes-participation-in-ewgae-2024",
"title": "QAWRUMS Successfully Concludes Participation in EWGAE 2024"
}
],
"op_in_trx": 0,
"timestamp": "2024-09-25T10:19:15",
"trx_id": "136b4eee90aeee41e2d0f6c86c14f9a3dedaffbb",
"trx_in_block": 1,
"virtual_op": 0
}2024/09/24 10:59:57
2024/09/24 10:59:57
| author | barrylee |
| permlink | notable-manufacturers-of-acoustic-emission-ae-testing-equipment |
| voter | vanlifetravel |
| weight | 10000 (100.00%) |
| Transaction Info | Block #88896457/Trx 3c923570f5d0f65f3cf83e866e864aa30b9b5fa8 |
View Raw JSON Data
{
  "block": 88896457,
  "op": [
    "vote",
    {
      "author": "barrylee",
      "permlink": "notable-manufacturers-of-acoustic-emission-ae-testing-equipment",
      "voter": "vanlifetravel",
      "weight": 10000
    }
  ],
  "op_in_trx": 0,
  "timestamp": "2024-09-24T10:59:57",
  "trx_id": "3c923570f5d0f65f3cf83e866e864aa30b9b5fa8",
  "trx_in_block": 3,
  "virtual_op": 0
}barryleepublished a new post: notable-manufacturers-of-acoustic-emission-ae-testing-equipment2024/09/24 10:41:27
barryleepublished a new post: notable-manufacturers-of-acoustic-emission-ae-testing-equipment
2024/09/24 10:41:27
| author | barrylee |
| body | Acoustic Emission (AE) testing is a powerful non-destructive testing method used to monitor the integrity of materials and structures by detecting and analyzing sound waves emitted during stress and deformation. Here’s a detailed list of some of the leading manufacturers in the AE testing equipment sector, along with descriptions of their offerings and expertise. 1. **Vallen Systeme GmbH** — **Description**: Vallen Systeme is a leader in Acoustic Emission technology, focusing on comprehensive solutions for structural health monitoring and materials testing. Their systems are designed for various applications, providing data acquisition systems and software that enhance the monitoring process. — **Website**: [vallen.de](https://www.vallen.de) 2. **Physical Acoustics Corporation (PAC)** — **Description**: A pioneer in AE technology, PAC offers a wide array of AE systems and software tailored for industrial applications. Their equipment is widely used in sectors such as aerospace, automotive, and energy, specifically for detecting and analyzing material defects. — **Website**: [physicalacoustics.com](https://www.physicalacoustics.com) 3. **Krautkramer (Baker Hughes)** — **Description**: Krautkramer is known for its high-quality ultrasonic and AE testing equipment. They serve various industries, including oil and gas, manufacturing, and construction, with a strong emphasis on non-destructive testing solutions. — **Website**: [bakerhughes.com](https://www.bakerhughes.com) 4. **MISTRAS Group, Inc.** — **Description**: A global leader in asset protection solutions, MISTRAS provides extensive AE testing services and equipment. Their focus is on monitoring the integrity of critical assets across multiple sectors, including power generation and transportation. — **Website**: [mistrasgroup.com](https://www.mistrasgroup.com) 5. **QingCheng AE Institute Ltd. (China)** — **Description**: A significant manufacturer in China, QingCheng specializes in the development and application of AE technology. They offer a variety of AE systems tailored to meet the needs of both local and international markets. — **Website**: [aendt.com](http://www.aendt.com) 6. **NDT Systems, Inc.** — **Description**: NDT Systems focuses on advanced non-destructive testing equipment, including AE systems designed for monitoring diverse materials in industries such as aerospace, automotive, and civil engineering. — **Website**: [ndtsystems.com](https://www.ndtsystems.com) 7. **Olympus Corporation** — **Description**: A well-established name in the inspection and measurement industry, Olympus provides a range of reliable AE testing equipment for applications across manufacturing, aerospace, and civil engineering. — **Website**: [olympus-ims.com](https://www.olympus-ims.com) 8. **RST Instruments Ltd.** — **Description**: RST specializes in AE monitoring systems for geotechnical and structural applications, offering solutions that monitor the health of structures such as dams, tunnels, and buildings to ensure their safety and reliability. — **Website**: [rstinstruments.com](https://www.rstinstruments.com) 9. **GE Measurement & Control (Baker Hughes)** — **Description**: GE Measurement & Control provides various non-destructive testing solutions, including AE systems, emphasizing enhanced industrial safety and performance through advanced monitoring technologies. — **Website**: [bakerhughes.com](https://www.bakerhughes.com) 10. **Sonotronic Nagel GmbH** — **Description**: Known for its AE testing systems primarily serving the automotive and aerospace sectors, Sonotronic offers solutions designed to ensure product integrity and safety through effective monitoring. — **Website**: [sonotronic.de](https://www.sonotronic.de) 11. **Zetec Inc.** — **Description**: Zetec provides innovative non-destructive testing solutions, including AE systems tailored for various industrial applications, focusing on high-performance equipment and software to meet stringent quality standards. — **Website**: [zetec.com](https://www.zetec.com) 12. **AETech (Acoustic Emission Technologies)** — **Description**: AETech specializes in AE monitoring systems and solutions for various industries, including civil engineering and manufacturing, designed to effectively monitor structural integrity and material performance. — **Website**: [aetech.com](http://www.aetech.com) ### Conclusion The companies listed above represent some of the most notable manufacturers in the Acoustic Emission testing equipment sector. Each of these manufacturers brings specialized expertise and innovative solutions to the industry, making significant contributions to the safety and reliability of materials and structures across various sectors. As the demand for non-destructive testing continues to grow, these companies are at the forefront of developing advanced technologies that enhance structural health monitoring and integrity assessment. If you have any more questions or need further insights about AE testing or its applications, feel free to ask! — - This expanded post provides a comprehensive overview, making it suitable for readers seeking detailed information about AE testing equipment manufacturers. |
| json metadata | {"tags":["manufacturer"],"links":["https://www.vallen.de","https://www.physicalacoustics.com","https://www.bakerhughes.com","https://www.mistrasgroup.com","http://www.aendt.com","https://www.ndtsystems.com","https://www.olympus-ims.com","https://www.rstinstruments.com","https://www.sonotronic.de","https://www.zetec.com","http://www.aetech.com"],"app":"steemit/0.2","format":"markdown"} |
| parent author | |
| parent permlink | manufacturer |
| permlink | notable-manufacturers-of-acoustic-emission-ae-testing-equipment |
| title | Notable Manufacturers of Acoustic Emission (AE) Testing Equipment |
| Transaction Info | Block #88896089/Trx 2c52eebdc26a6659898a2cc84a87cab7c9328f70 |
View Raw JSON Data
{
  "block": 88896089,
  "op": [
    "comment",
    {
      "author": "barrylee",
      "body": "Acoustic Emission (AE) testing is a powerful non-destructive testing method used to monitor the integrity of materials and structures by detecting and analyzing sound waves emitted during stress and deformation. Here’s a detailed list of some of the leading manufacturers in the AE testing equipment sector, along with descriptions of their offerings and expertise.\n\n1. **Vallen Systeme GmbH**\n— **Description**: Vallen Systeme is a leader in Acoustic Emission technology, focusing on comprehensive solutions for structural health monitoring and materials testing. Their systems are designed for various applications, providing data acquisition systems and software that enhance the monitoring process.\n— **Website**: [vallen.de](https://www.vallen.de)\n\n2. **Physical Acoustics Corporation (PAC)**\n— **Description**: A pioneer in AE technology, PAC offers a wide array of AE systems and software tailored for industrial applications. Their equipment is widely used in sectors such as aerospace, automotive, and energy, specifically for detecting and analyzing material defects.\n— **Website**: [physicalacoustics.com](https://www.physicalacoustics.com)\n\n3. **Krautkramer (Baker Hughes)**\n— **Description**: Krautkramer is known for its high-quality ultrasonic and AE testing equipment. They serve various industries, including oil and gas, manufacturing, and construction, with a strong emphasis on non-destructive testing solutions.\n— **Website**: [bakerhughes.com](https://www.bakerhughes.com)\n\n4. **MISTRAS Group, Inc.**\n— **Description**: A global leader in asset protection solutions, MISTRAS provides extensive AE testing services and equipment. Their focus is on monitoring the integrity of critical assets across multiple sectors, including power generation and transportation.\n— **Website**: [mistrasgroup.com](https://www.mistrasgroup.com)\n\n5. **QingCheng AE Institute Ltd. (China)**\n— **Description**: A significant manufacturer in China, QingCheng specializes in the development and application of AE technology. They offer a variety of AE systems tailored to meet the needs of both local and international markets.\n— **Website**: [aendt.com](http://www.aendt.com)\n\n6. **NDT Systems, Inc.**\n— **Description**: NDT Systems focuses on advanced non-destructive testing equipment, including AE systems designed for monitoring diverse materials in industries such as aerospace, automotive, and civil engineering.\n— **Website**: [ndtsystems.com](https://www.ndtsystems.com)\n\n7. **Olympus Corporation**\n— **Description**: A well-established name in the inspection and measurement industry, Olympus provides a range of reliable AE testing equipment for applications across manufacturing, aerospace, and civil engineering.\n— **Website**: [olympus-ims.com](https://www.olympus-ims.com)\n\n8. **RST Instruments Ltd.**\n— **Description**: RST specializes in AE monitoring systems for geotechnical and structural applications, offering solutions that monitor the health of structures such as dams, tunnels, and buildings to ensure their safety and reliability.\n— **Website**: [rstinstruments.com](https://www.rstinstruments.com)\n\n9. **GE Measurement & Control (Baker Hughes)**\n— **Description**: GE Measurement & Control provides various non-destructive testing solutions, including AE systems, emphasizing enhanced industrial safety and performance through advanced monitoring technologies.\n— **Website**: [bakerhughes.com](https://www.bakerhughes.com)\n\n10. **Sonotronic Nagel GmbH**\n— **Description**: Known for its AE testing systems primarily serving the automotive and aerospace sectors, Sonotronic offers solutions designed to ensure product integrity and safety through effective monitoring.\n— **Website**: [sonotronic.de](https://www.sonotronic.de)\n\n11. **Zetec Inc.**\n— **Description**: Zetec provides innovative non-destructive testing solutions, including AE systems tailored for various industrial applications, focusing on high-performance equipment and software to meet stringent quality standards.\n— **Website**: [zetec.com](https://www.zetec.com)\n\n12. **AETech (Acoustic Emission Technologies)**\n— **Description**: AETech specializes in AE monitoring systems and solutions for various industries, including civil engineering and manufacturing, designed to effectively monitor structural integrity and material performance.\n— **Website**: [aetech.com](http://www.aetech.com)\n\n### Conclusion\n\nThe companies listed above represent some of the most notable manufacturers in the Acoustic Emission testing equipment sector. Each of these manufacturers brings specialized expertise and innovative solutions to the industry, making significant contributions to the safety and reliability of materials and structures across various sectors. As the demand for non-destructive testing continues to grow, these companies are at the forefront of developing advanced technologies that enhance structural health monitoring and integrity assessment.\n\nIf you have any more questions or need further insights about AE testing or its applications, feel free to ask!\n\n— -\n\nThis expanded post provides a comprehensive overview, making it suitable for readers seeking detailed information about AE testing equipment manufacturers.",
      "json_metadata": "{\"tags\":[\"manufacturer\"],\"links\":[\"https://www.vallen.de\",\"https://www.physicalacoustics.com\",\"https://www.bakerhughes.com\",\"https://www.mistrasgroup.com\",\"http://www.aendt.com\",\"https://www.ndtsystems.com\",\"https://www.olympus-ims.com\",\"https://www.rstinstruments.com\",\"https://www.sonotronic.de\",\"https://www.zetec.com\",\"http://www.aetech.com\"],\"app\":\"steemit/0.2\",\"format\":\"markdown\"}",
      "parent_author": "",
      "parent_permlink": "manufacturer",
      "permlink": "notable-manufacturers-of-acoustic-emission-ae-testing-equipment",
      "title": "Notable Manufacturers of Acoustic Emission (AE) Testing Equipment"
    }
  ],
  "op_in_trx": 0,
  "timestamp": "2024-09-24T10:41:27",
  "trx_id": "2c52eebdc26a6659898a2cc84a87cab7c9328f70",
  "trx_in_block": 1,
  "virtual_op": 0
}barryleepublished a new post: aboveground-storage-tank-ast-bottom-plate-corrosion-detection-monitoring2024/09/20 10:24:09
barryleepublished a new post: aboveground-storage-tank-ast-bottom-plate-corrosion-detection-monitoring
2024/09/20 10:24:09
| author | barrylee |
| body |  1.<a href="https://www.aendt.com/acoustic/solutions/s8/">Conventional AE Tank Corrosion Detection Scheme</a> Principle When there are corrosion defects on the bottom plate of the storage tank, the corrosion products will peel off and fall off, generating acoustic emission signals; when the bottom plate leaks, the medium flows and generates acoustic emission signals. The sensor array at the bottom of the tank wall receives the signal, and the acoustic emission acquisition instrument processes and analyzes the signal to evaluate the corrosion status of the tank bottom structure. System Composition: 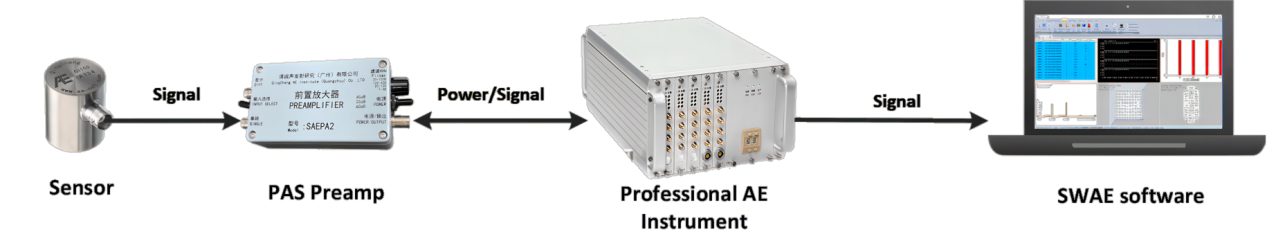 Acoustic emission sensor, preamplifier, acoustic emission acquisition instrument, computer software. 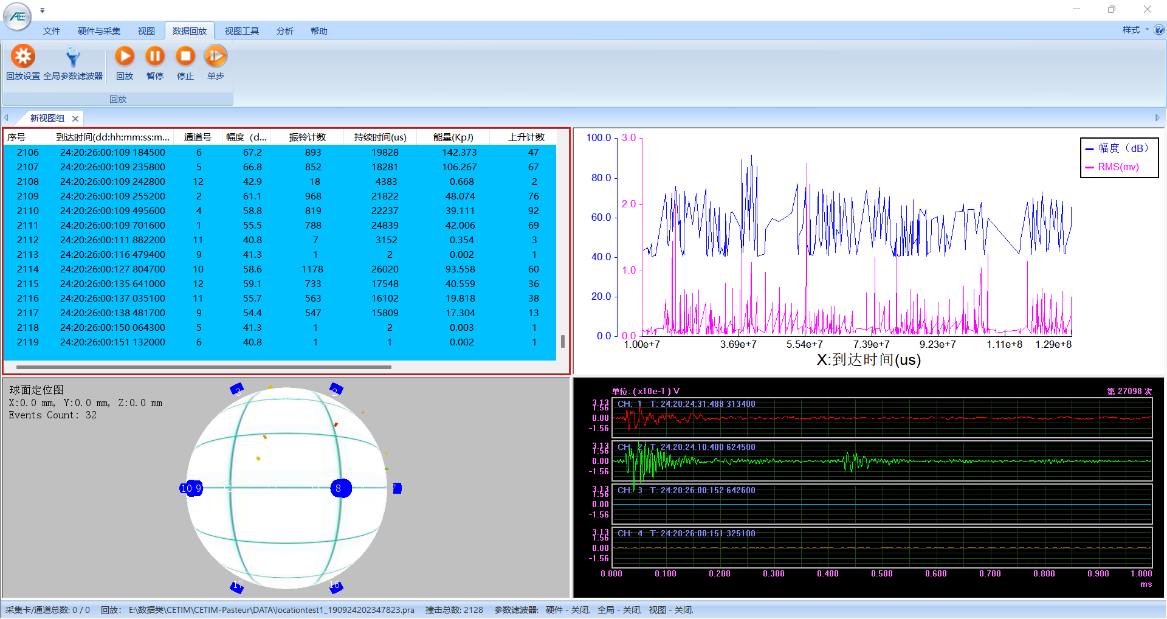 Device ModuleSAEU3H Multichannel AE detection systemOperation systemWindowsChannelsMulti-channels, cascadable to 100+ channelsAcoustic emission sensorsGI40/ G40 for tank bottom corrosion; GI150 for tank body cracksSampling rate10M/s, 16-bitWaveform collectionSupportAnalog filtersHigh-pass filters: 20kHz, 100kHz, 400kHz; Low-pass filters: 100kHz, 400kHz, 1200kHzDigital filters1KHz-2.5MHzDimension4-channel chassis: 320mm × 125mm × 50mm; (Length x Width x Height) 20-channel chassis: 308mm × 225mm × 133mm; (Length x Width x Height) 48-channel chassis: 308mm × 368mm × 133mm; (Length x Width x Height)AdvantagesUSB3.0 high-speed data transmission, good expansion ability, stable performance, accurate defect location function. Suitable for regular detection. SWAE Software SWAE acoustic emission system software is a combination of real-time acquisition and analysis and post-analysis software. It supports two types of AE product series, SAEU3H instrument and RAEM1 series (RAEM1 and RAEM1–6) respectively. SWAE can perform data acquisition, playback and analysis on the equipment. Its main functions are location map, correlation graphs, data table, and frequency domain waveform map, etc. Xingsan Joint Station Case: online detection of AE from storage tanks Sensor Arrangement: For example, nine sensors were evenly arranged around the outer wall about 50 cm above the bottom plate, avoiding discontinuous locations such as pipes and manholes as much as possible, with a horizontal spacing of about 7.8 meters. Fig 1.1 Sensor Arrangement Data Collection and Analysis: Acoustic emission testing of the tank for 2 hours: Fig 1.2 Tank #2 Channel — Hits Correlation Graph 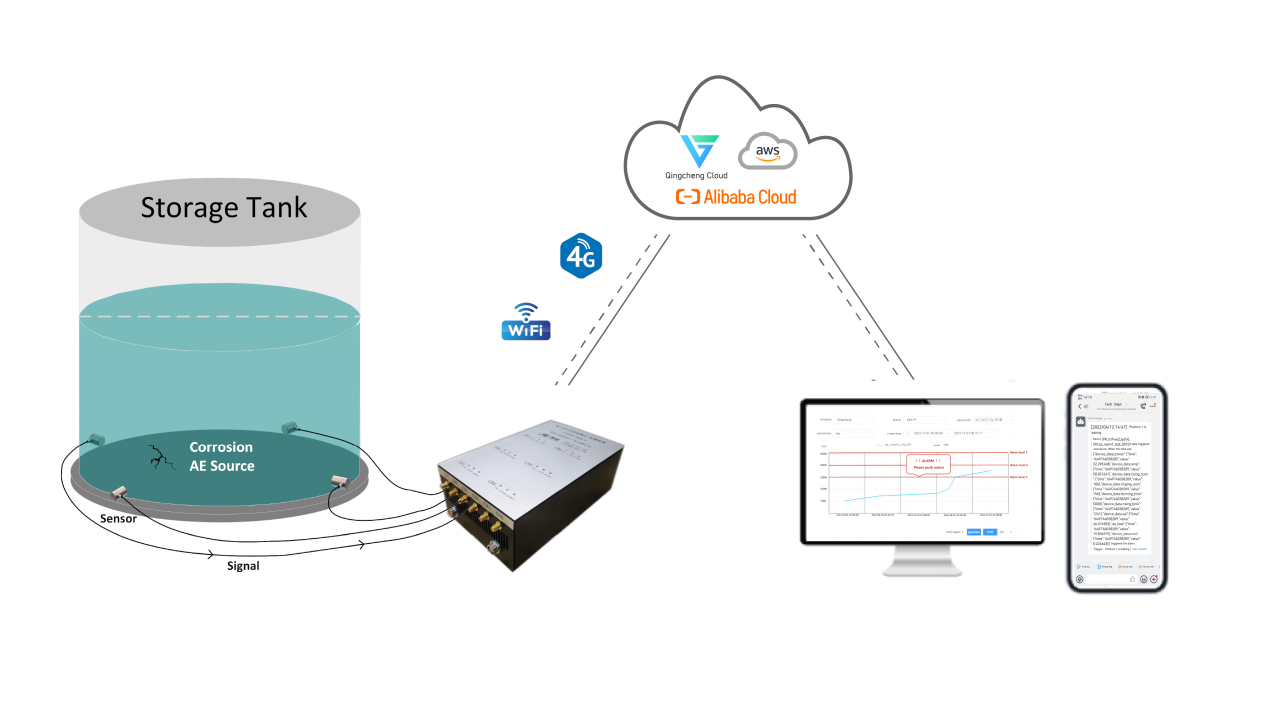 Fig 1.3 Tank #2 Arrival time — Energy Correlation Graph 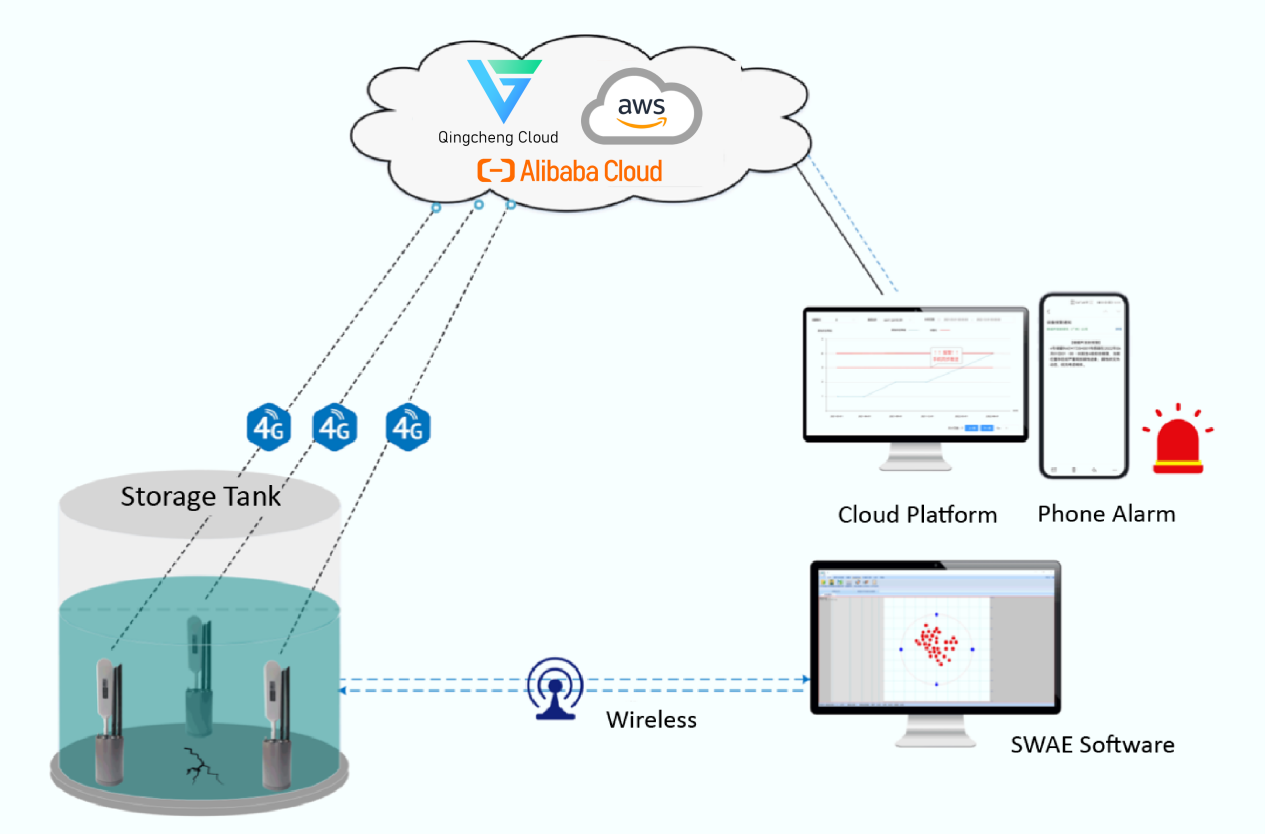 Fig 1.4 Tank #2 TDOA Location Map for 2h Fig 1.5 Location Map when Pressure Maintaining Test results According to Section 9.2 of the standard “JB/T 10764–2023”, the time difference location analysis and classification methods of the tank bottom acoustic emission source were adopted. The length of 10% of the diameter was used to delineate a circular assessment area. Perform local analysis on all location sources with relatively concentrated events within the evaluation area and calculate the number of location events E per hour. According to Figure 1.5, three were 173 effective events during pressure maintenance and there were 3 relatively concentrated locating areas, defined as S1, S2, and S3. S1: E1=7; S2: E2=10; S3: E3=4. The reference event number per hour criterion was set as a=10, based on experiences results using the same testing equipment and settings under the same environment. Considering the liquid level height during pressure maintenance and the comprehensive acoustic emission characteristic parameters, the classification result was Level I, which means “there are no signs of local corrosion, and the corrosion condition is minimal”. The repairing suggestion: do not consider repair. It is recommended to conduct acoustic emission testing again within 6 years or open the tank at an appropriate time to observe the dynamic changes of corrosion on the tank bottom plate. 2.IoT Acoustic Emission Wireless Online Monitoring Solutions 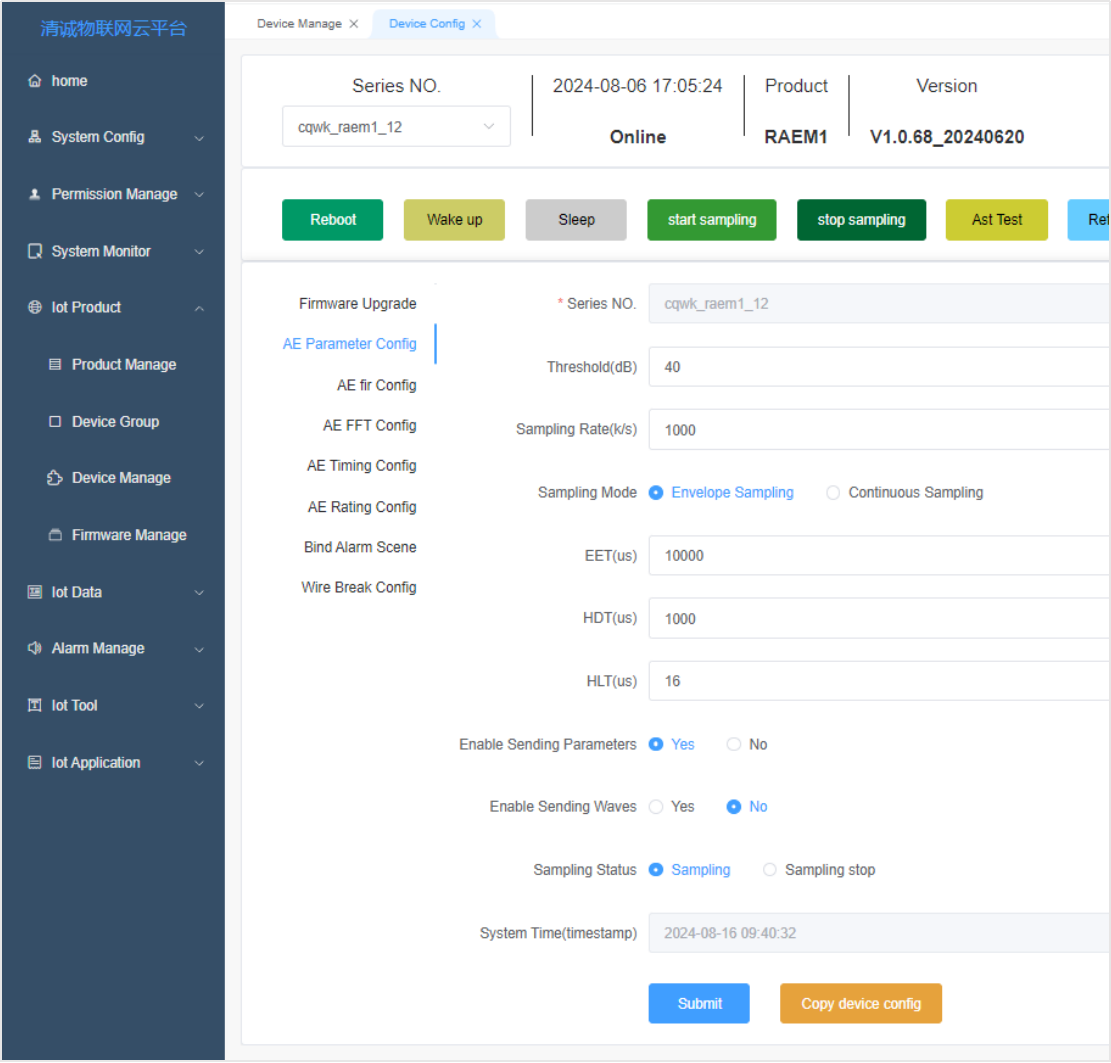 2.1 Centralized Solution Based on RAEM1–6 Principle: When corrosion defects or leakage occur on the bottom plate of the storage tank, acoustic emission waves are generated. The sensors receive the acoustic waves, which are then processed and analyzed by the acoustic emission acquisition unit. The result signals are transmitted to the cloud server through a 4G/WiFi network, and users log in to the cloud platform (private cloud/Qingcheng cloud) to remotely view the data and set rating criteria. The system automatically provides rating results based on the criteria. Once the alarm threshold is reached, an alarm is automatically pushed. System Composition: Acoustic emission sensors, acoustic emission acquisition instrument (signal acquisition and analysis and communication), cloud servers (cloud server IoT platform/LAN server/computer/mobile phone, etc.), customer terminals (mobile phone, PC, etc.). Device ModuleRAEM1–6 Multichannel AE systemOperation systemLinuxChannels6 channels, can be cascaded to 100+ channelsAcoustic emission sensorsGI40/ G40 for tank bottom corrosion; GI150 for tank body cracksSampling rate2M/s, 16-bitWaveform collectionSupportAnalog filtersHigh-pass filters: 30kHz, 125kHz; Low-pass filters: 80kHz, 175kHzDigital filters1KHz-1.0MHzCommunicationWiFi/ 4GDimensionLength x Width x Height: 22cm × 13cm × 8cmAdvantagesBased on the Linux operating system, it has stable performance, wireless communication capability, and is suitable for long-term remote unmanned monitoring. The devices can be cascaded to form a large-scale monitoring system. 2.2 Distributed Solution Based on RAEM1 Principle: When corrosion defects or leakage occur on the bottom plate of the storage tank, acoustic waves (acoustic emission) are generated. The acoustic emission acquisition unit receives the signals, processes and analyzes them, and transmits them to the cloud server through a 4G/WiFi/LAN network. Users log in to the cloud platform (private cloud/Qingcheng cloud) to remotely view data and set rating criteria. The system automatically gives rating results based on the criteria. Once the alarm threshold is reached, an alarm is automatically pushed. System Composition: Acoustic emission acquisition unit (sensors, signal acquisition and analysis, communication), cloud server (cloud server IoT platform/LAN server/computer/mobile phone, etc.), client terminal (mobile phone, PC, etc.). Device ModuleRAEM1Operation systemLinuxChannelsSingle channelAcoustic emission sensorsGI40/ G40 for tank bottom corrosion; GI150 for tank body cracksSampling rate2M/s, 16-bitWaveform collectionSupportAnalog filtersHigh-pass filters: 30kHz, 125kHz; Low-pass filters: 80kHz, 175kHzDigital filters1KHz-1.0MHzCommunicationWiFi/ 4G/ RS-485AdvantagesRAEM1 has built-in sensors, signal acquisition, signal processing, data transmission, battery power supply, and wireless clock synchronization. Its strong magnetic bottom can be directly attached to the metal tank wall during installation. Generally applicable to metal storage tanks, it can be remotely monitored without human intervention or can do the traditional AE testing on-site. 2.3 Chained Solution Based on RAEM1 Principle: When corrosion defects or leakage occur on the bottom plate of the storage tank, acoustic waves (acoustic emission) are generated. The acoustic emission acquisition unit receives the signals, processes and analyzes them, and transmits them to the cloud server through the PoE router. Users log in to the cloud platform (private cloud/Qingcheng cloud) to remotely view data and set rating criteria. The system automatically gives rating results based on the criteria. Once the alarm threshold is reached, an alarm is automatically pushed. System Composition: Acoustic emission acquisition unit (sensors, signal acquisition and analysis), router, cloud server (cloud server IoT platform/LAN server/computer/mobile phone, etc.), client terminal (mobile phone, PC, etc.). Device ModuleBWM1ChannelsSingle channel; multiple channels in series connectionAcoustic emission sensorsGI40/ G40 for tank bottom corrosion; GI150 for tank body cracksSampling rate2M/s, 16-bitWaveform collectionSupportAnalog filtersHigh-pass filters: 30kHz, 125kHz; Low-pass filters: 80kHz, 175kHzDigital filters256-order FIR filter, any pass-through, high-pass, low-pass and band-pass settable from 0kHz-1000kHzCommunicationEthernetDimension507*50*43mm (waterproof plug included)AdvantagesThe layout of this scheme is in chain series connection. The chain connection refers to the AE acquisition units are connected in series via PoE using Ethernet cables. Data transmission and power supply are both achieved through PoE, simplifying the wiring needs. IIoT Wireless Online Monitoring System Acquisition Work Flow Cloud Computing Process Work Flow QC Cloud Main Functions Cloud platform remote parameter settings: acquisition mode, threshold, sampling rate, filtering range, HDT, HLT, EET and other parameters. Cloud platform data display: real-time/historical (parameter/ waveform) data, rating results, parameter comparison results display. Automatic alarm notifications: Alarm information is pushed to the clients through SMS, emails, and other methods. Automatic report generation: After filling in relevant information through the cloud platform, the system automatically generates a report. And download the report from the cloud platform with one clicking. Case Study ①The test data results of 6 storage tanks of the same size and medium under the same usage conditions, with a pressure holding time of 1 hour, are shown in the table: Tank 1Tank 2Tank 3Tank 4Tank 5Tank 6Total Hits2034886896172038768984968Total Events234017823925600268180Max Hits78343783000688763400420Min Hits456360333321487365Corrosion LevelIIIIIIIVIIICorrosion StatusThere are obvious signs of localized corrosion.No signs of localized corrosion.There are slight signs of localized corrosion present.There are signs of severe localized corrosion.There are slight signs of localized corrosion present.No signs of localized corrosion.Maintenance SuggestionConsider maintenanceNo maintenance requiredNo need to consider maintenance in the near futurePrioritize maintenance as the top priorityNo need to consider maintenance in the near futureNo maintenance required According to Section 9 of the standard ‘JB/T 10764–2023 Non destructive Testing — Acoustic Emission Testing and Evaluation Method for Atmospheric Pressure Metal Storage Tanks’, the classification of acoustic emission sources based on cluster zone analysis for tank bottom plates in Table 3 was that K=500 (Hits per hour for an independent channel). Obtained the detailed classification levels of each storage tank as shown in the table above. Based on the review of historical operation records and other data of storage tanks, it was determined that tank #2 and #6 were intact tanks (Level I) and do not require maintenance; Tank #4 was a tank with severe corrosion of its bottom plate (greater than Level III) and requires the highest priority for maintenance. The same method can be used to perform the same tank level analysis on the entire process of tank loading and the specific processes of pressure rise and maintenance. 1.Cloud Platform Display Users can configure and monitor remotely through the cloud platform, and upload data to the cloud platform for display and analysis. Figure 1: Channel 1 of Tank 4 (RAEM1_TJSH-001) system rating levels from the 3rd, 6th, 9th, 12th, 15th, and 18th months, which are level I, I, I, II, II, III respectively. 2.Mobile Phone Notifications When the alarm limit is reached, the phone pushes the alarm notifications. Alarm methods: Mini program, email, SMS, APP. According to the data of Tank 4 on the cloud platform, significant corrosion (Level III) was observed during the 6th monitoring. The mobile phone synchronously receives alarm notifications, including information such as tank level, status, and repair suggestions. 3.SWAE Software After downloading data from the cloud, in-depth analysis can be conducted using Qingcheng’s SWAE software, or it can be directly sent to SWAE software for real-time analysis and processing. Case: Data from holding pressure for 1 hour. Total number of hits: 10617, maximum 3000 (Channel 1), minimum 333 (Channel 7), total event number: 239. There is slight localized corrosion. Through Qingcheng’s SWAE software, data can be viewed and corrosion sites can be located. Tank bottom location map (time difference location) Channel — hits correlation graph (zone location) Automatic detection and rating, remote viewing, proactive alarm push, in compliance with standards: Automatically detect and obtain data according to the set time. After setting the K value according to the standard content, the K value can be used as an automatic rating criterion for automatic data processing, and the corrosion status level of each storage tank required by the standard content can be automatically analyzed. The corrosion status level and specific data of the storage tank can be accessed anytime on the cloud IoT platform through computers and mobiles at any location. Setting the alarm level, such as Level III alarm, will automatically push the alarm notifications to the designated mobile phone number after 18 months of detection in the above case, reminding them to take immediate measures such as opening the can for inspection. User Cases Accidents of tank bottom plate thinning and perforation leakage due to corrosion occur from time to time. According to statistics, tank failures caused by corrosion account for over 60% of all tank failures. Adopting effective tank inspection methods is of great significance for safety production, resource conservation, and environmental protection. 1)Application Case of Acoustic Emission Testing in CUPET Tank Bottom Inspection Training From March 6th to March 12th, 2017, in the oil tank area of Matanzas Port in Cuba, testing was conducted in accordance with the Chinese machinery industry standard “JB/T 10764–2007 Atmospheric Pressure Metal Storage Tank Acoustic Emission Testing and Evaluation Method”. In the past month, the loading history shows that the highest liquid level has reached 10.6 meters, and the planned liquid level for this test will rise to 10.8 meters. According to the circumference design of the probe position, the actual number of channels used is 29, and the sensor spacing is about 8 meters. Finally, a comprehensive inspection was conducted on the storage tank group of the Cuban National Oil Company. Based on the distribution of hit numbers, a specific implementation plan for inspection of opening the tank has been determined, and the qualification standards for subsequent annual inspections have been formulated based on the results of the open tank. 2)Acoustic emission detection of storage tanks in Zhongyuan Oil field Entrusted by the Oil and Gas Storage and Transportation Management Office of Zhongyuan Oil field, our company QingCheng AE Institute conducted acoustic (acoustic emission) inspection on the 20000m3 storage tank of Zhongyuan Oil field in August 2006. Storage Tank Exterior Sensor Installation Preamplifier Acquisition system 4)Special Oil Company’s Special One Joint Station Tank Acoustic Emission Online Detection The storage tank is an external arch roof tank with a capacity of 10000 cubic meters, a diameter of 27.75 meters, an effective height of 14.8 meters, and a storage medium of crude oil. The safe liquid level is 12.5 meters, and the initial liquid level detected is 17.8 meters. The tank wall is coated with anti-corrosion paint and has insulation boards and metal sheet metal protective plates. Installation diagram of on-site sensor section Channel — Hits Correlation Graph Time — Energy Diagram Time Difference Location Map Find detail monitoring scheme.pdf Storage Tank Floor Detection by SAEU3H Acoustic Emission Testing System Video  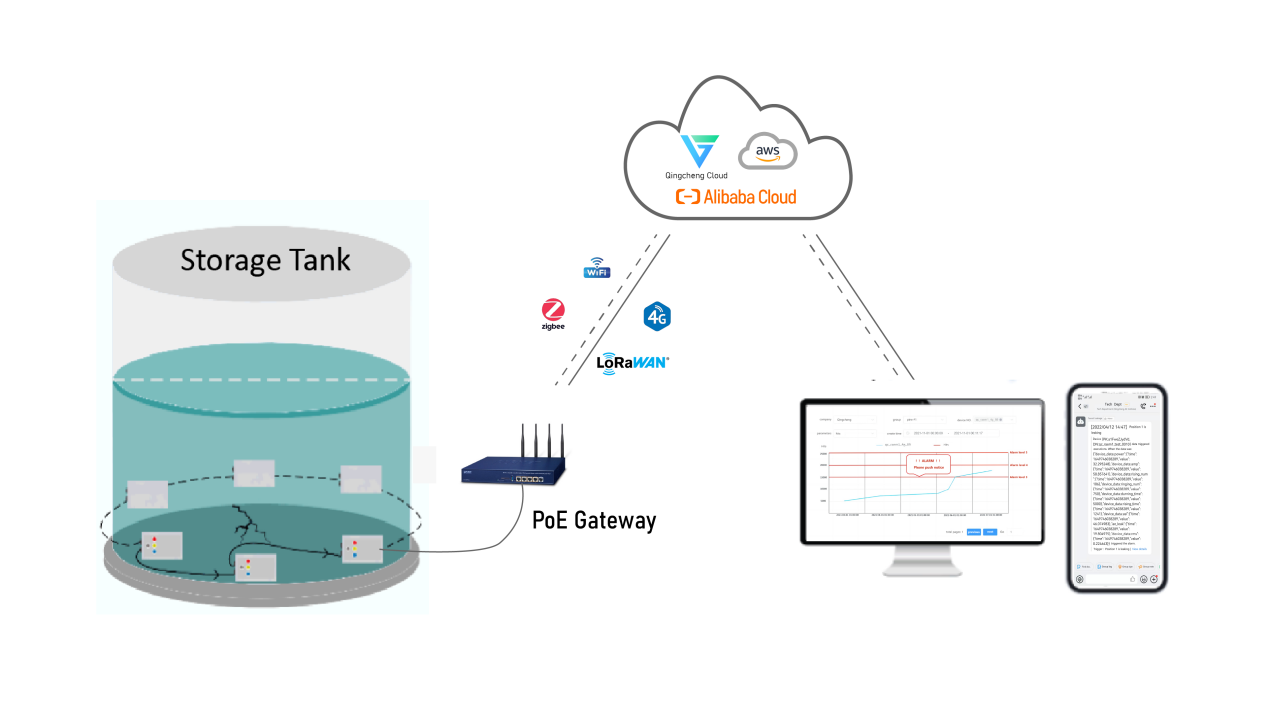 |
| json metadata | {"tags":["tank"],"image":["https://cdn.steemitimages.com/DQmYGvL8MqR4qX23rnossMD839zwiW4tivVecvP5kaynoej/lALPM5VwH0o9jnnNBojNCcw_2508_1672.png","https://cdn.steemitimages.com/DQmXaDu4bLwybaExqXUdXwbEvVZ56ghDA1TUVzcrHKPHHeN/%E5%9B%BE%E7%89%871.png","https://cdn.steemitimages.com/DQmPxKnDjXgNcrsg3vmR22SboZEosF4p6HuZQfFAPZ4WCU3/%E5%9B%BE%E7%89%872.png","https://cdn.steemitimages.com/DQmYst7YnVVraQbBUoMSJeDAWnw2X9MgefJt11ZVQvYRpGp/%E5%9B%BE%E7%89%878.png","https://cdn.steemitimages.com/DQmUHHAWsyS4QP5pT7RusHGWBiE7bkeyoidx4A9nu5j26G5/%E5%9B%BE%E7%89%8710.png","https://cdn.steemitimages.com/DQmbBqL1Qqu3f1xy6RiVHmi1n2chzAAAGgVUErGMDu1kCMr/%E5%9B%BE%E7%89%8717.png","https://cdn.steemitimages.com/DQmZcTa6C5T6uTE6afT4YN5ZaXLr1WJhpXoFnYeS9VFLqxJ/%E5%9B%BE%E7%89%8713.png"],"links":["https://www.aendt.com/acoustic/solutions/s8/"],"app":"steemit/0.2","format":"markdown"} |
| parent author | |
| parent permlink | tank |
| permlink | aboveground-storage-tank-ast-bottom-plate-corrosion-detection-monitoring |
| title | Aboveground Storage Tank (AST) Bottom Plate Corrosion Detection/ Monitoring |
| Transaction Info | Block #88780810/Trx bf62f0d192f2e93a97c754cb65f3de567c253bcd |
View Raw JSON Data
{
"block": 88780810,
"op": [
"comment",
{
"author": "barrylee",
"body": "\n\n1.<a href=\"https://www.aendt.com/acoustic/solutions/s8/\">Conventional AE Tank Corrosion Detection Scheme</a>\n\n\nPrinciple\n\nWhen there are corrosion defects on the bottom plate of the storage tank, the corrosion products will peel off and fall off, generating acoustic emission signals; when the bottom plate leaks, the medium flows and generates acoustic emission signals. The sensor array at the bottom of the tank wall receives the signal, and the acoustic emission acquisition instrument processes and analyzes the signal to evaluate the corrosion status of the tank bottom structure.\n\nSystem Composition:\n\n\n\n\nAcoustic emission sensor, preamplifier, acoustic emission acquisition instrument, computer software.\n\n\n\n\n\nDevice ModuleSAEU3H Multichannel AE detection systemOperation systemWindowsChannelsMulti-channels, cascadable to 100+ channelsAcoustic emission sensorsGI40/ G40 for tank bottom corrosion;\nGI150 for tank body cracksSampling rate10M/s, 16-bitWaveform collectionSupportAnalog filtersHigh-pass filters: 20kHz, 100kHz, 400kHz;\nLow-pass filters: 100kHz, 400kHz, 1200kHzDigital filters1KHz-2.5MHzDimension4-channel chassis: 320mm × 125mm × 50mm; (Length x Width x Height)\n20-channel chassis: 308mm × 225mm × 133mm; (Length x Width x Height)\n48-channel chassis: 308mm × 368mm × 133mm; (Length x Width x Height)AdvantagesUSB3.0 high-speed data transmission, good expansion ability, stable performance, accurate defect location function. Suitable for regular detection.\n\nSWAE Software\n\nSWAE acoustic emission system software is a combination of real-time acquisition and analysis and post-analysis software. It supports two types of AE product series, SAEU3H instrument and RAEM1 series (RAEM1 and RAEM1–6) respectively. SWAE can perform data acquisition, playback and analysis on the equipment. Its main functions are location map, correlation graphs, data table, and frequency domain waveform map, etc.\n\n\nXingsan Joint Station Case: online detection of AE from storage tanks\n\nSensor Arrangement:\n\nFor example, nine sensors were evenly arranged around the outer wall about 50 cm above the bottom plate, avoiding discontinuous locations such as pipes and manholes as much as possible, with a horizontal spacing of about 7.8 meters.\n\n\nFig 1.1 Sensor Arrangement\n\nData Collection and Analysis:\n\nAcoustic emission testing of the tank for 2 hours:\n\n\nFig 1.2 Tank #2 Channel — Hits Correlation Graph\n\n\n\n\nFig 1.3 Tank #2 Arrival time — Energy Correlation Graph\n\n\n\n\nFig 1.4 Tank #2 TDOA Location Map for 2h\n\n\nFig 1.5 Location Map when Pressure Maintaining\n\nTest results\n\nAccording to Section 9.2 of the standard “JB/T 10764–2023”, the time difference location analysis and classification methods of the tank bottom acoustic emission source were adopted. The length of 10% of the diameter was used to delineate a circular assessment area. Perform local analysis on all location sources with relatively concentrated events within the evaluation area and calculate the number of location events E per hour. According to Figure 1.5, three were 173 effective events during pressure maintenance and there were 3 relatively concentrated locating areas, defined as S1, S2, and S3.\n\nS1: E1=7; S2: E2=10; S3: E3=4.\n\nThe reference event number per hour criterion was set as a=10, based on experiences results using the same testing equipment and settings under the same environment. Considering the liquid level height during pressure maintenance and the comprehensive acoustic emission characteristic parameters, the classification result was Level I, which means “there are no signs of local corrosion, and the corrosion condition is minimal”. The repairing suggestion: do not consider repair. It is recommended to conduct acoustic emission testing again within 6 years or open the tank at an appropriate time to observe the dynamic changes of corrosion on the tank bottom plate.\n\n2.IoT Acoustic Emission Wireless Online Monitoring Solutions\n\n\n\n\n2.1 Centralized Solution Based on RAEM1–6\n\n\nPrinciple:\n\nWhen corrosion defects or leakage occur on the bottom plate of the storage tank, acoustic emission waves are generated. The sensors receive the acoustic waves, which are then processed and analyzed by the acoustic emission acquisition unit. The result signals are transmitted to the cloud server through a 4G/WiFi network, and users log in to the cloud platform (private cloud/Qingcheng cloud) to remotely view the data and set rating criteria. The system automatically provides rating results based on the criteria. Once the alarm threshold is reached, an alarm is automatically pushed.\n\nSystem Composition:\n\nAcoustic emission sensors, acoustic emission acquisition instrument (signal acquisition and analysis and communication), cloud servers (cloud server IoT platform/LAN server/computer/mobile phone, etc.), customer terminals (mobile phone, PC, etc.).\n\n\n\nDevice ModuleRAEM1–6 Multichannel AE systemOperation systemLinuxChannels6 channels, can be cascaded to 100+ channelsAcoustic emission sensorsGI40/ G40 for tank bottom corrosion;\nGI150 for tank body cracksSampling rate2M/s, 16-bitWaveform collectionSupportAnalog filtersHigh-pass filters: 30kHz, 125kHz;\nLow-pass filters: 80kHz, 175kHzDigital filters1KHz-1.0MHzCommunicationWiFi/ 4GDimensionLength x Width x Height: 22cm × 13cm × 8cmAdvantagesBased on the Linux operating system, it has stable performance, wireless communication capability, and is suitable for long-term remote unmanned monitoring. The devices can be cascaded to form a large-scale monitoring system.\n\n2.2 Distributed Solution Based on RAEM1\n\n\nPrinciple:\n\nWhen corrosion defects or leakage occur on the bottom plate of the storage tank, acoustic waves (acoustic emission) are generated. The acoustic emission acquisition unit receives the signals, processes and analyzes them, and transmits them to the cloud server through a 4G/WiFi/LAN network. Users log in to the cloud platform (private cloud/Qingcheng cloud) to remotely view data and set rating criteria. The system automatically gives rating results based on the criteria. Once the alarm threshold is reached, an alarm is automatically pushed.\n\nSystem Composition:\n\nAcoustic emission acquisition unit (sensors, signal acquisition and analysis, communication), cloud server (cloud server IoT platform/LAN server/computer/mobile phone, etc.), client terminal (mobile phone, PC, etc.).\n\n\n\nDevice ModuleRAEM1Operation systemLinuxChannelsSingle channelAcoustic emission sensorsGI40/ G40 for tank bottom corrosion;\nGI150 for tank body cracksSampling rate2M/s, 16-bitWaveform collectionSupportAnalog filtersHigh-pass filters: 30kHz, 125kHz;\nLow-pass filters: 80kHz, 175kHzDigital filters1KHz-1.0MHzCommunicationWiFi/ 4G/ RS-485AdvantagesRAEM1 has built-in sensors, signal acquisition, signal processing, data transmission, battery power supply, and wireless clock synchronization. Its strong magnetic bottom can be directly attached to the metal tank wall during installation. Generally applicable to metal storage tanks, it can be remotely monitored without human intervention or can do the traditional AE testing on-site.\n\n2.3 Chained Solution Based on RAEM1\n\n\nPrinciple:\n\nWhen corrosion defects or leakage occur on the bottom plate of the storage tank, acoustic waves (acoustic emission) are generated. The acoustic emission acquisition unit receives the signals, processes and analyzes them, and transmits them to the cloud server through the PoE router. Users log in to the cloud platform (private cloud/Qingcheng cloud) to remotely view data and set rating criteria. The system automatically gives rating results based on the criteria. Once the alarm threshold is reached, an alarm is automatically pushed.\n\nSystem Composition:\n\nAcoustic emission acquisition unit (sensors, signal acquisition and analysis), router, cloud server (cloud server IoT platform/LAN server/computer/mobile phone, etc.), client terminal (mobile phone, PC, etc.).\n\n\n\nDevice ModuleBWM1ChannelsSingle channel; multiple channels in series connectionAcoustic emission sensorsGI40/ G40 for tank bottom corrosion;\nGI150 for tank body cracksSampling rate2M/s, 16-bitWaveform collectionSupportAnalog filtersHigh-pass filters: 30kHz, 125kHz;\nLow-pass filters: 80kHz, 175kHzDigital filters256-order FIR filter, any pass-through, high-pass, low-pass and band-pass settable from 0kHz-1000kHzCommunicationEthernetDimension507*50*43mm (waterproof plug included)AdvantagesThe layout of this scheme is in chain series connection. The chain connection refers to the AE acquisition units are connected in series via PoE using Ethernet cables. Data transmission and power supply are both achieved through PoE, simplifying the wiring needs.\n\nIIoT Wireless Online Monitoring System Acquisition Work Flow\n\n\nCloud Computing Process Work Flow\n\n\nQC Cloud Main Functions\n\nCloud platform remote parameter settings: acquisition mode, threshold, sampling rate, filtering range, HDT, HLT, EET and other parameters.\n\n\nCloud platform data display: real-time/historical (parameter/ waveform) data, rating results, parameter comparison results display.\n\n\nAutomatic alarm notifications: Alarm information is pushed to the clients through SMS, emails, and other methods.\n\n\nAutomatic report generation: After filling in relevant information through the cloud platform, the system automatically generates a report. And download the report from the cloud platform with one clicking.\n\nCase Study\n\n①The test data results of 6 storage tanks of the same size and medium under the same usage conditions, with a pressure holding time of 1 hour, are shown in the table:\n\nTank 1Tank 2Tank 3Tank 4Tank 5Tank 6Total Hits2034886896172038768984968Total Events234017823925600268180Max Hits78343783000688763400420Min Hits456360333321487365Corrosion LevelIIIIIIIVIIICorrosion StatusThere are obvious signs of localized corrosion.No signs of localized corrosion.There are slight signs of localized corrosion present.There are signs of severe localized corrosion.There are slight signs of localized corrosion present.No signs of localized corrosion.Maintenance SuggestionConsider maintenanceNo maintenance requiredNo need to consider maintenance in the near futurePrioritize maintenance as the top priorityNo need to consider maintenance in the near futureNo maintenance required\n\nAccording to Section 9 of the standard ‘JB/T 10764–2023 Non destructive Testing — Acoustic Emission Testing and Evaluation Method for Atmospheric Pressure Metal Storage Tanks’, the classification of acoustic emission sources based on cluster zone analysis for tank bottom plates in Table 3 was that K=500 (Hits per hour for an independent channel). Obtained the detailed classification levels of each storage tank as shown in the table above.\n\nBased on the review of historical operation records and other data of storage tanks, it was determined that tank #2 and #6 were intact tanks (Level I) and do not require maintenance; Tank #4 was a tank with severe corrosion of its bottom plate (greater than Level III) and requires the highest priority for maintenance. The same method can be used to perform the same tank level analysis on the entire process of tank loading and the specific processes of pressure rise and maintenance.\n\n1.Cloud Platform Display\n\nUsers can configure and monitor remotely through the cloud platform, and upload data to the cloud platform for display and analysis.\n\nFigure 1: Channel 1 of Tank 4 (RAEM1_TJSH-001) system rating levels from the 3rd, 6th, 9th, 12th, 15th, and 18th months, which are level I, I, I, II, II, III respectively.\n\n\n2.Mobile Phone Notifications\n\nWhen the alarm limit is reached, the phone pushes the alarm notifications. Alarm methods: Mini program, email, SMS, APP.\n\nAccording to the data of Tank 4 on the cloud platform, significant corrosion (Level III) was observed during the 6th monitoring. The mobile phone synchronously receives alarm notifications, including information such as tank level, status, and repair suggestions.\n\n\n3.SWAE Software\n\nAfter downloading data from the cloud, in-depth analysis can be conducted using Qingcheng’s SWAE software, or it can be directly sent to SWAE software for real-time analysis and processing.\n\nCase: Data from holding pressure for 1 hour.\nTotal number of hits: 10617, maximum 3000 (Channel 1), minimum 333 (Channel 7), total event number: 239. There is slight localized corrosion. Through Qingcheng’s SWAE software, data can be viewed and corrosion sites can be located.\n\n\nTank bottom location map (time difference location)\n\n\nChannel — hits correlation graph (zone location)\n\nAutomatic detection and rating, remote viewing, proactive alarm push, in compliance with standards:\n\nAutomatically detect and obtain data according to the set time. After setting the K value according to the standard content, the K value can be used as an automatic rating criterion for automatic data processing, and the corrosion status level of each storage tank required by the standard content can be automatically analyzed.\n\nThe corrosion status level and specific data of the storage tank can be accessed anytime on the cloud IoT platform through computers and mobiles at any location.\n\nSetting the alarm level, such as Level III alarm, will automatically push the alarm notifications to the designated mobile phone number after 18 months of detection in the above case, reminding them to take immediate measures such as opening the can for inspection.\n\nUser Cases\n\nAccidents of tank bottom plate thinning and perforation leakage due to corrosion occur from time to time. According to statistics, tank failures caused by corrosion account for over 60% of all tank failures. Adopting effective tank inspection methods is of great significance for safety production, resource conservation, and environmental protection.\n\n\n1)Application Case of Acoustic Emission Testing in CUPET Tank Bottom Inspection Training\n\n\nFrom March 6th to March 12th, 2017, in the oil tank area of Matanzas Port in Cuba, testing was conducted in accordance with the Chinese machinery industry standard “JB/T 10764–2007 Atmospheric Pressure Metal Storage Tank Acoustic Emission Testing and Evaluation Method”.\n\n\nIn the past month, the loading history shows that the highest liquid level has reached 10.6 meters, and the planned liquid level for this test will rise to 10.8 meters. According to the circumference design of the probe position, the actual number of channels used is 29, and the sensor spacing is about 8 meters. Finally, a comprehensive inspection was conducted on the storage tank group of the Cuban National Oil Company. Based on the distribution of hit numbers, a specific implementation plan for inspection of opening the tank has been determined, and the qualification standards for subsequent annual inspections have been formulated based on the results of the open tank.\n\n\n2)Acoustic emission detection of storage tanks in Zhongyuan Oil field\n\nEntrusted by the Oil and Gas Storage and Transportation Management Office of Zhongyuan Oil field, our company QingCheng AE Institute conducted acoustic (acoustic emission) inspection on the 20000m3 storage tank of Zhongyuan Oil field in August 2006.\n\n\n\nStorage Tank Exterior\n\nSensor Installation\n\n\nPreamplifier\n\nAcquisition system\n\n4)Special Oil Company’s Special One Joint Station Tank Acoustic Emission Online Detection\n\n\nThe storage tank is an external arch roof tank with a capacity of 10000 cubic meters, a diameter of 27.75 meters, an effective height of 14.8 meters, and a storage medium of crude oil. The safe liquid level is 12.5 meters, and the initial liquid level detected is 17.8 meters. The tank wall is coated with anti-corrosion paint and has insulation boards and metal sheet metal protective plates.\n\n\nInstallation diagram of on-site sensor section\n\n\nChannel — Hits Correlation Graph\n\n\nTime — Energy Diagram\n\nTime Difference Location Map\n\n\nFind detail monitoring scheme.pdf\n\n\nStorage Tank Floor Detection by SAEU3H Acoustic Emission Testing System Video\n\n\n",
"json_metadata": "{\"tags\":[\"tank\"],\"image\":[\"https://cdn.steemitimages.com/DQmYGvL8MqR4qX23rnossMD839zwiW4tivVecvP5kaynoej/lALPM5VwH0o9jnnNBojNCcw_2508_1672.png\",\"https://cdn.steemitimages.com/DQmXaDu4bLwybaExqXUdXwbEvVZ56ghDA1TUVzcrHKPHHeN/%E5%9B%BE%E7%89%871.png\",\"https://cdn.steemitimages.com/DQmPxKnDjXgNcrsg3vmR22SboZEosF4p6HuZQfFAPZ4WCU3/%E5%9B%BE%E7%89%872.png\",\"https://cdn.steemitimages.com/DQmYst7YnVVraQbBUoMSJeDAWnw2X9MgefJt11ZVQvYRpGp/%E5%9B%BE%E7%89%878.png\",\"https://cdn.steemitimages.com/DQmUHHAWsyS4QP5pT7RusHGWBiE7bkeyoidx4A9nu5j26G5/%E5%9B%BE%E7%89%8710.png\",\"https://cdn.steemitimages.com/DQmbBqL1Qqu3f1xy6RiVHmi1n2chzAAAGgVUErGMDu1kCMr/%E5%9B%BE%E7%89%8717.png\",\"https://cdn.steemitimages.com/DQmZcTa6C5T6uTE6afT4YN5ZaXLr1WJhpXoFnYeS9VFLqxJ/%E5%9B%BE%E7%89%8713.png\"],\"links\":[\"https://www.aendt.com/acoustic/solutions/s8/\"],\"app\":\"steemit/0.2\",\"format\":\"markdown\"}",
"parent_author": "",
"parent_permlink": "tank",
"permlink": "aboveground-storage-tank-ast-bottom-plate-corrosion-detection-monitoring",
"title": "Aboveground Storage Tank (AST) Bottom Plate Corrosion Detection/ Monitoring"
}
],
"op_in_trx": 0,
"timestamp": "2024-09-20T10:24:09",
"trx_id": "bf62f0d192f2e93a97c754cb65f3de567c253bcd",
"trx_in_block": 1,
"virtual_op": 0
}2024/09/13 09:11:06
2024/09/13 09:11:06
| author | claudia |
| body | Basura de copypasta spam e escritura IA. |
| json metadata | {"app":"steemit/0.2"} |
| parent author | barrylee |
| parent permlink | a-list-of-some-of-the-most-important-and-notable-manufacturers-of-acoustic-emission-ae-testing-equipment |
| permlink | sjquu3 |
| title | |
| Transaction Info | Block #88578186/Trx 47f6cd4a20a5b5c6e87a78f623d2d426fd9fee23 |
View Raw JSON Data
{
  "block": 88578186,
  "op": [
    "comment",
    {
      "author": "claudia",
      "body": "Basura de copypasta spam e escritura IA.",
      "json_metadata": "{\"app\":\"steemit/0.2\"}",
      "parent_author": "barrylee",
      "parent_permlink": "a-list-of-some-of-the-most-important-and-notable-manufacturers-of-acoustic-emission-ae-testing-equipment",
      "permlink": "sjquu3",
      "title": ""
    }
  ],
  "op_in_trx": 0,
  "timestamp": "2024-09-13T09:11:06",
  "trx_id": "47f6cd4a20a5b5c6e87a78f623d2d426fd9fee23",
  "trx_in_block": 5,
  "virtual_op": 0
}2024/09/13 09:10:54
2024/09/13 09:10:54
| author | claudia |
| body | Basura de copypasta spam e IA. |
| json metadata | {"app":"steemit/0.2"} |
| parent author | barrylee |
| parent permlink | a-list-of-some-of-the-most-important-and-notable-manufacturers-of-acoustic-emission-ae-testing-equipment |
| permlink | sjquu3 |
| title | |
| Transaction Info | Block #88578182/Trx 93353b7ed3599c898271b4bac6c71d67d098c109 |
View Raw JSON Data
{
  "block": 88578182,
  "op": [
    "comment",
    {
      "author": "claudia",
      "body": "Basura de copypasta spam e IA.",
      "json_metadata": "{\"app\":\"steemit/0.2\"}",
      "parent_author": "barrylee",
      "parent_permlink": "a-list-of-some-of-the-most-important-and-notable-manufacturers-of-acoustic-emission-ae-testing-equipment",
      "permlink": "sjquu3",
      "title": ""
    }
  ],
  "op_in_trx": 0,
  "timestamp": "2024-09-13T09:10:54",
  "trx_id": "93353b7ed3599c898271b4bac6c71d67d098c109",
  "trx_in_block": 2,
  "virtual_op": 0
}2024/09/13 08:54:21
2024/09/13 08:54:21
| author | barrylee |
| body | Here is a list of some of the most important and notable manufacturers of acoustic emission (AE) testing equipment around the world: **1. **PAC (Physical Acoustic Corporation)** — **Overview**: PAC is a leading company in the field of acoustic emission testing. They offer a wide range of AE equipment, including sensors, software, and analysis systems. — **Website**: [PAC](https://www.physicalacoustics.com/) **2. **Krautkramer (Part of Baker Hughes)** — **Overview**: Krautkramer, a division of Baker Hughes, is known for its advanced NDT equipment, including acoustic emission testing systems for industrial applications. — **Website**: [Krautkramer](https://www.bakerhughesds.com/nondestructive-testing/ultrasonic-testing) **3. **MISTRAS Group** — **Overview**: MISTRAS provides a wide array of testing and monitoring solutions, including acoustic emission testing systems, for various industries. — **Website**: [MISTRAS](https://www.mistrasgroup.com/) **4. **QingCheng AE Institute** — **Overview**: QingCheng AE Institute specializes in acoustic emission technology, which is used for monitoring the health and integrity of materials and structures. Their expertise covers the development, manufacturing, and application of AE testing equipment. — **Website**: [QingCheng](<a href="https://www.aendt.com">https://www.aendt.com</a>/) ### **5. **Zetec** — **Overview**: Zetec provides a variety of non-destructive testing solutions, including acoustic emission equipment. They cater to industries such as aerospace, power generation, and manufacturing. — **Website**: [Zetec](https://www.zetec.com/) ### **6. **Ultrasonic Systems Inc.** — **Overview**: This company provides a variety of ultrasonic and acoustic emission testing equipment and services for industrial and research applications. — **Website**: [Ultrasonic Systems Inc.](http://www.ultrasonicsystems.com/) ### **7. **NDT Systems Inc.** — **Overview**: NDT Systems offers a range of non-destructive testing equipment, including acoustic emission testing solutions, for various industrial applications. — **Website**: [NDT Systems](https://www.ndtsystems.com/) ### **8. **Instrumentation Northwest Inc.** — **Overview**: Specializes in acoustic emission testing and monitoring equipment. They offer solutions for structural health monitoring and material testing. — **Website**: [Instrumentation Northwest](http://www.instrumentationnorthwest.com/) ### **9. **Aitech** — **Overview**: Aitech provides acoustic emission systems and related instrumentation for various industries including aerospace, defense, and manufacturing. — **Website**: [Aitech](http://www.aitech.com/) ### **10. **NDT Global** — **Overview**: NDT Global provides advanced non-destructive testing solutions including acoustic emission technology for pipeline and infrastructure inspection. — **Website**: [NDT Global](https://www.ndt-global.com/) These manufacturers offer a range of acoustic emission testing solutions, from basic systems to advanced integrated solutions for various applications. For specific needs or to find the most suitable equipment, it’s best to contact these companies directly or consult their product catalogs and technical support. |
| json metadata | {"tags":["ndt"],"links":["https://www.physicalacoustics.com/","https://www.bakerhughesds.com/nondestructive-testing/ultrasonic-testing","https://www.mistrasgroup.com/","https://www.aendt.com","https://www.zetec.com/","http://www.ultrasonicsystems.com/","https://www.ndtsystems.com/","http://www.instrumentationnorthwest.com/","http://www.aitech.com/","https://www.ndt-global.com/"],"app":"steemit/0.2","format":"markdown"} |
| parent author | |
| parent permlink | ndt |
| permlink | a-list-of-some-of-the-most-important-and-notable-manufacturers-of-acoustic-emission-ae-testing-equipment |
| title | A list of some of the most important and notable manufacturers of acoustic emission (AE) testing equipment |
| Transaction Info | Block #88577853/Trx 63a7faa352c62981d836dbf8d34a88a249902bb9 |
View Raw JSON Data
{
  "block": 88577853,
  "op": [
    "comment",
    {
      "author": "barrylee",
      "body": "Here is a list of some of the most important and notable manufacturers of acoustic emission (AE) testing equipment around the world:\n\n**1. **PAC (Physical Acoustic Corporation)**\n— **Overview**: PAC is a leading company in the field of acoustic emission testing. They offer a wide range of AE equipment, including sensors, software, and analysis systems.\n— **Website**: [PAC](https://www.physicalacoustics.com/)\n\n**2. **Krautkramer (Part of Baker Hughes)**\n— **Overview**: Krautkramer, a division of Baker Hughes, is known for its advanced NDT equipment, including acoustic emission testing systems for industrial applications.\n— **Website**: [Krautkramer](https://www.bakerhughesds.com/nondestructive-testing/ultrasonic-testing)\n\n**3. **MISTRAS Group**\n— **Overview**: MISTRAS provides a wide array of testing and monitoring solutions, including acoustic emission testing systems, for various industries.\n— **Website**: [MISTRAS](https://www.mistrasgroup.com/)\n\n**4. **QingCheng AE Institute**\n— **Overview**: QingCheng AE Institute specializes in acoustic emission technology, which is used for monitoring the health and integrity of materials and structures. Their expertise covers the development, manufacturing, and application of AE testing equipment.\n— **Website**: [QingCheng](<a href=\"https://www.aendt.com\">https://www.aendt.com</a>/)\n\n### **5. **Zetec**\n— **Overview**: Zetec provides a variety of non-destructive testing solutions, including acoustic emission equipment. They cater to industries such as aerospace, power generation, and manufacturing.\n— **Website**: [Zetec](https://www.zetec.com/)\n\n### **6. **Ultrasonic Systems Inc.**\n— **Overview**: This company provides a variety of ultrasonic and acoustic emission testing equipment and services for industrial and research applications.\n— **Website**: [Ultrasonic Systems Inc.](http://www.ultrasonicsystems.com/)\n\n### **7. **NDT Systems Inc.**\n— **Overview**: NDT Systems offers a range of non-destructive testing equipment, including acoustic emission testing solutions, for various industrial applications.\n— **Website**: [NDT Systems](https://www.ndtsystems.com/)\n\n### **8. **Instrumentation Northwest Inc.**\n— **Overview**: Specializes in acoustic emission testing and monitoring equipment. They offer solutions for structural health monitoring and material testing.\n— **Website**: [Instrumentation Northwest](http://www.instrumentationnorthwest.com/)\n\n### **9. **Aitech**\n— **Overview**: Aitech provides acoustic emission systems and related instrumentation for various industries including aerospace, defense, and manufacturing.\n— **Website**: [Aitech](http://www.aitech.com/)\n\n### **10. **NDT Global**\n— **Overview**: NDT Global provides advanced non-destructive testing solutions including acoustic emission technology for pipeline and infrastructure inspection.\n— **Website**: [NDT Global](https://www.ndt-global.com/)\n\nThese manufacturers offer a range of acoustic emission testing solutions, from basic systems to advanced integrated solutions for various applications. For specific needs or to find the most suitable equipment, it’s best to contact these companies directly or consult their product catalogs and technical support.",
      "json_metadata": "{\"tags\":[\"ndt\"],\"links\":[\"https://www.physicalacoustics.com/\",\"https://www.bakerhughesds.com/nondestructive-testing/ultrasonic-testing\",\"https://www.mistrasgroup.com/\",\"https://www.aendt.com\",\"https://www.zetec.com/\",\"http://www.ultrasonicsystems.com/\",\"https://www.ndtsystems.com/\",\"http://www.instrumentationnorthwest.com/\",\"http://www.aitech.com/\",\"https://www.ndt-global.com/\"],\"app\":\"steemit/0.2\",\"format\":\"markdown\"}",
      "parent_author": "",
      "parent_permlink": "ndt",
      "permlink": "a-list-of-some-of-the-most-important-and-notable-manufacturers-of-acoustic-emission-ae-testing-equipment",
      "title": "A list of some of the most important and notable manufacturers of acoustic emission (AE) testing equipment"
    }
  ],
  "op_in_trx": 0,
  "timestamp": "2024-09-13T08:54:21",
  "trx_id": "63a7faa352c62981d836dbf8d34a88a249902bb9",
  "trx_in_block": 10,
  "virtual_op": 0
}barryleepublished a new post: wind-turbine-bearing-monitoring-bt-bearing-with-acoustic-emission-technology2024/09/12 10:33:30
barryleepublished a new post: wind-turbine-bearing-monitoring-bt-bearing-with-acoustic-emission-technology
2024/09/12 10:33:30
| author | barrylee |
| body | @@ -838,16 +838,148 @@ n)%3C/a%3E%0A%0A +!%5B1-220111164H6393%5B1%5D.jpg%5D(https://cdn.steemitimages.com/DQmTMUGyYYK8aSo2FeFKT9zByyk1yXrtrXoXWKXZAgFSzU6/1-220111164H6393%5B1%5D.jpg)%0A%0A%0A The acqu @@ -1252,24 +1252,155 @@ pattern.%0A%0A%0A +!%5B1-2201111A345137%5B1%5D.png%5D(https://cdn.steemitimages.com/DQmR8w151e616ngZdeXxwdVLtX9k4sHRw4tVrRmWmDecbPp/1-2201111A345137%5B1%5D.png)%0A%0A The data is |
| json metadata | {"links":["https://www.aendt.com","https://www.aendt.com/acoustic/solutions/s7/"],"app":"steemit/0.2","format":"markdown","image":["https://cdn.steemitimages.com/DQmTMUGyYYK8aSo2FeFKT9zByyk1yXrtrXoXWKXZAgFSzU6/1-220111164H6393[1].jpg","https://cdn.steemitimages.com/DQmR8w151e616ngZdeXxwdVLtX9k4sHRw4tVrRmWmDecbPp/1-2201111A345137[1].png"]} |
| parent author | |
| parent permlink | windturbine |
| permlink | wind-turbine-bearing-monitoring-bt-bearing-with-acoustic-emission-technology |
| title | Wind turbine bearing monitoring (BT bearing)-with acoustic emission technology |
| Transaction Info | Block #88551097/Trx 0d3cf855d238e45b6e7828e60b5f285126b2c57a |
View Raw JSON Data
{
  "block": 88551097,
  "op": [
    "comment",
    {
      "author": "barrylee",
      "body": "@@ -838,16 +838,148 @@\n n)%3C/a%3E%0A%0A\n+!%5B1-220111164H6393%5B1%5D.jpg%5D(https://cdn.steemitimages.com/DQmTMUGyYYK8aSo2FeFKT9zByyk1yXrtrXoXWKXZAgFSzU6/1-220111164H6393%5B1%5D.jpg)%0A%0A%0A\n The acqu\n@@ -1252,24 +1252,155 @@\n  pattern.%0A%0A%0A\n+!%5B1-2201111A345137%5B1%5D.png%5D(https://cdn.steemitimages.com/DQmR8w151e616ngZdeXxwdVLtX9k4sHRw4tVrRmWmDecbPp/1-2201111A345137%5B1%5D.png)%0A%0A\n The data is \n",
      "json_metadata": "{\"links\":[\"https://www.aendt.com\",\"https://www.aendt.com/acoustic/solutions/s7/\"],\"app\":\"steemit/0.2\",\"format\":\"markdown\",\"image\":[\"https://cdn.steemitimages.com/DQmTMUGyYYK8aSo2FeFKT9zByyk1yXrtrXoXWKXZAgFSzU6/1-220111164H6393[1].jpg\",\"https://cdn.steemitimages.com/DQmR8w151e616ngZdeXxwdVLtX9k4sHRw4tVrRmWmDecbPp/1-2201111A345137[1].png\"]}",
      "parent_author": "",
      "parent_permlink": "windturbine",
      "permlink": "wind-turbine-bearing-monitoring-bt-bearing-with-acoustic-emission-technology",
      "title": "Wind turbine bearing monitoring (BT bearing)-with acoustic emission technology"
    }
  ],
  "op_in_trx": 0,
  "timestamp": "2024-09-12T10:33:30",
  "trx_id": "0d3cf855d238e45b6e7828e60b5f285126b2c57a",
  "trx_in_block": 3,
  "virtual_op": 0
}barryleepublished a new post: wind-turbine-bearing-monitoring-bt-bearing-with-acoustic-emission-technology2024/09/12 10:32:45
barryleepublished a new post: wind-turbine-bearing-monitoring-bt-bearing-with-acoustic-emission-technology
2024/09/12 10:32:45
| author | barrylee |
| body | Wind turbine bearing monitoring (BT bearing) - <a href="https://www.aendt.com">QingCheng AE Institute</a> BT bearings are double-row tapered roller bearings. They have a double-race outer ring and two inner rings. There is a spacer between the two inner rings. The bearing clearance can be adjusted by changing the thickness of the spacer. This type of bearing can bear both radial loads and axial loads in both directions, and can limit the axial displacement of the shaft and the housing within the axial clearance of the bearing. It is mainly used to bear radial and axial combined loads dominated by radial loads. It has the characteristics of large load-bearing capacity and low limit speed. <a href="https://www.aendt.com/acoustic/solutions/s7/">Rotating Machinery Condition Monitoring System Using Acoustic Wave (Acoustic Emission)</a> The acquisition module is arranged on the relatively stationary inner ring of the bearing. If there is a pit, the rollers in the same row will produce impact (collision) every time they pass by. When the speed is constant, the acoustic emission signal should have a periodic pattern. The data is uploaded to the cloud, and a certain algorithm is used to determine whether a fault or wear occurs, and an alarm message is pushed to the client. The BT bearing is located between the rotating shaft and the fixed shaft, at the front end of the main shaft. The rear end of the acoustic emission sensor is connected to the main machine with a signal line, so it can only be arranged on the inner side of the fixed shaft, close to the BT bearing. Structural diagram Sensor and collector installation layout P.S. <a href="https://www.aendt.com/acoustic/solutions/s7/">Rotating Machinery Condition Monitoring System Using Acoustic Wave (Acoustic Emission)</a> |
| json metadata | {"tags":["windturbine"],"links":["https://www.aendt.com","https://www.aendt.com/acoustic/solutions/s7/"],"app":"steemit/0.2","format":"markdown"} |
| parent author | |
| parent permlink | windturbine |
| permlink | wind-turbine-bearing-monitoring-bt-bearing-with-acoustic-emission-technology |
| title | Wind turbine bearing monitoring (BT bearing)-with acoustic emission technology |
| Transaction Info | Block #88551082/Trx 76179d19a5d0e802a4926971bda0763978a8da14 |
View Raw JSON Data
{
  "block": 88551082,
  "op": [
    "comment",
    {
      "author": "barrylee",
      "body": "Wind turbine bearing monitoring (BT bearing) - <a href=\"https://www.aendt.com\">QingCheng AE Institute</a>\nBT bearings are double-row tapered roller bearings. They have a double-race outer ring and two inner rings. There is a spacer between the two inner rings. The bearing clearance can be adjusted by changing the thickness of the spacer. This type of bearing can bear both radial loads and axial loads in both directions, and can limit the axial displacement of the shaft and the housing within the axial clearance of the bearing. It is mainly used to bear radial and axial combined loads dominated by radial loads. It has the characteristics of large load-bearing capacity and low limit speed.\n\n<a href=\"https://www.aendt.com/acoustic/solutions/s7/\">Rotating Machinery Condition Monitoring System Using Acoustic Wave (Acoustic Emission)</a>\n\nThe acquisition module is arranged on the relatively stationary inner ring of the bearing. If there is a pit, the rollers in the same row will produce impact (collision) every time they pass by. When the speed is constant, the acoustic emission signal should have a periodic pattern.\n\n\nThe data is uploaded to the cloud, and a certain algorithm is used to determine whether a fault or wear occurs, and an alarm message is pushed to the client.\n\n\nThe BT bearing is located between the rotating shaft and the fixed shaft, at the front end of the main shaft. The rear end of the acoustic emission sensor is connected to the main machine with a signal line, so it can only be arranged on the inner side of the fixed shaft, close to the BT bearing.\n\n\nStructural diagram\n\n\nSensor and collector installation layout\n\nP.S.\n\n<a href=\"https://www.aendt.com/acoustic/solutions/s7/\">Rotating Machinery Condition Monitoring System Using Acoustic Wave (Acoustic Emission)</a>",
      "json_metadata": "{\"tags\":[\"windturbine\"],\"links\":[\"https://www.aendt.com\",\"https://www.aendt.com/acoustic/solutions/s7/\"],\"app\":\"steemit/0.2\",\"format\":\"markdown\"}",
      "parent_author": "",
      "parent_permlink": "windturbine",
      "permlink": "wind-turbine-bearing-monitoring-bt-bearing-with-acoustic-emission-technology",
      "title": "Wind turbine bearing monitoring (BT bearing)-with acoustic emission technology"
    }
  ],
  "op_in_trx": 0,
  "timestamp": "2024-09-12T10:32:45",
  "trx_id": "76179d19a5d0e802a4926971bda0763978a8da14",
  "trx_in_block": 1,
  "virtual_op": 0
}2024/09/11 03:20:09
2024/09/11 03:20:09
| author | barrylee |
| body | 2024年9月9日作为参展商参加第六届公路桥隧健康监测与安全运营技术研讨会 我司于2024年9月9日至9月11日作为参展商参加在武汉举办的第六届公路桥隧健康监测与安全运营技术研讨会!本届会议由中国公路学会秘书处和湖北交通投资集团有限公司主办,以”安全·智能·耐久”为主题。! 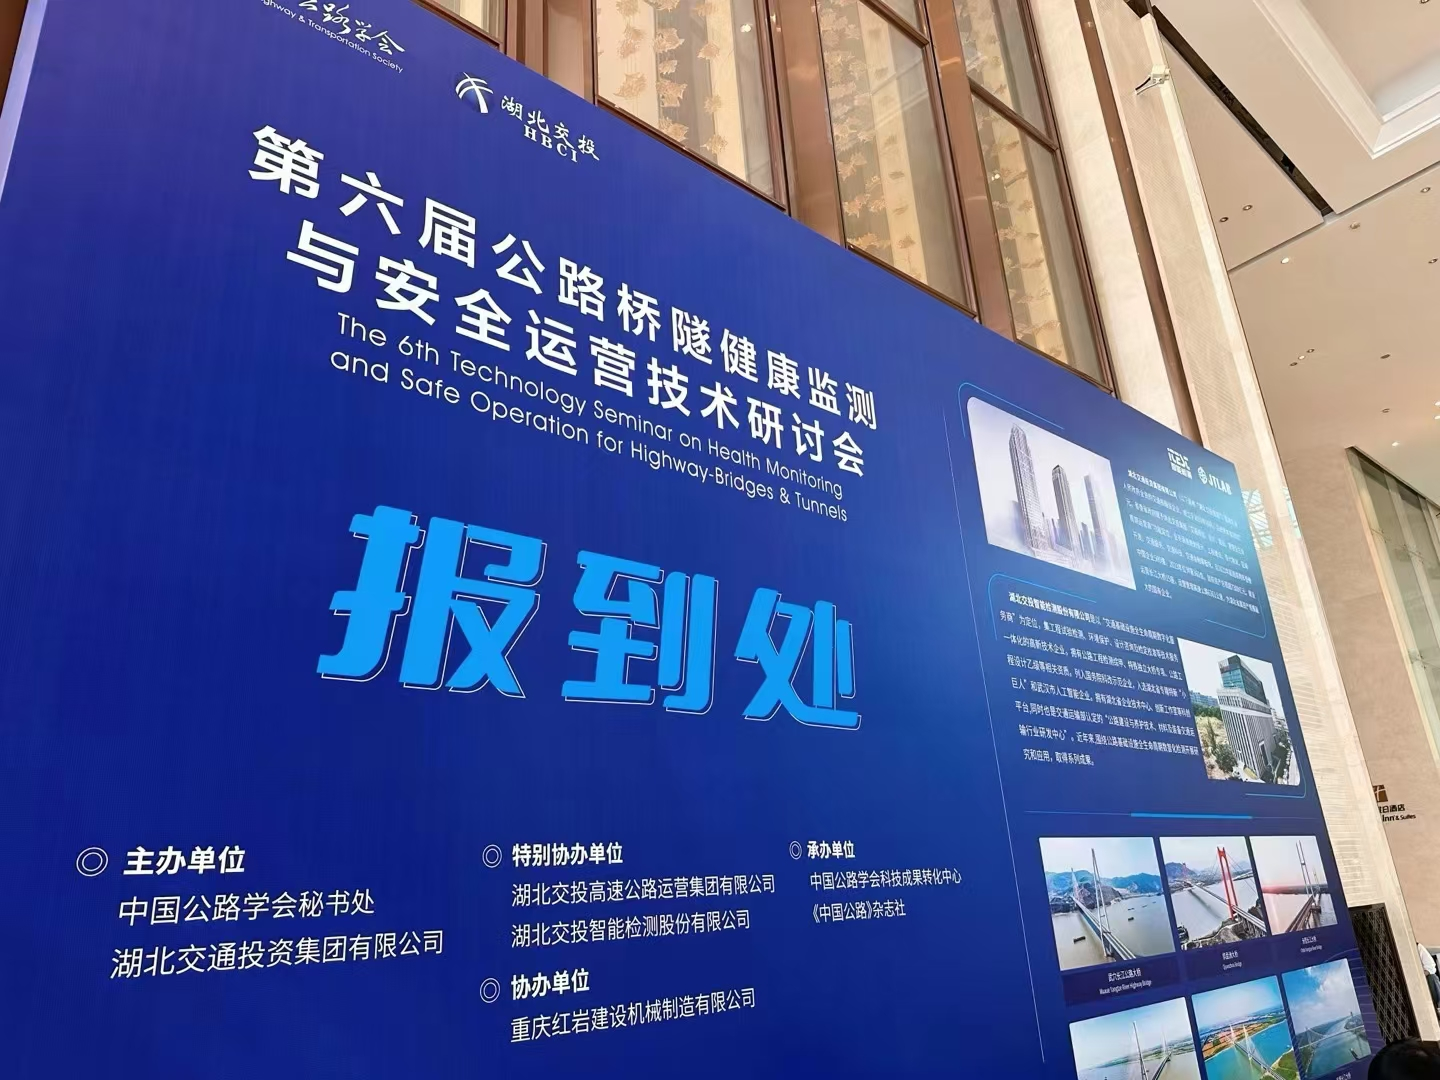 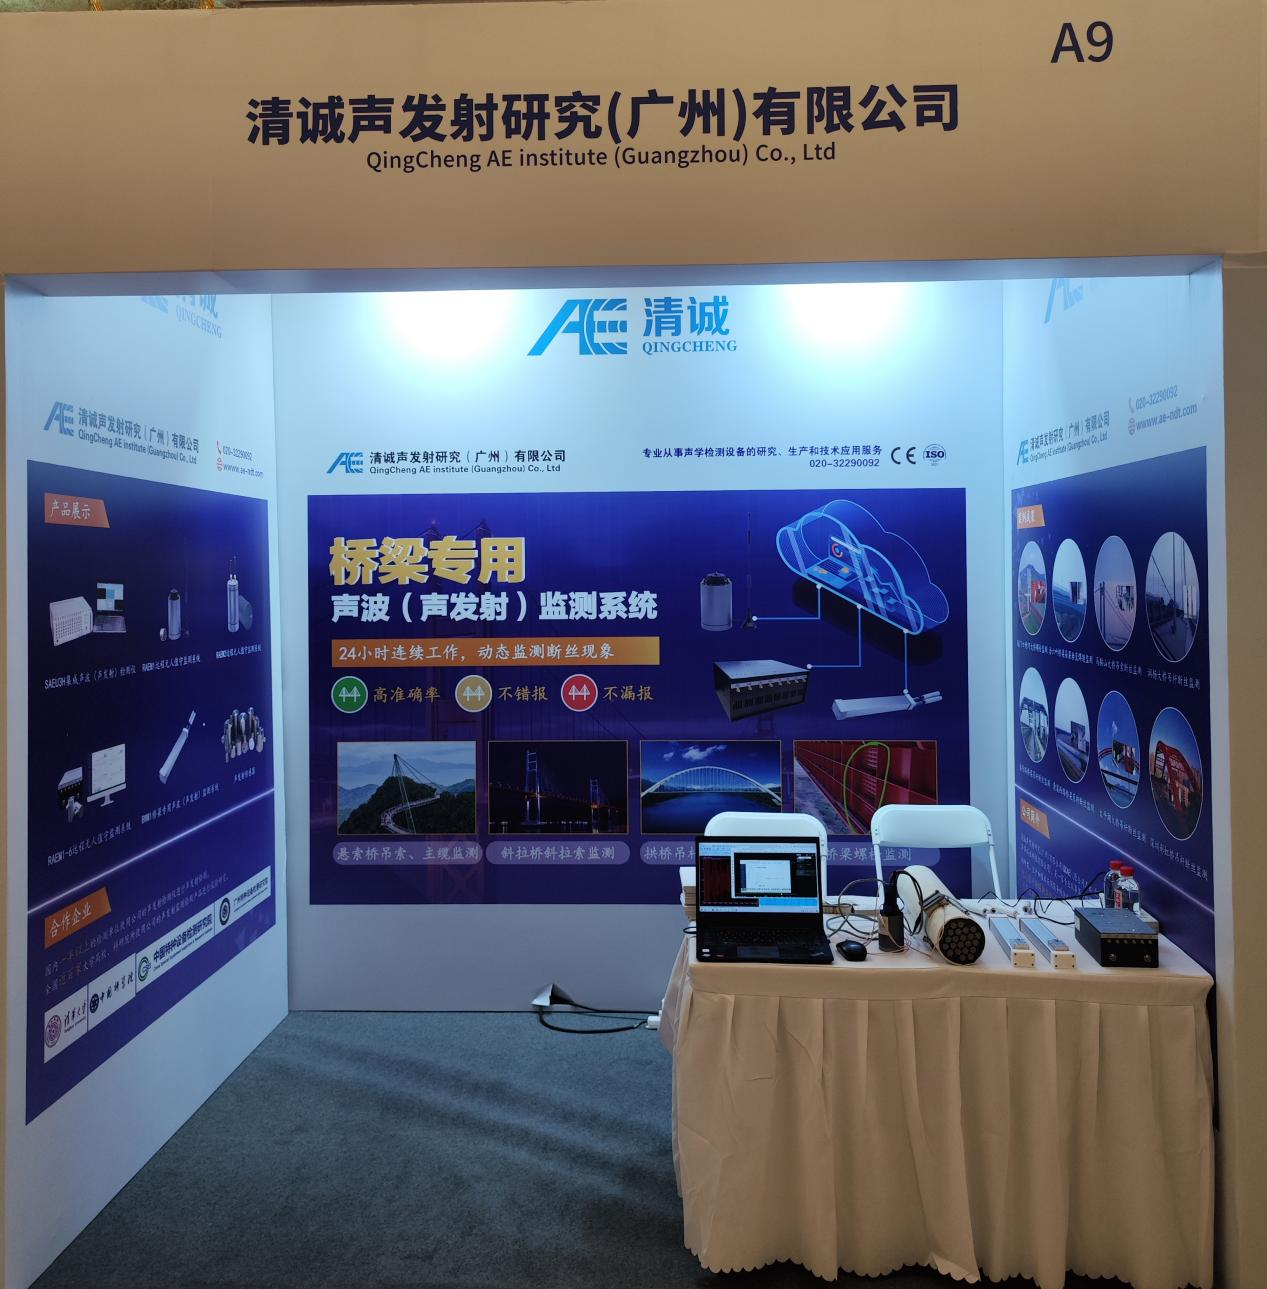 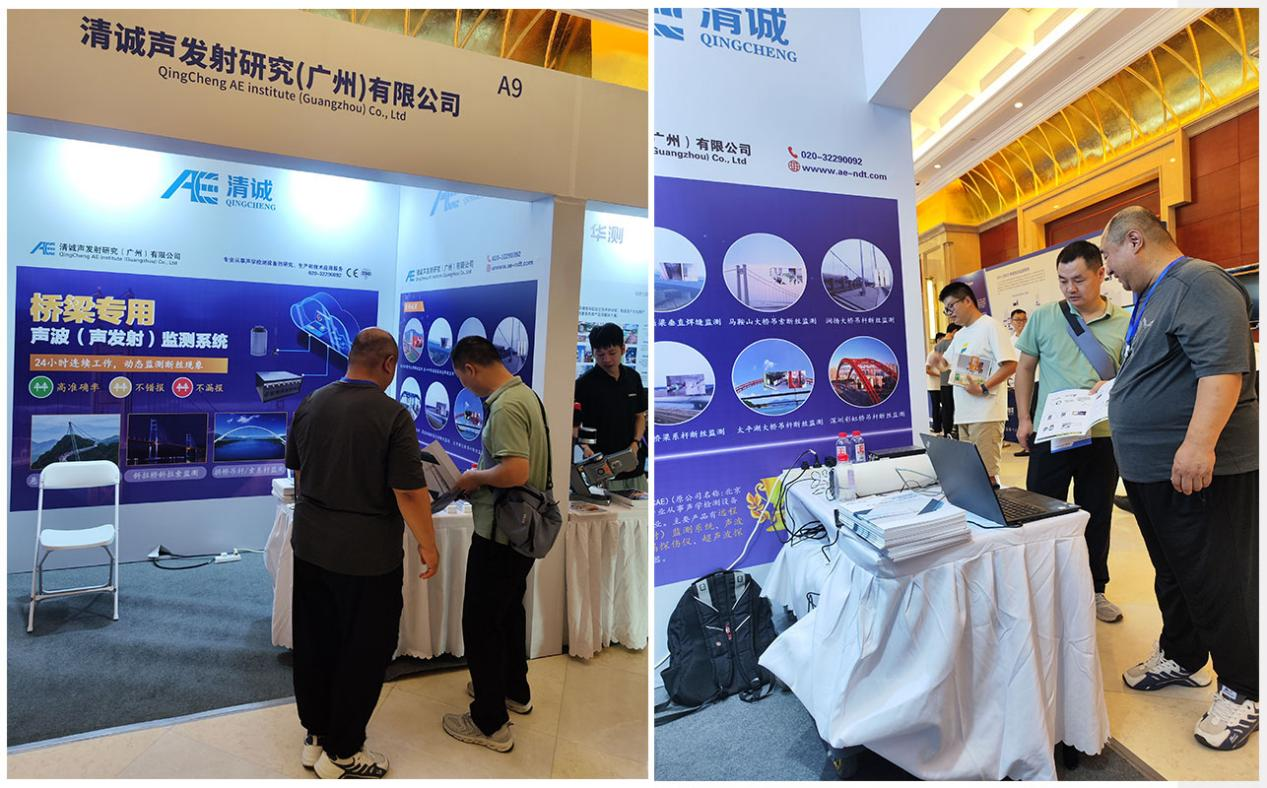 在展位上,我们展示了最新的桥梁专用声波(声发射)监测系统 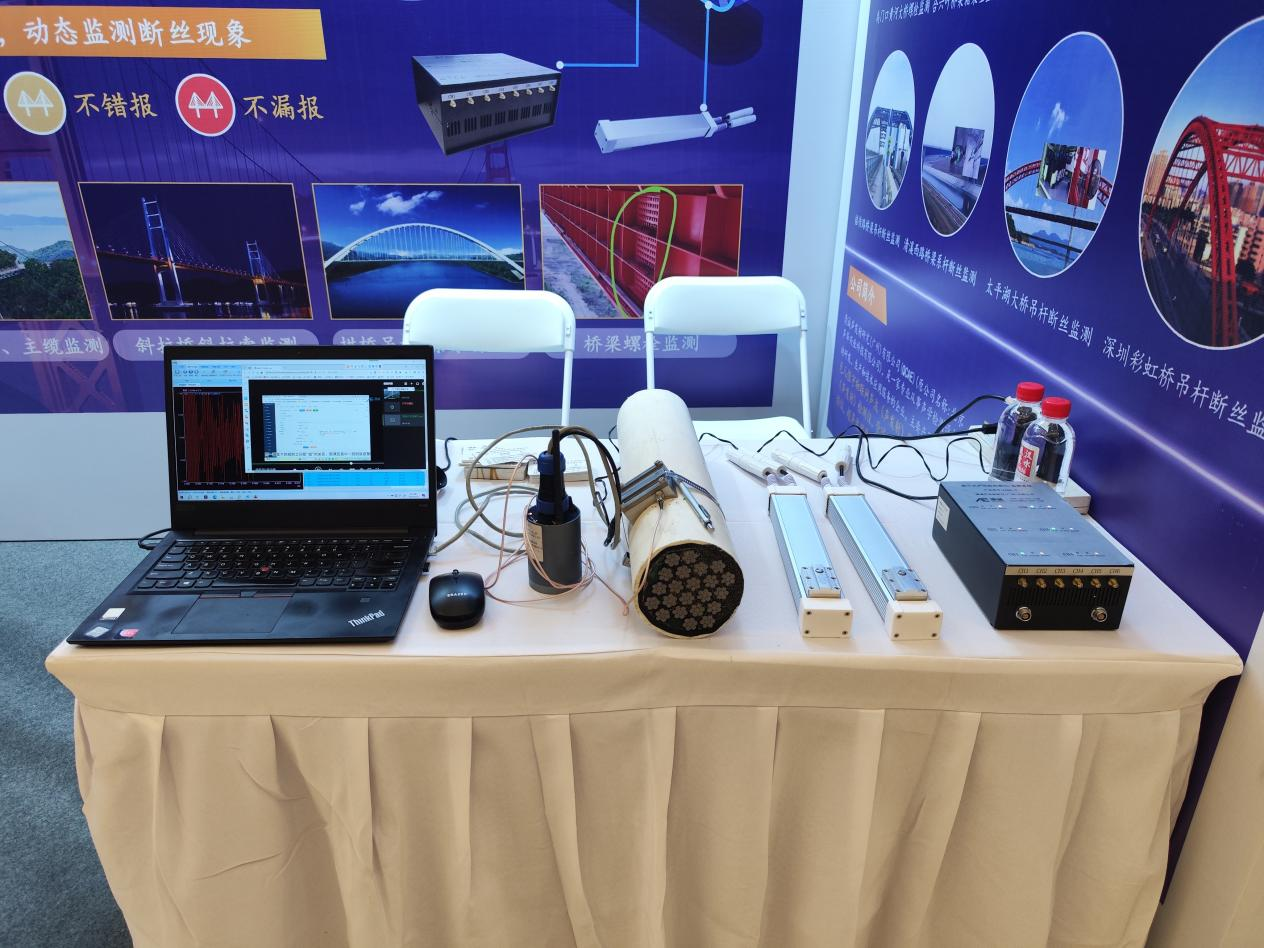 1、<a href="https://ae-ndt.com/plus/view.php?aid=755">BWM1桥梁专用声波(声发射)监测系统</a> BWM1采用ARM系统架构,内部嵌有ADC模数转换电路、滤波及调理电路,网口通讯,可通过路由器对接云平台,POE网线提供通信链路的同时也为BWM1供电,采集器为前置放大器电路板一体化的绑带式结构设计。 第六届公路桥隧健康监测与安全运营技术研讨会 2、<a href="https://ae-ndt.com/plus/view.php?aid=595">RAEM1悬索桥吊索、主缆,斜拉桥斜拉索,拱桥吊杆(索)系杆断丝智能声波(声发射)监测系统</a> 集信号采集控制、分析、储存和通讯为一体的智能物联网声发射监测系统,24小时连续工作的高可靠性,适用长期连续无人值守自动数据采集、存储、分析、输出并可分析断丝位置和程度。 第六届公路桥隧健康监测与安全运营技术研讨会 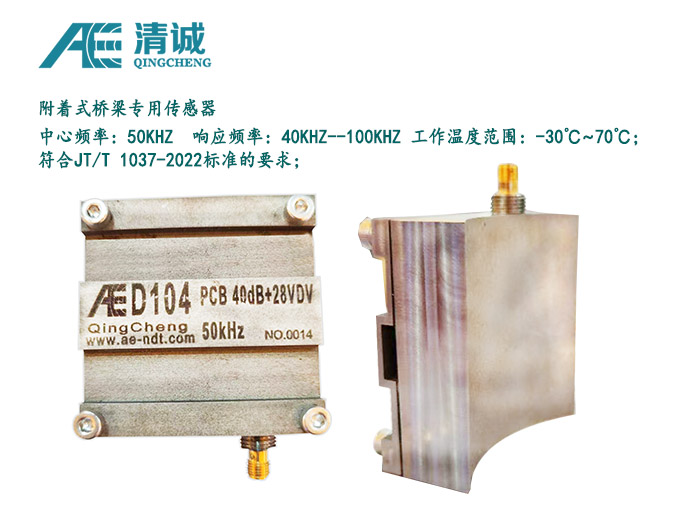 如需查询或进一步信息,请访问 <a href="www.ae-ndt.com">www.ae-ndt.com</a> |
| json metadata | {"tags":["shm"],"image":["https://cdn.steemitimages.com/DQmYgTwbKmGYy3BFEgnF8uEGehR4ACXVusRzKdg8a5AaVmb/%E5%9B%BE%E7%89%871.png","https://cdn.steemitimages.com/DQmZWHZrgsa8U6YAwzPTkir7fpFfRnaBDXb12Vt3fQXHmQG/%E5%9B%BE%E7%89%872.png","https://cdn.steemitimages.com/DQmW8hrJPXg5NMs3x5pDGQzMjZABs8ZhQVwZfkvSijaKCTN/%E5%9B%BE%E7%89%873.png","https://cdn.steemitimages.com/DQmTQfPfkjhdetic12JBRNwYhAgTPsuTDkTjvZY73KSfsLk/%E5%9B%BE%E7%89%874.png","https://cdn.steemitimages.com/DQmXtSAVVgC3QkZqoi3antu3AZFUVNULXy9MsZy9YYEd1Df/%E5%9B%BE%E7%89%875.png"],"links":["https://ae-ndt.com/plus/view.php?aid=755","https://ae-ndt.com/plus/view.php?aid=595"],"app":"steemit/0.2","format":"markdown"} |
| parent author | |
| parent permlink | shm |
| permlink | 2024-9-9 |
| title | 2024年9月9日作为参展商参加第六届公路桥隧健康监测与安全运营技术研讨会 |
| Transaction Info | Block #88513717/Trx 8ed9d102b61ead197a087b0676aee38dc267251d |
View Raw JSON Data
{
"block": 88513717,
"op": [
"comment",
{
"author": "barrylee",
"body": "2024年9月9日作为参展商参加第六届公路桥隧健康监测与安全运营技术研讨会\n\n 我司于2024年9月9日至9月11日作为参展商参加在武汉举办的第六届公路桥隧健康监测与安全运营技术研讨会!本届会议由中国公路学会秘书处和湖北交通投资集团有限公司主办,以”安全·智能·耐久”为主题。!\n\n\n\n\n\n\n\n\n\n 在展位上,我们展示了最新的桥梁专用声波(声发射)监测系统\n\n\n\n1、<a href=\"https://ae-ndt.com/plus/view.php?aid=755\">BWM1桥梁专用声波(声发射)监测系统</a>\nBWM1采用ARM系统架构,内部嵌有ADC模数转换电路、滤波及调理电路,网口通讯,可通过路由器对接云平台,POE网线提供通信链路的同时也为BWM1供电,采集器为前置放大器电路板一体化的绑带式结构设计。\n第六届公路桥隧健康监测与安全运营技术研讨会\n\n2、<a href=\"https://ae-ndt.com/plus/view.php?aid=595\">RAEM1悬索桥吊索、主缆,斜拉桥斜拉索,拱桥吊杆(索)系杆断丝智能声波(声发射)监测系统</a>\n集信号采集控制、分析、储存和通讯为一体的智能物联网声发射监测系统,24小时连续工作的高可靠性,适用长期连续无人值守自动数据采集、存储、分析、输出并可分析断丝位置和程度。\n第六届公路桥隧健康监测与安全运营技术研讨会\n\n\n\n\n 如需查询或进一步信息,请访问 <a href=\"www.ae-ndt.com\">www.ae-ndt.com</a>",
"json_metadata": "{\"tags\":[\"shm\"],\"image\":[\"https://cdn.steemitimages.com/DQmYgTwbKmGYy3BFEgnF8uEGehR4ACXVusRzKdg8a5AaVmb/%E5%9B%BE%E7%89%871.png\",\"https://cdn.steemitimages.com/DQmZWHZrgsa8U6YAwzPTkir7fpFfRnaBDXb12Vt3fQXHmQG/%E5%9B%BE%E7%89%872.png\",\"https://cdn.steemitimages.com/DQmW8hrJPXg5NMs3x5pDGQzMjZABs8ZhQVwZfkvSijaKCTN/%E5%9B%BE%E7%89%873.png\",\"https://cdn.steemitimages.com/DQmTQfPfkjhdetic12JBRNwYhAgTPsuTDkTjvZY73KSfsLk/%E5%9B%BE%E7%89%874.png\",\"https://cdn.steemitimages.com/DQmXtSAVVgC3QkZqoi3antu3AZFUVNULXy9MsZy9YYEd1Df/%E5%9B%BE%E7%89%875.png\"],\"links\":[\"https://ae-ndt.com/plus/view.php?aid=755\",\"https://ae-ndt.com/plus/view.php?aid=595\"],\"app\":\"steemit/0.2\",\"format\":\"markdown\"}",
"parent_author": "",
"parent_permlink": "shm",
"permlink": "2024-9-9",
"title": "2024年9月9日作为参展商参加第六届公路桥隧健康监测与安全运营技术研讨会"
}
],
"op_in_trx": 0,
"timestamp": "2024-09-11T03:20:09",
"trx_id": "8ed9d102b61ead197a087b0676aee38dc267251d",
"trx_in_block": 1,
"virtual_op": 0
}barryleepublished a new post: qawrums-is-a-proud-sponsor-of-ewgae-20242024/09/10 07:31:42
barryleepublished a new post: qawrums-is-a-proud-sponsor-of-ewgae-2024
2024/09/10 07:31:42
| author | barrylee |
| body | QAWRUMS is a proud sponsor of EWGAE 2024. Our representative will be at the event to present our IoT AE systems and demostrations. There will also be an oral presentation of our last paper "Research on the Application of AI in Acoustic Emission Waveform Data Pattern Recognition". Welcome to visit our booth and know more! Mark the date and come! 😉 https://aendt.com/acoustic/news/event/  |
| json metadata | {"tags":["ewgae"],"image":["https://cdn.steemitimages.com/DQmaLin7dwZYwjSdSP1hp9j2ECBopuzp76sRx9vAdvfTLth/22.jpg"],"links":["https://aendt.com/acoustic/news/event/"],"app":"steemit/0.2","format":"markdown"} |
| parent author | |
| parent permlink | ewgae |
| permlink | qawrums-is-a-proud-sponsor-of-ewgae-2024 |
| title | QAWRUMS is a proud sponsor of EWGAE 2024 |
| Transaction Info | Block #88489999/Trx 63bedd4e9f4665bc43999734e946068de2ae8420 |
View Raw JSON Data
{
"block": 88489999,
"op": [
"comment",
{
"author": "barrylee",
"body": "QAWRUMS is a proud sponsor of EWGAE 2024. Our representative will be at the event to present our IoT AE systems and demostrations. There will also be an oral presentation of our last paper \"Research on the Application of AI in Acoustic Emission Waveform Data Pattern Recognition\". Welcome to visit our booth and know more! Mark the date and come! 😉 \nhttps://aendt.com/acoustic/news/event/\n\n",
"json_metadata": "{\"tags\":[\"ewgae\"],\"image\":[\"https://cdn.steemitimages.com/DQmaLin7dwZYwjSdSP1hp9j2ECBopuzp76sRx9vAdvfTLth/22.jpg\"],\"links\":[\"https://aendt.com/acoustic/news/event/\"],\"app\":\"steemit/0.2\",\"format\":\"markdown\"}",
"parent_author": "",
"parent_permlink": "ewgae",
"permlink": "qawrums-is-a-proud-sponsor-of-ewgae-2024",
"title": "QAWRUMS is a proud sponsor of EWGAE 2024"
}
],
"op_in_trx": 0,
"timestamp": "2024-09-10T07:31:42",
"trx_id": "63bedd4e9f4665bc43999734e946068de2ae8420",
"trx_in_block": 2,
"virtual_op": 0
}2024/09/06 10:36:24
2024/09/06 10:36:24
| author | barrylee |
| body | hey |
| json metadata | {"app":"steemit/0.2"} |
| parent author | claudia |
| parent permlink | sicv6z |
| permlink | sje04o |
| title | |
| Transaction Info | Block #88378836/Trx ba370ec2ca00ac93674ef268f56ffdac7305462f |
View Raw JSON Data
{
  "block": 88378836,
  "op": [
    "comment",
    {
      "author": "barrylee",
      "body": "hey",
      "json_metadata": "{\"app\":\"steemit/0.2\"}",
      "parent_author": "claudia",
      "parent_permlink": "sicv6z",
      "permlink": "sje04o",
      "title": ""
    }
  ],
  "op_in_trx": 0,
  "timestamp": "2024-09-06T10:36:24",
  "trx_id": "ba370ec2ca00ac93674ef268f56ffdac7305462f",
  "trx_in_block": 4,
  "virtual_op": 0
}barryleepublished a new post: quality-inspection-using-acoustic-emission-monitoring2024/09/06 10:27:18
barryleepublished a new post: quality-inspection-using-acoustic-emission-monitoring
2024/09/06 10:27:18
| author | barrylee |
| body | Quality inspection using acoustic emission monitoring Soundwel investigates a new promising real-time non-destructive examination technique for welding processes, based on <a href="https://www.aendt.com">acoustic emission</a> during the weld cycle. The acoustic emission technique is based on the detection and conversion of high-frequency elastic waves into electrical signals. <a href="https://www.aendt.com/blog/acoustic-emission-testing.html">Acoustic emission monitoring</a> (AEM) is currently being used for the surveillance of industrial processes or structures. In this project, the application of this technology is expanded towards welding processes. Acoustic emission monitoring Nowadays acoustic emission (AE) is widely used for many different applications, ranging from monitoring welding processes to controlling the integrity of bridges during their lifespan. By using AEM as an in-line quality control system, it is possible to listen to the sounds emitted by materials during the investigated process. The main goal of AEM is to surveil industrial processes or structures in a non-destructive way. The AEM technique is based on the detection and conversion of high-frequency waves into electrical signals. When a metal is stressed, for example during plastic deformation, fracture or other local instabilities, low-level sounds are emitted. The energy for these sounds originates from the stored elastic energy in the object or from externally performed work. The waves will cause a displacement at the surface that can be measured with a sensor. In order to accurately distinguish the signals originating from the AEM source, external sounds should be excluded. This can be done for example by looking into the frequency domain, since the sound waves of the material have relatively high frequencies. AEM is currently being used for the surveillance of industrial processes or structures. Acoustic emission monitoring of welding processes Welding industries are faced with the need to monitor the weld quality and system integrity more frequently, in order to guarantee the structural functionality of the products. Hence, weld quality is becoming increasingly important as customer expectations increase. A primary concern is to detect weld defects fast, reliable and cost-effectively. Current destructive and non-destructive techniques are time-consuming and expensive and are not always appropriate for assessing the weld quality. AEM as an in-line quality control system allows to overcome the current limitations of the conventional characterization techniques. AEM could eliminate or considerably reduce the post-production selective inspection, reduce the number of destructive tests and increase the reliability of the assembly process. Acoustic emission monitoring adds a new dimension to NDT of welds. The wide-ranging applications of acoustic emission monitoring are illustrated by examples of real-time data from submerged-arc, gas tungsten-arc and resistance spot welding. ![acoustische_emissie[1].jpg](https://cdn.steemitimages.com/DQmUyePgdjaHgFzrXyHAvbWbRTYNQ3ULvWLoxakp3thhr46/acoustische_emissie[1].jpg) Advantages of this technique Cheaper and faster non-destructive control of welds Lower cost for optimizing welding parameters or determining the parameter window Real time system: Early and fast detection of welding defects possible Less destructive testing is possible |
| json metadata | {"tags":["weldingmonitoring"],"image":["https://cdn.steemitimages.com/DQmUyePgdjaHgFzrXyHAvbWbRTYNQ3ULvWLoxakp3thhr46/acoustische_emissie[1].jpg"],"links":["https://www.aendt.com","https://www.aendt.com/blog/acoustic-emission-testing.html"],"app":"steemit/0.2","format":"markdown"} |
| parent author | |
| parent permlink | weldingmonitoring |
| permlink | quality-inspection-using-acoustic-emission-monitoring |
| title | Quality inspection using acoustic emission monitoring |
| Transaction Info | Block #88378654/Trx 1f851e0f428360dec975284912a7468aebb2e7db |
View Raw JSON Data
{
  "block": 88378654,
  "op": [
    "comment",
    {
      "author": "barrylee",
      "body": "Quality inspection using acoustic emission monitoring\nSoundwel investigates a new promising real-time non-destructive examination technique for welding processes, based on <a href=\"https://www.aendt.com\">acoustic emission</a> during the weld cycle. The acoustic emission technique is based on the detection and conversion of high-frequency elastic waves into electrical signals. <a href=\"https://www.aendt.com/blog/acoustic-emission-testing.html\">Acoustic emission monitoring</a> (AEM) is currently being used for the surveillance of industrial processes or structures. In this project, the application of this technology is expanded towards welding processes.\n\nAcoustic emission monitoring\nNowadays acoustic emission (AE) is widely used for many different applications, ranging from monitoring welding processes to controlling the integrity of bridges during their lifespan. By using AEM as an in-line quality control system, it is possible to listen to the sounds emitted by materials during the investigated process. The main goal of AEM is to surveil industrial processes or structures in a non-destructive way.\n\nThe AEM technique is based on the detection and conversion of high-frequency waves into electrical signals. When a metal is stressed, for example during plastic deformation, fracture or other local instabilities, low-level sounds are emitted. The energy for these sounds originates from the stored elastic energy in the object or from externally performed work. The waves will cause a displacement at the surface that can be measured with a sensor. In order to accurately distinguish the signals originating from the AEM source, external sounds should be excluded. This can be done for example by looking into the frequency domain, since the sound waves of the material have relatively high frequencies.\n\nAEM is currently being used for the surveillance of industrial processes or structures.\n\nAcoustic emission monitoring of welding processes\nWelding industries are faced with the need to monitor the weld quality and system integrity more frequently, in order to guarantee the structural functionality of the products. Hence, weld quality is becoming increasingly important as customer expectations increase. A primary concern is to detect weld defects fast, reliable and cost-effectively. Current destructive and non-destructive techniques are time-consuming and expensive and are not always appropriate for assessing the weld quality. AEM as an in-line quality control system allows to overcome the current limitations of the conventional characterization techniques.\n\nAEM could eliminate or considerably reduce the post-production selective inspection, reduce the number of destructive tests and increase the reliability of the assembly process.\n\nAcoustic emission monitoring adds a new dimension to NDT of welds. The wide-ranging applications of acoustic emission monitoring are illustrated by examples of real-time data from submerged-arc, gas tungsten-arc and resistance spot welding.\n\n\n![acoustische_emissie[1].jpg](https://cdn.steemitimages.com/DQmUyePgdjaHgFzrXyHAvbWbRTYNQ3ULvWLoxakp3thhr46/acoustische_emissie[1].jpg)\n\n\nAdvantages of this technique\nCheaper and faster non-destructive control of welds\nLower cost for optimizing welding parameters or determining the parameter window\nReal time system: Early and fast detection of welding defects possible\nLess destructive testing is possible",
      "json_metadata": "{\"tags\":[\"weldingmonitoring\"],\"image\":[\"https://cdn.steemitimages.com/DQmUyePgdjaHgFzrXyHAvbWbRTYNQ3ULvWLoxakp3thhr46/acoustische_emissie[1].jpg\"],\"links\":[\"https://www.aendt.com\",\"https://www.aendt.com/blog/acoustic-emission-testing.html\"],\"app\":\"steemit/0.2\",\"format\":\"markdown\"}",
      "parent_author": "",
      "parent_permlink": "weldingmonitoring",
      "permlink": "quality-inspection-using-acoustic-emission-monitoring",
      "title": "Quality inspection using acoustic emission monitoring"
    }
  ],
  "op_in_trx": 0,
  "timestamp": "2024-09-06T10:27:18",
  "trx_id": "1f851e0f428360dec975284912a7468aebb2e7db",
  "trx_in_block": 7,
  "virtual_op": 0
}barryleepublished a new post: acoustic-emission-detection-of-three-gorges-hydropower-volute2024/09/05 09:57:45
barryleepublished a new post: acoustic-emission-detection-of-three-gorges-hydropower-volute
2024/09/05 09:57:45
| author | barrylee |
| body | Using <a href="https://www.aendt.com/blog/acoustic-emission-testing.html">acoustic emission</a> methods to monitor and detect leaks in the spiral case during the water filling pressurization and holding pressure stages, while also performing localization. <a href="https://www.aendt.com">Qawrums Ltd.</a> has conducted detection and evaluation on the stay ring machining and spiral case of the №1 hydraulic generator unit in the left bank powerhouse of the Three Gorges Project. ![1-2303091450521J[1].jpg](https://cdn.steemitimages.com/DQmfYUKPbSB38P5PfataRkWU6BrqZdncVcrxdJ83zSATKGS/1-2303091450521J[1].jpg) The Three Gorges Project involves a massive investment, and the only means of recovering this investment is through the power generation revenue of the Three Gorges Power Station. Therefore, the performance and operational reliability of the hydraulic turbine, as one of the core components of the power station, are crucial for realizing the project’s benefits. The rated output of the Three Gorges hydraulic turbine is 710 MW, with a runner diameter of 10 meters, making it the largest mixed-flow hydraulic turbine in the world in terms of output and size. The structural design and manufacturing process of large-capacity, large-size mixed-flow hydraulic turbines also present a technical challenge. |
| json metadata | {"tags":["spiral"],"image":["https://cdn.steemitimages.com/DQmfYUKPbSB38P5PfataRkWU6BrqZdncVcrxdJ83zSATKGS/1-2303091450521J[1].jpg"],"links":["https://www.aendt.com/blog/acoustic-emission-testing.html","https://www.aendt.com"],"app":"steemit/0.2","format":"markdown"} |
| parent author | |
| parent permlink | spiral |
| permlink | acoustic-emission-detection-of-three-gorges-hydropower-volute |
| title | Acoustic emission detection of Three Gorges hydropower volute |
| Transaction Info | Block #88349358/Trx bd736f7f1fd1892fca729d4cf30fcc1a956653b8 |
View Raw JSON Data
{
  "block": 88349358,
  "op": [
    "comment",
    {
      "author": "barrylee",
      "body": "Using <a href=\"https://www.aendt.com/blog/acoustic-emission-testing.html\">acoustic emission</a> methods to monitor and detect leaks in the spiral case during the water filling pressurization and holding pressure stages, while also performing localization. <a href=\"https://www.aendt.com\">Qawrums Ltd.</a> has conducted detection and evaluation on the stay ring machining and spiral case of the №1 hydraulic generator unit in the left bank powerhouse of the Three Gorges Project.\n\n![1-2303091450521J[1].jpg](https://cdn.steemitimages.com/DQmfYUKPbSB38P5PfataRkWU6BrqZdncVcrxdJ83zSATKGS/1-2303091450521J[1].jpg)\n\n\nThe Three Gorges Project involves a massive investment, and the only means of recovering this investment is through the power generation revenue of the Three Gorges Power Station. Therefore, the performance and operational reliability of the hydraulic turbine, as one of the core components of the power station, are crucial for realizing the project’s benefits. The rated output of the Three Gorges hydraulic turbine is 710 MW, with a runner diameter of 10 meters, making it the largest mixed-flow hydraulic turbine in the world in terms of output and size. The structural design and manufacturing process of large-capacity, large-size mixed-flow hydraulic turbines also present a technical challenge.",
      "json_metadata": "{\"tags\":[\"spiral\"],\"image\":[\"https://cdn.steemitimages.com/DQmfYUKPbSB38P5PfataRkWU6BrqZdncVcrxdJ83zSATKGS/1-2303091450521J[1].jpg\"],\"links\":[\"https://www.aendt.com/blog/acoustic-emission-testing.html\",\"https://www.aendt.com\"],\"app\":\"steemit/0.2\",\"format\":\"markdown\"}",
      "parent_author": "",
      "parent_permlink": "spiral",
      "permlink": "acoustic-emission-detection-of-three-gorges-hydropower-volute",
      "title": "Acoustic emission detection of Three Gorges hydropower volute"
    }
  ],
  "op_in_trx": 0,
  "timestamp": "2024-09-05T09:57:45",
  "trx_id": "bd736f7f1fd1892fca729d4cf30fcc1a956653b8",
  "trx_in_block": 3,
  "virtual_op": 0
}bluesniperupvoted (100.00%) @barrylee / machine-tool-collision-avoidance-system2024/08/25 05:51:51
bluesniperupvoted (100.00%) @barrylee / machine-tool-collision-avoidance-system
2024/08/25 05:51:51
| author | barrylee |
| permlink | machine-tool-collision-avoidance-system |
| voter | bluesniper |
| weight | 10000 (100.00%) |
| Transaction Info | Block #88029162/Trx 20e0e074e30a368df44e87f54e7d0cbb6cba53c5 |
View Raw JSON Data
{
  "block": 88029162,
  "op": [
    "vote",
    {
      "author": "barrylee",
      "permlink": "machine-tool-collision-avoidance-system",
      "voter": "bluesniper",
      "weight": 10000
    }
  ],
  "op_in_trx": 0,
  "timestamp": "2024-08-25T05:51:51",
  "trx_id": "20e0e074e30a368df44e87f54e7d0cbb6cba53c5",
  "trx_in_block": 1,
  "virtual_op": 0
}barryleepublished a new post: machine-tool-collision-avoidance-system2024/08/25 05:38:39
barryleepublished a new post: machine-tool-collision-avoidance-system
2024/08/25 05:38:39
| author | barrylee |
| body | Tool collision refers to a machine tool accident in which a machine tool accidentally collides with a workpiece, chuck or tailstock during movement. A machine tool collision may cause the workpiece to be scrapped, the tool to be damaged, the components to be destroyed, and the accuracy to be reduced. The faster the machine tool stops, the less damage it will cause.<a href="https://www.aendt.com">Qawrums Ltd.</a> has launched a device for detecting and monitoring tool collisions — a <a href="https://www.aendt.com/acoustic/products/p2/305.html">machine tool collision avoidance system</a>. Equipment Introduction: <a href="https://www.aendt.com/products/ae-detection-system/191.html">RAEM1 Acoustic Emission Detection Monitor</a> <a href="https://www.aendt.com/acoustic/products/Sensors/IntegralPreamplifierSensors/2022/1122/119.html">GI150–1 AE Sensor</a> Equipment Parameters: GI150–1Built-in preamp waterproof acoustic emission sensor Frequency range60Khz~400KHZResonant frequency150KHzSensitivity>75dBPreamplifier40dB28VConnectorSMA Principle When the machine tool is in operation, it may malfunction occasionally, causing the tool to collide and generate an acoustic emission (sound wave) signal. The acoustic emission sensor collects this signal. After the signal is analyzed and processed at high speed by the acoustic emission host, it is determined whether the spindle is in an abnormal condition, and the collision signal is output in time to control the machine tool to stop in time. When a tool collision occurs, the system rapidly identifies and issues an emergency stop signal within 1ms. Process Visualization Result To reduce machine cycle time, increase machine working speed when no collision is detected, thus reducing processing time. Reduce occasional tool collisions caused by unexpected machine displacements during operational states. Prevent damage to machine tool spindles or robotic arms due to occasional impacts or overloads, which can lead to decreased spindle precision. Comparison between traditional monitoring methods and machine tool collision avoidance system: Comparison ItemsTraditional Monitoring MethodsMachine Tool Collision Avoidance SystemsMonitoring MethodManual monitoring or equipment feedbackReal-time monitoring based on acoustic emission signalsData SourceEquipment driver feedbackReal-time collection of acoustic emission signals by sensorsMonitoring Scope/Critical parts of the equipmentAlarm TriggerManual triggerAutomatic alarm on anomalyShutdown MethodManual shutdownOutput collision signal to control machine PLC for automatic shutdownResponse TimeDepending on specific incident1msData AnalysisManual compilation, human analysisAutomatic system analysis Scope of Application CNC machine tools, grinding machines, milling-turning composite machines, horizontal or vertical machining centers, and similar equipment. Principle When a machine tool experiences an accidental fault resulting in a tool collision, it generates acoustic emission (sound wave) signals. The acoustic emission sensor detects these signals and transmits them via signal cable to acoustic emission monitor for analysis and processing. Within 1ms, the acoustic emission monitor sends a collision signal to the user’s machine control system, triggering an emergency stop of the machine tool. System Components Communication method Acoustic emission monitor, signal cable, acoustic emission sensors, magnetic clamp Wiring terminal digital output Installation The acoustic emission sensor is installed on the back of the tool with the assistance of a magnetic clamp. The signal cable is led out from the protective sleeve and connected to the acoustic emission monitor. The monitor is then connected to the client’s machine. Application Case 1: Tool Collision Acoustic Emission Monitoring In March 2024, our company was invited by a mechanical company to conduct tool collision experiments on a grinding machine. The machine spindle of the grinder was fixed on the left side, and the grinding wheel rotated on the spindle. The object to be ground (tool) was installed on the right bracket. Because the spindle was rotating, there was a lot of noise. If it was installed on the fixed bracket behind the spindle, there would be multiple structural parts in the middle, and the attenuation was very large. Since the bracket would rotate to adjust the angle to grind both sides of the object (the rotation angle was about 150°), the acoustic emission sensor was installed on the right bracket (i.e. the back of the tool position). The signal amplitude /energy-arrival time graph collected during tool processing Application Case 2: Monitoring of Machining Tool Wear Using Acoustic Emission (AE) The data acquisition module was installed on the tool to collect data, which was then uploaded to the cloud. Through specific algorithms, the system detected faults or wear, and alerts were pushed to the client’s device. This setup prevented tool failures and equipment damages, reduced the downtime, and enhanced the production efficiency. Acoustic Emission Characteristic Parameters Curve Based on Ring Count and Energy 1. Using appropriate sensors and filters can effectively eliminate on-site noise interference. The main acoustic emission signals generated during the machining process are material cracking of workpieces and friction signals between tools and workpieces. 2. Because the original data covers multiple types of acoustic emission signals, it is not easy to distinctly differentiate between single acoustic emission characteristic parameters before and after comparison. 3. By combining various sets of acoustic emission characteristic parameters, such as energy and ringing counts, a comprehensive judgment method can effectively identify early signs of tool wear. |
| json metadata | {"tags":["machinetools"],"links":["https://www.aendt.com","https://www.aendt.com/acoustic/products/p2/305.html","https://www.aendt.com/products/ae-detection-system/191.html","https://www.aendt.com/acoustic/products/Sensors/IntegralPreamplifierSensors/2022/1122/119.html"],"app":"steemit/0.2","format":"markdown"} |
| parent author | |
| parent permlink | machinetools |
| permlink | machine-tool-collision-avoidance-system |
| title | Machine Tool Collision Avoidance System |
| Transaction Info | Block #88028898/Trx 9d2aa23d31cd41c2a332f70aec7c4c6d3daa7bbd |
View Raw JSON Data
{
  "block": 88028898,
  "op": [
    "comment",
    {
      "author": "barrylee",
      "body": "Tool collision refers to a machine tool accident in which a machine tool accidentally collides with a workpiece, chuck or tailstock during movement. A machine tool collision may cause the workpiece to be scrapped, the tool to be damaged, the components to be destroyed, and the accuracy to be reduced. The faster the machine tool stops, the less damage it will cause.<a href=\"https://www.aendt.com\">Qawrums Ltd.</a> has launched a device for detecting and monitoring tool collisions — a <a href=\"https://www.aendt.com/acoustic/products/p2/305.html\">machine tool collision avoidance system</a>.\n\nEquipment Introduction:\n<a href=\"https://www.aendt.com/products/ae-detection-system/191.html\">RAEM1 Acoustic Emission Detection Monitor</a>\n<a href=\"https://www.aendt.com/acoustic/products/Sensors/IntegralPreamplifierSensors/2022/1122/119.html\">GI150–1 AE Sensor</a>\n\nEquipment Parameters: GI150–1Built-in preamp waterproof acoustic emission sensor\nFrequency range60Khz~400KHZResonant frequency150KHzSensitivity>75dBPreamplifier40dB28VConnectorSMA\n\nPrinciple\nWhen the machine tool is in operation, it may malfunction occasionally, causing the tool to collide and generate an acoustic emission (sound wave) signal. The acoustic emission sensor collects this signal. After the signal is analyzed and processed at high speed by the acoustic emission host, it is determined whether the spindle is in an abnormal condition, and the collision signal is output in time to control the machine tool to stop in time.\n\n\n\nWhen a tool collision occurs, the system rapidly identifies and issues an emergency stop signal within 1ms.\n\nProcess Visualization\n\nResult\nTo reduce machine cycle time, increase machine working speed when no collision is detected, thus reducing processing time.\nReduce occasional tool collisions caused by unexpected machine displacements during operational states.\nPrevent damage to machine tool spindles or robotic arms due to occasional impacts or overloads, which can lead to decreased spindle precision.\nComparison between traditional monitoring methods and machine tool collision avoidance system:\n\nComparison ItemsTraditional Monitoring MethodsMachine Tool Collision Avoidance SystemsMonitoring MethodManual monitoring or equipment feedbackReal-time monitoring based on acoustic emission signalsData SourceEquipment driver feedbackReal-time collection of acoustic emission signals by sensorsMonitoring Scope/Critical parts of the equipmentAlarm TriggerManual triggerAutomatic alarm on anomalyShutdown MethodManual shutdownOutput collision signal to control machine PLC for automatic shutdownResponse TimeDepending on specific incident1msData AnalysisManual compilation, human analysisAutomatic system analysis\n\nScope of Application\nCNC machine tools, grinding machines, milling-turning composite machines, horizontal or vertical machining centers, and similar equipment.\n\n\n\n\n\nPrinciple\nWhen a machine tool experiences an accidental fault resulting in a tool collision, it generates acoustic emission (sound wave) signals. The acoustic emission sensor detects these signals and transmits them via signal cable to acoustic emission monitor for analysis and processing. Within 1ms, the acoustic emission monitor sends a collision signal to the user’s machine control system, triggering an emergency stop of the machine tool.\n\nSystem Components Communication method Acoustic emission monitor, signal cable, acoustic emission sensors, magnetic clamp Wiring terminal digital output\n\n\nInstallation\nThe acoustic emission sensor is installed on the back of the tool with the assistance of a magnetic clamp. The signal cable is led out from the protective sleeve and connected to the acoustic emission monitor. The monitor is then connected to the client’s machine.\n\nApplication Case 1: Tool Collision Acoustic Emission Monitoring\nIn March 2024, our company was invited by a mechanical company to conduct tool collision experiments on a grinding machine.\nThe machine spindle of the grinder was fixed on the left side, and the grinding wheel rotated on the spindle. The object to be ground (tool) was installed on the right bracket. Because the spindle was rotating, there was a lot of noise. If it was installed on the fixed bracket behind the spindle, there would be multiple structural parts in the middle, and the attenuation was very large. Since the bracket would rotate to adjust the angle to grind both sides of the object (the rotation angle was about 150°), the acoustic emission sensor was installed on the right bracket (i.e. the back of the tool position).\n\n\n\n\nThe signal amplitude /energy-arrival time graph collected during tool processing\n\nApplication Case 2: Monitoring of Machining Tool Wear Using Acoustic Emission (AE)\nThe data acquisition module was installed on the tool to collect data, which was then uploaded to the cloud. Through specific algorithms, the system detected faults or wear, and alerts were pushed to the client’s device. This setup prevented tool failures and equipment damages, reduced the downtime, and enhanced the production efficiency.\n\n\n\n\n\nAcoustic Emission Characteristic Parameters Curve Based on Ring Count and Energy\n\n1. Using appropriate sensors and filters can effectively eliminate on-site noise interference. The main acoustic emission signals generated during the machining process are material cracking of workpieces and friction signals between tools and workpieces.\n\n2. Because the original data covers multiple types of acoustic emission signals, it is not easy to distinctly differentiate between single acoustic emission characteristic parameters before and after comparison.\n\n3. By combining various sets of acoustic emission characteristic parameters, such as energy and ringing counts, a comprehensive judgment method can effectively identify early signs of tool wear.",
      "json_metadata": "{\"tags\":[\"machinetools\"],\"links\":[\"https://www.aendt.com\",\"https://www.aendt.com/acoustic/products/p2/305.html\",\"https://www.aendt.com/products/ae-detection-system/191.html\",\"https://www.aendt.com/acoustic/products/Sensors/IntegralPreamplifierSensors/2022/1122/119.html\"],\"app\":\"steemit/0.2\",\"format\":\"markdown\"}",
      "parent_author": "",
      "parent_permlink": "machinetools",
      "permlink": "machine-tool-collision-avoidance-system",
      "title": "Machine Tool Collision Avoidance System"
    }
  ],
  "op_in_trx": 0,
  "timestamp": "2024-08-25T05:38:39",
  "trx_id": "9d2aa23d31cd41c2a332f70aec7c4c6d3daa7bbd",
  "trx_in_block": 1,
  "virtual_op": 0
}2024/08/17 09:18:36
2024/08/17 09:18:36
| author | claudia |
| body | Escritura robada. |
| json metadata | {"app":"steemit/0.2"} |
| parent author | barrylee |
| parent permlink | intelligent-acoustic-emission-online-monitoring-and-fault-diagnosis-system-based-on-internet-of-things-and-big-data |
| permlink | sicv6z |
| title | |
| Transaction Info | Block #87803682/Trx 33e2ed2a8c3d5b7b1d214977f041b1265048174a |
View Raw JSON Data
{
  "block": 87803682,
  "op": [
    "comment",
    {
      "author": "claudia",
      "body": "Escritura robada.",
      "json_metadata": "{\"app\":\"steemit/0.2\"}",
      "parent_author": "barrylee",
      "parent_permlink": "intelligent-acoustic-emission-online-monitoring-and-fault-diagnosis-system-based-on-internet-of-things-and-big-data",
      "permlink": "sicv6z",
      "title": ""
    }
  ],
  "op_in_trx": 0,
  "timestamp": "2024-08-17T09:18:36",
  "trx_id": "33e2ed2a8c3d5b7b1d214977f041b1265048174a",
  "trx_in_block": 4,
  "virtual_op": 0
}2024/08/17 09:16:36
2024/08/17 09:16:36
| author | barrylee |
| permlink | intelligent-acoustic-emission-online-monitoring-and-fault-diagnosis-system-based-on-internet-of-things-and-big-data |
| voter | bluesniper |
| weight | 10000 (100.00%) |
| Transaction Info | Block #87803642/Trx f492ff75667f459f80982daa1785f52956a03561 |
View Raw JSON Data
{
  "block": 87803642,
  "op": [
    "vote",
    {
      "author": "barrylee",
      "permlink": "intelligent-acoustic-emission-online-monitoring-and-fault-diagnosis-system-based-on-internet-of-things-and-big-data",
      "voter": "bluesniper",
      "weight": 10000
    }
  ],
  "op_in_trx": 0,
  "timestamp": "2024-08-17T09:16:36",
  "trx_id": "f492ff75667f459f80982daa1785f52956a03561",
  "trx_in_block": 3,
  "virtual_op": 0
}2024/08/17 09:12:09
2024/08/17 09:12:09
| author | barrylee |
| body | @@ -239,32 +239,87 @@ stop operation) +%3Ca href=%22https://www.aendt.com/acoustic/solutions/s3/%22%3E tank bottom corr @@ -334,16 +334,20 @@ nitoring +%3C/a%3E , crack @@ -1410,32 +1410,100 @@ acoustic wave ( +%3Ca href=%22https://www.aendt.com/blog/acoustic-emission-testing.html%22%3E acoustic emissio @@ -1495,32 +1495,36 @@ coustic emission +%3C/a%3E ) monitoring and |
| json metadata | {"image":["https://cdn.steemitimages.com/DQmd3zbxinirH9BhTXWuiQHrwsYGJSEVSmTMwH61ADbgzyh/bigdata-online-condition-monitoring1.png","https://cdn.steemitimages.com/DQmYftSYmnkduAJknoau3f98n1XmePVxAdczL6oD6FVkdp9/bigdata-online-condition-monitoring2-2.png","https://cdn.steemitimages.com/DQmVUVjmRX5Bbt53dMxuyKBi3SYsEPx9NvSTc9qdHuxozBY/bigdata-online-condition-monitoring3.png","https://cdn.steemitimages.com/DQmT8Eoxu1a7NEwyWic2UMJmqZTvVdvQpByzBY7NnSJ8K9e/bigdata-online-condition-monitoring11.jpg","https://cdn.steemitimages.com/DQmaFqE9ogR7ERUrxPGV97wPGPmAwfzwxGbGkp73VsWdpPr/bigdata-online-condition-monitoring12-2.png","https://cdn.steemitimages.com/DQmQhqooDC7s6TJtsvgDv3pFKBauHRQQ2xfTnQ7PXQp3Ect/bigdata-online-condition-monitoring22-2.png"],"app":"steemit/0.2","format":"markdown","links":["https://www.aendt.com/acoustic/solutions/s3/","https://www.aendt.com/blog/acoustic-emission-testing.html"]} |
| parent author | |
| parent permlink | ndt |
| permlink | intelligent-acoustic-emission-online-monitoring-and-fault-diagnosis-system-based-on-internet-of-things-and-big-data |
| title | Intelligent acoustic emission online monitoring and fault diagnosis system based on Internet of Things and big data |
| Transaction Info | Block #87803553/Trx 18883f7359ecf16ebe24ac639cb7b11a001908cf |
View Raw JSON Data
{
  "block": 87803553,
  "op": [
    "comment",
    {
      "author": "barrylee",
      "body": "@@ -239,32 +239,87 @@\n stop operation) \n+%3Ca href=%22https://www.aendt.com/acoustic/solutions/s3/%22%3E\n tank bottom corr\n@@ -334,16 +334,20 @@\n nitoring\n+%3C/a%3E\n , crack \n@@ -1410,32 +1410,100 @@\n  acoustic wave (\n+%3Ca href=%22https://www.aendt.com/blog/acoustic-emission-testing.html%22%3E\n acoustic emissio\n@@ -1495,32 +1495,36 @@\n coustic emission\n+%3C/a%3E\n ) monitoring and\n",
      "json_metadata": "{\"image\":[\"https://cdn.steemitimages.com/DQmd3zbxinirH9BhTXWuiQHrwsYGJSEVSmTMwH61ADbgzyh/bigdata-online-condition-monitoring1.png\",\"https://cdn.steemitimages.com/DQmYftSYmnkduAJknoau3f98n1XmePVxAdczL6oD6FVkdp9/bigdata-online-condition-monitoring2-2.png\",\"https://cdn.steemitimages.com/DQmVUVjmRX5Bbt53dMxuyKBi3SYsEPx9NvSTc9qdHuxozBY/bigdata-online-condition-monitoring3.png\",\"https://cdn.steemitimages.com/DQmT8Eoxu1a7NEwyWic2UMJmqZTvVdvQpByzBY7NnSJ8K9e/bigdata-online-condition-monitoring11.jpg\",\"https://cdn.steemitimages.com/DQmaFqE9ogR7ERUrxPGV97wPGPmAwfzwxGbGkp73VsWdpPr/bigdata-online-condition-monitoring12-2.png\",\"https://cdn.steemitimages.com/DQmQhqooDC7s6TJtsvgDv3pFKBauHRQQ2xfTnQ7PXQp3Ect/bigdata-online-condition-monitoring22-2.png\"],\"app\":\"steemit/0.2\",\"format\":\"markdown\",\"links\":[\"https://www.aendt.com/acoustic/solutions/s3/\",\"https://www.aendt.com/blog/acoustic-emission-testing.html\"]}",
      "parent_author": "",
      "parent_permlink": "ndt",
      "permlink": "intelligent-acoustic-emission-online-monitoring-and-fault-diagnosis-system-based-on-internet-of-things-and-big-data",
      "title": "Intelligent acoustic emission online monitoring and fault diagnosis system based on Internet of Things and big data"
    }
  ],
  "op_in_trx": 0,
  "timestamp": "2024-08-17T09:12:09",
  "trx_id": "18883f7359ecf16ebe24ac639cb7b11a001908cf",
  "trx_in_block": 2,
  "virtual_op": 0
}2024/08/17 09:10:57
2024/08/17 09:10:57
| author | barrylee |
| body | Intelligent acoustic emission online monitoring and fault diagnosis system based on Internet of Things and big data 2024-08-17 16:05 Xie Jiehui, Liu Yating, Liu Shifeng QingCheng AE institute (Guangzhou) Co., Ltd Abstract: Online (non-stop operation) tank bottom corrosion monitoring, crack monitoring of pressure vessels and other structures, pipeline valve leakage monitoring, bridge wire rope broken wire monitoring, wind turbine blade crack monitoring, wind turbine bearing amusement facilities, wear/damage/lubrication status monitoring of various rotating mechanical equipment, tool wear and other machining process monitoring, and other online monitoring and fault diagnosis of various structures and equipment are hot topics in industry, national defense, and national economy, and are also technologies with great demand. With the rapid development of the Internet of Things, the Internet of Things acoustic wave (acoustic emission) monitoring and diagnosis technology that has emerged is a new technology for online monitoring and fault diagnosis of the above structures and equipment, and has been successfully applied in large numbers, demonstrating a strong prospect for wide application. This article reports and introduces the principles of the Internet of Things acoustic wave (acoustic emission) technology, the Internet of Things acoustic wave (acoustic emission) monitoring and diagnosis equipment, and the application solutions and practical application cases of online monitoring and fault diagnosis of structures and equipment. Keywords: sound wave; acoustic emission; online monitoring; Internet of Things; structure and equipment case; 1 Principle of Internet of Things Acoustic Wave (Acoustic Emission) Technology The Internet of Things Acoustic Wave (Acoustic Emission) system consists of an intelligent acoustic emission collector (sensor, preamplifier, embedded data acquisition, embedded analysis software, communication), cloud platform, and client. First, the acoustic emission sensor collects the acoustic emission signal from the monitored object (tank bottom plate, pressure vessel, pipeline valve, bridge wire rope, wind turbine blade, rotating machinery, tool machine, etc.), converts the tiny mechanical vibration signal into a voltage signal and transmits it to the acoustic emission data acquisition and analysis module (acquisition module). The acquisition module performs signal processing edge computing, and then sends the valid data to the cloud platform for further cloud computing processing through various networking communications, and outputs alarms or reports directly to the client mobile phone, or logs in to the cloud platform on the computer to view current/historical data. Compared with the classic acoustic emission instrument, the IoT acoustic emission equipment system has the following characteristics: A. The IoT acoustic emission equipment is an embedded Linux system, while the classic acoustic emission instrument is a Windows system. The former has the characteristics of long-term stable automatic operation and low cost and small size, while the latter relies on computers and cannot guarantee long-term stable automatic operation and has a large size and high cost. B. The IoT acoustic emission system can realize online, remote, and unattended acoustic emission monitoring and detection, while the classic acoustic emission instrument cannot do these points. It requires technicians to operate the instrument on site and give results after detection and analysis. C. The IoT acoustic emission system is a software that automatically analyzes and automatically gives results according to standards, while the classic acoustic emission instrument relies on technicians to rate. 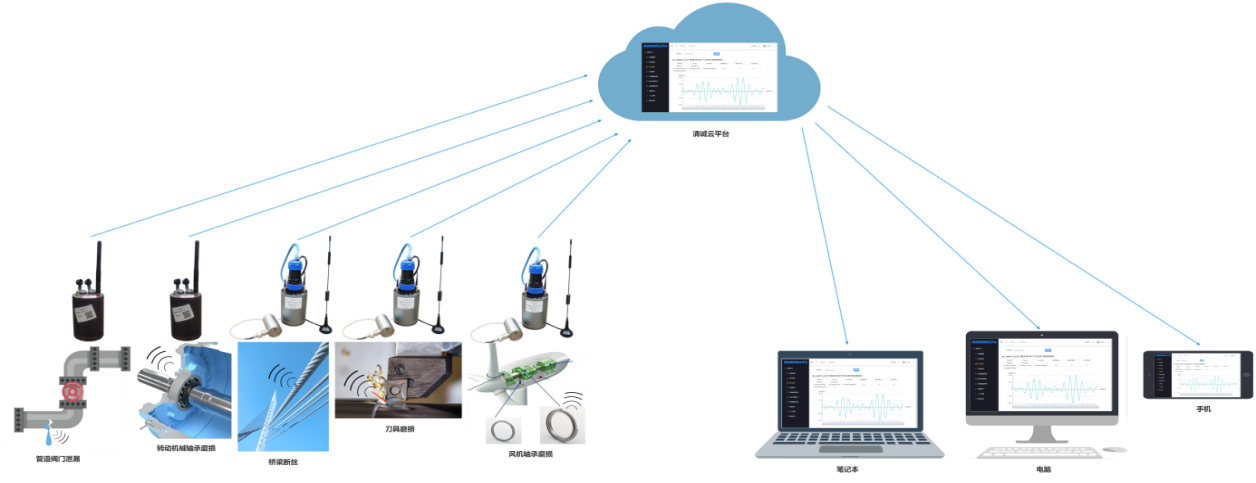 Figure 1 - RAEM system and application overview 2 Current status and key technical points of the Internet of Things acoustic wave (acoustic emission) monitoring and diagnosis system 2.1 RAEM series intelligent acoustic emission acquisition system The RAEM module is an intelligent single-channel acoustic emission collector that integrates signal acquisition, signal analysis, and communication data output. After the collected signal is digitized by AD, the signal is subjected to frequency domain filtering, waveform processing, acoustic emission impact characteristic parameter extraction, and impact parameter evaluation and rating. The data is transmitted to the Internet of Things platform through the communication module built into the small cylinder, such as 4G, WiFi, network cable, etc. 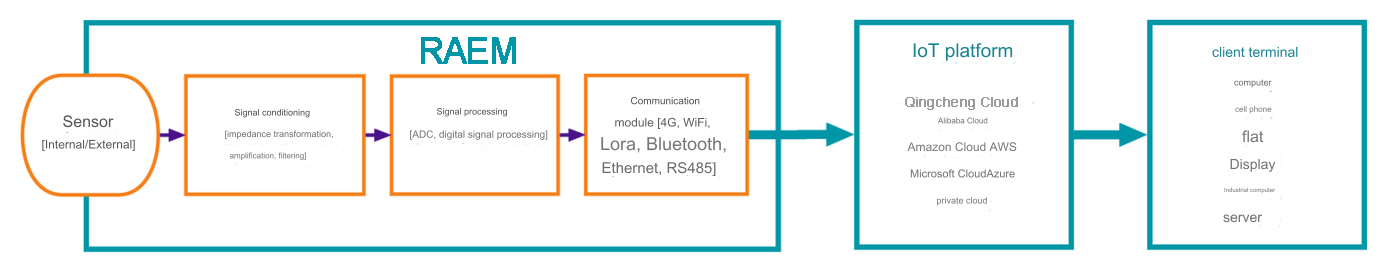 Figure 2 - RAEM system flow chart The following are several intelligent acoustic emission collectors that have been developed and their introduction: Technical indicators RAEM1 RAEM2 RAEM1-6 Graphics Number of channels Single channel or multi-channel networking Single Channel 2 to 36 channels or more Sampling method Threshold or time trigger Time trigger Threshold or time trigger Sampling rate/sampling accuracy 2M/16bit Input frequency 10kHz-1000kHz 10kHz-400kHz 10kHz-1000kHz Protection level IP62 IP62 / System noise Better than 30dB Better than 30dB Better than 30dB Dynamic Range 70dB 70dB 70dB powered by 12VDC or battery powered Built-in 3000mAh rechargeable lithium battery 12VDC Operating temperature -20℃ to 60℃ -15℃ to 60℃ -20℃ to 60℃ sensor Built-in preamplifier sensor optional: 28V40dB, 12V34dB, 5V26dB Built-in sensor, 28V40dB Built-in preamplifier sensor optional: 28V40dB, 12V34dB, 5V26dB AE characteristic parameters Amplitude, Energy, RMS, ASL, Ring Count, Rise Time, Duration Amplitude, Energy, RMS, ASL Amplitude, Energy, RMS, ASL, Ring Count, Rise Time, Duration Waveform have have have Communication method (others can be customized) 4G, Ethernet, WiFi, RS485 4G, Bluetooth 4G, Ethernet, WiFi, RS485 Clock synchronization Single channel: no synchronization clock Multi-channel GPS wireless synchronization clock accuracy: better than 1uS Multi-channel WiFi wireless synchronization clock accuracy: better than 10uS Single channel without synchronous clock Wired synchronous clock: better than 10uS The Qingcheng big data platform expression, mobile phone alarm push, and smart phone patrol interface are as follows: 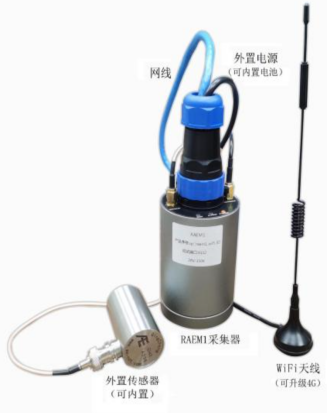 Figure 3 - Big Data Cloud Platform Figure 4 - Mobile phone alarm Figure 5 - Mobile phone inspection 2.2 System automatic calibration mechanism As a long-term monitoring product, the calibration of the acoustic emission system cannot rely on people going to the site to give standard signals such as lead breaking like traditional acoustic emission instruments, because this method is very unfriendly, especially in some field scenes, it is very troublesome for people to go to the site, which is very time-consuming and labor-intensive. Therefore, the system automatic calibration mechanism, namely sensor automatic calibration, is developed, which refers to a technology that emits pulse mechanical signals under voltage excitation by sensors and receives them through adjacent sensors to evaluate the sensitivity and coupling of the received sensors. RAEM can be configured with sensor automatic calibration (AST) function, with two sensors, one transmitting sensor and one collecting sensor. The transmitting unit circuit board outputs a low-level pulse control IO signal through an external controller, and controls the switch circuit to output a pulse voltage signal to the transmitting unit piezoelectric element. The transmitting unit piezoelectric element will output a weak mechanical vibration signal accordingly due to the reverse effect of the piezoelectric effect; the mechanical vibration signal is transmitted to the collecting unit piezoelectric element through the surface of the object to be measured, and is converted into an electrical signal due to the piezoelectric effect, and then collected by the collecting unit circuit board. The received signal strength and energy are used to judge whether the receiving end sensor is well coupled and whether the system is normal. The whole process is completed automatically by the system or by remote operation, which is very effective for automatic calibration of long-term monitoring systems. Its structure and transmitting circuit are shown in the figure below: Figure 6 - AST system automatic calibration structure diagram Figure 7 - Transmitter circuit schematic 2.3 Automatic acoustic emission data classification algorithm (automatic rating) Traditional acoustic emission testing relies on professional acoustic emission technicians to deeply analyze the acoustic emission data in order to evaluate and rate the test object. This method is not only time-consuming and labor-intensive, but also has many application industries, large differences, and non-universal technical standards. As a result, acoustic emission monitoring technology can only be used in some research fields and is difficult to popularize in industrial applications. In addition, in the engineering application site of mechanical equipment status monitoring and fault diagnosis, it is often not only acoustic emission technology, but also other methods such as vibration, stress, strain and temperature. Compared with other technologies, the amount of acoustic emission data is often relatively large, especially when the threshold is set relatively low and the number of channels is relatively large. The large amount of data will cause a relatively large burden on the server. Therefore, an automatic monitoring and alarm method based on acoustic emission data classification is proposed, including: obtaining the acoustic emission data of the monitored object within the sampling time period; determining the type of acoustic emission parameter data participating in the rating according to the industry to which the application scenario of the monitored object belongs; and dividing the intervals within the selected parameter value range according to the national standard or industry standard for the type of selected acoustic emission parameter data, setting different statistical intensity levels, different statistical activity levels and comprehensive level criteria, and making corresponding alarm level responses according to the signals collected by the sensor in real time; finally, the alarm level of the monitored object is pushed through the communication network to realize unattended monitoring alarm, and the user determines the performance or status of the monitored object according to the alarm level. Automatically converting complex acoustic emission data into easy-to-understand alarm levels and lowering the technical requirements for users are of great significance to the large-scale application of acoustic emission technology in industry. In addition, through the embedded chip hardware and software implementation of the intelligent collector, noise data can be effectively reduced, data communication pressure can be reduced, and the speed of alarm judgment can be improved. The data flow chart of its automatic monitoring and alarm method is shown in the figure below: Figure 8 - Data flow chart of automatic acoustic emission data classification algorithm 2.4 High-precision wireless/wired synchronous clock As we all know, the premise of time difference positioning is the high-precision clock synchronization within the channel array. Classic acoustic emission instruments often use inter-board communication to achieve clock synchronization, that is, by using an extremely high-precision on-board high-speed bus to control the synchronous acquisition of multiple channels, so as to achieve clock synchronization. Its synchronization accuracy is very high and can reach the level of hundreds of nanoseconds, but the equipment is complex, large in size, high in cost, and has limited integrated channels. Although the method of using the 485 industrial bus for wired time synchronization has the advantages of high accuracy, stable connection and high robustness, it is inadequate in the application of large-scale acoustic emission wireless device clusters arranged in an array due to the lack of flexibility and convenience. It is particularly important to choose a wireless and high-precision synchronous clock method. Therefore, after repeated comparisons and experiments, the two mainstream wireless time synchronization methods based on GPS and Wifi with long controllable distance, stability and reliability were determined. GPS wireless synchronization adopts multi-mode satellite navigation synchronization, which is timed by satellite and supports satellite positioning systems such as Beidou III/GPS/GLONASS. The accuracy of wireless synchronization clock is better than ±1us, which is suitable for various occasions of wireless time difference positioning, but the premise is that satellite signals can be received. WIFI wireless synchronization realizes synchronization networking function through star network technology (1 host and the rest are routing nodes), and the accuracy of wireless synchronization clock is better than ±10us. It is suitable for closed plants such as dam plants, tunnel projects, nuclear power plants, etc. where satellite signals cannot be received, and can only be synchronized by time synchronization servers. In the field of monitoring, for convenience and safety considerations, some systems have to adopt wireless communication, especially for mobile inspection and monitoring systems, which can only achieve time synchronization and second pulse synchronization by wireless means. Figure 9 - Distributed wireless acoustic emission system based on Wifi high-precision wireless synchronous clock 3 Application schemes and practical application cases of Internet of Things acoustic wave (acoustic emission) monitoring and diagnosis equipment and online monitoring and fault diagnosis of structures and equipment 3.1 Monitoring of broken wire ropes in bridges Suspension bridge slings, main cables, cable-stayed bridges, and arch bridge suspenders (cables) tie rods are made of several strands of steel wire. During long-term use, they are affected by excessive loads, environmental corrosion, stress corrosion, corrosion fatigue, hydrogen embrittlement, etc., and local wire breakage is prone to occur. At the moment of wire breakage, a strong elastic wave signal is generated and propagates along the wire rope. It is detected by the acoustic emission sensor placed within a certain distance and converted into an electrical signal and transmitted to the acoustic emission collector. The acoustic emission collector processes the signal, identifies the broken wire, uploads the broken wire warning to the cloud platform and then pushes it to the mobile phone, so as to achieve the purpose of real-time monitoring of broken wires. Wire breakage is a random event that may occur at any time. Therefore, continuous and long-term monitoring of wire breakage monitoring of bridges is required. No time without data collection is allowed, and frequent power outages and crashes that require someone to recover are not allowed. RAEM1 can realize 24 hours a day, 365 days a year uninterrupted waiting for triggering collection in the wire rope broken wire system of the bridge. It adopts Linux software and hardware architecture, watchdog circuit and other designs to adapt to long-term unattended monitoring. At the invitation of the user unit, Qingcheng Company's RAEM1 system conducted an acoustic emission monitoring test on the broken wire of a full-size bridge cable of a certain bridge, and accumulated a large amount of data. The experimental results show that the acoustic emission signal of the broken wire has high amplitude, high energy, high ringing count, high RMS, and obvious characteristics, which can be distinguished from most noise signals. The RAEM1 Internet of Things Acoustic Emission Monitoring System can accurately and effectively monitor the broken wire phenomenon. The experimental data of the broken wire has a 100% accuracy rate without missing or false alarms. RAEM1 can remotely and automatically monitor the broken wire without missing a single broken wire phenomenon, and can automatically push the broken wire and the broken wire rate to mobile phones and emails. Figure 10 - Broken wire signal displayed in real time on the cloud platform (left) and broken wire alarm email (right) Currently, the RAEM1 acoustic wave (acoustic emission) detection system has been installed on several bridges: Figure 11 - Installation diagram of RAEM1 system on a bridge 3.2 Pipeline valve leakage monitoring When gas or liquid leaks from a leak under a certain pressure, continuous mechanical waves will be stimulated at the leak. The acoustic emission waveform stimulated by the leak is observed through an oscilloscope, and its shape is a continuous fluctuation with very small amplitude fluctuations and almost no regularity. The frequency band distribution of the leakage acoustic emission wave can range from a few Hz to hundreds of kHz depending on the size of the leak, the leakage speed, and the leakage medium. Qingcheng's RAEM1 system uses suitable acoustic emission sensors to receive these acoustic emission waves from the leak site, and then converts the mechanical waves into electrical signals and amplifies them and transmits them to the acoustic emission host. After analysis and processing, the information on the size of the leakage can be obtained, and the appropriate threshold can be set to output an alarm when the threshold is reached. The leakage amount or alarm parameters are transmitted to the Internet cloud platform through the Internet of Things communication, and then pushed to the terminal user administrator to achieve the purpose of unattended quantitative leakage monitoring intelligent alarm. Under the same medium and material size, there is a certain functional quantitative relationship between different leakage amounts and acoustic emission parameters (RMS, ASL, energy, etc.) under the same pressure difference conditions; there is a quantitative relationship between different pressure differences and acoustic emission parameters and leakage amounts under the same valve opening conditions; and there is a characteristic relationship between different leakage openings and acoustic emission parameters under the same pressure difference conditions (tank wall plug). Figure 12 - Smart acoustic emission sensor layout Figure 13 - Qingcheng IoT platform monitoring leakage and leakage rate 3.3 Pressure vessel structural crack monitoring When pressure vessel equipment is in long-term operation, the defects inherent in it or generated during operation expand as the loading progresses, resulting in energy release in the local structure, part of which is emitted in the form of elastic waves. The RAEM system can regularly collect acoustic emission signals during equipment operation, and through trend experience diagrams and feature analysis calculated from data, it can invert the active changes of equipment defects, inform equipment management personnel in the form of alarm results, and pay attention to and process the location of the abnormal signal. The regional positioning method is used to determine the dynamic changes of hazardous defects such as active defect expansion and medium leakage that may exist in the operating state of the container, and conduct all-weather monitoring of the dynamic changes in the operating state process under abnormal acoustic emission data. Figure 14 - Schematic diagram of RAEM1 system monitoring pressure vessel cracks Figure 15 - RAEM1 system monitoring pressure vessel case diagram and site map 3.4 Online tank bottom corrosion monitoring Online (non-stop operation) tank bottom corrosion monitoring uses the RAEM system, which has a built-in independent storage acoustic emission real-time collector and does not rely on a user-operated computer. The collector automatically collects, stores, and analyzes the data, and pushes the evaluation results (the evaluation results are in accordance with the National Standard of the People's Republic of China GB/T18182-2012 Acoustic Emission Detection and Result Evaluation Method for Metal Pressure Vessels) to the user's mobile phone or PC through the communication module of the third-party cloud platform, so as to achieve timely warning and timely processing to complete the monitoring of the corrosion status of the tank bottom. Figure 16 - Schematic diagram of RAEM1 used for tank bottom corrosion monitoring Automatic comprehensive assessment of corrosion classification: automatic signal processing and analysis of data can be performed according to the testing requirements of standard JB/T10764-2007 "Non-destructive testing of atmospheric pressure metal storage tanks - Acoustic emission testing and evaluation methods". Figure 17 - Activity time diagram for RAEM1 tank bottom corrosion monitoring 3.5 Damage status monitoring of rotating mechanical equipment RAEM online monitoring can be used to monitor the wear, damage, and lubrication status of various rotating mechanical equipment such as wind power bearings and amusement facilities. The RAEM system was first used on a wind turbine of a wind power company to monitor the operating status of the bearings in the chassis. The sensor is installed on the inner shaft wall of the bearing to continuously collect the acoustic emission signals generated by the wind turbine in operation. The collector will upload the collected signal data to the server or cloud server via the 4G network. Then use Qingcheng's analysis software to display and analyze the operating status of the bearing, and even calculate the cycle speed of the wind turbine. Figure 18 - Schematic diagram of RAEM installed in wind turbine bearing monitoring Figure 19 - Photo of RAEM installed at the wind turbine bearing monitoring site Figure 20 - RAEM data view and cycle calculation in the analysis software 3.6 Tool wear and other machining process monitoring The highly sensitive sensor receives the sound (acoustic emission signal) generated by the friction and collision between the tool and the workpiece during machining processes such as cutting, milling, grinding, and punching, and analyzes the acoustic emission signal to obtain the corresponding tool status (degree of wear, whether the tool grinding wheel contacts the workpiece, punch damage, etc.). Usually, the acoustic emission signal of the tool status during normal machining is small, while the acoustic emission signal of the abnormal machining process where the tool is worn or damaged is large. The ringing count and rise count of a good tool are usually much larger than those of a bad tool, and the frequency characteristics will also be different. The RAEM1 acoustic emission acquisition system receives and processes wide-band 2KHz-1MHz signals. The high sensitivity and powerful noise-removing signal processing capabilities make the acoustic emission tool status detection sensitivity much higher than methods such as human ears and vibration. The results of long-term continuous monitoring and automatic alarm output can be achieved online, remote unmanned by the Internet of Things, and other methods to meet the intelligent machining needs of the application. Replace the tool in time according to the tool status to extend the tool life, reduce tool costs, avoid quality accidents, and reduce the rate of unqualified products. Figure 21 - Tool wear monitoring case diagram 4 Conclusion and Outlook RAEM Internet of Things acoustic wave (acoustic emission) online monitoring system has been applied in some fields, such as bridge suspension cable wire breakage monitoring, valve pipeline leakage monitoring, pressure vessel crack monitoring, container tank bottom corrosion monitoring, and rotating machinery status monitoring. Compared with traditional acoustic emission instruments, the Internet of Things acoustic emission equipment system has the advantages of free and flexible installation, wireless data transmission, real-time cloud data display, wireless synchronization clock to locate the sound source, no need for professional personnel to analyze the results, and automatic result rating and reporting. The cloud server can access a large number of monitoring points and long-term monitoring to form acoustic emission monitoring and detection big data. The application of big data and artificial intelligence AI technology big data models can greatly improve the accuracy and ability of acoustic emission monitoring and detection. It can also form a dedicated ChatGPT for acoustic emission detection, which greatly facilitates the application. References [1] Ministry of Transport of the People’s Republic of China. “JT/T 1037-2022 Technical Specification for Highway Bridge Structure Inspection”. 2022 [2] Xie, J., Wang, S., Liu, W., Yang, H., Zhang, L., Liu, S. (2021). “Internet of Things Acoustic Emission: Systems and Applications”. In: Shen, G., Zhang, J., Wu, Z. (eds) Advances in Acoustic Emission Technology. Springer Proceedings in Physics, vol 259. Springer, Singapore. 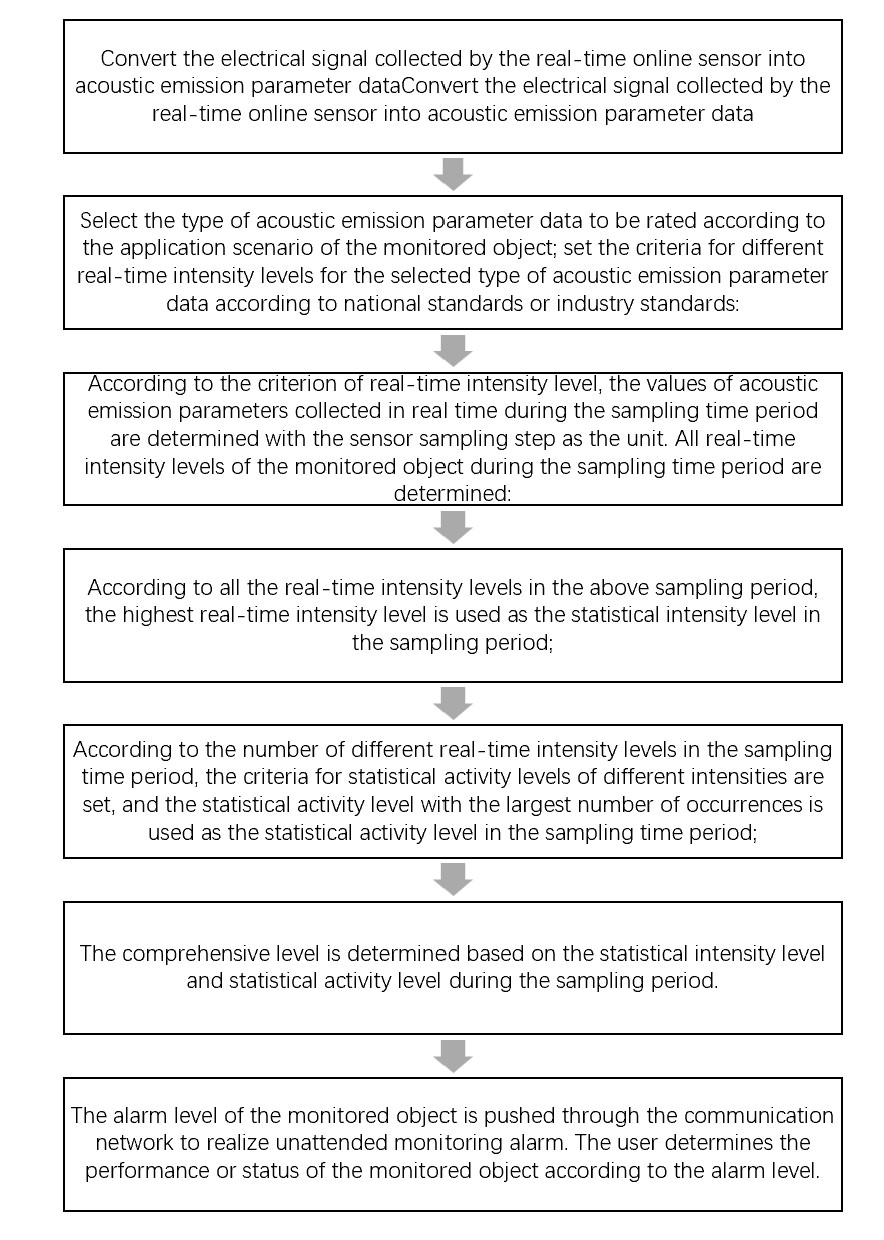 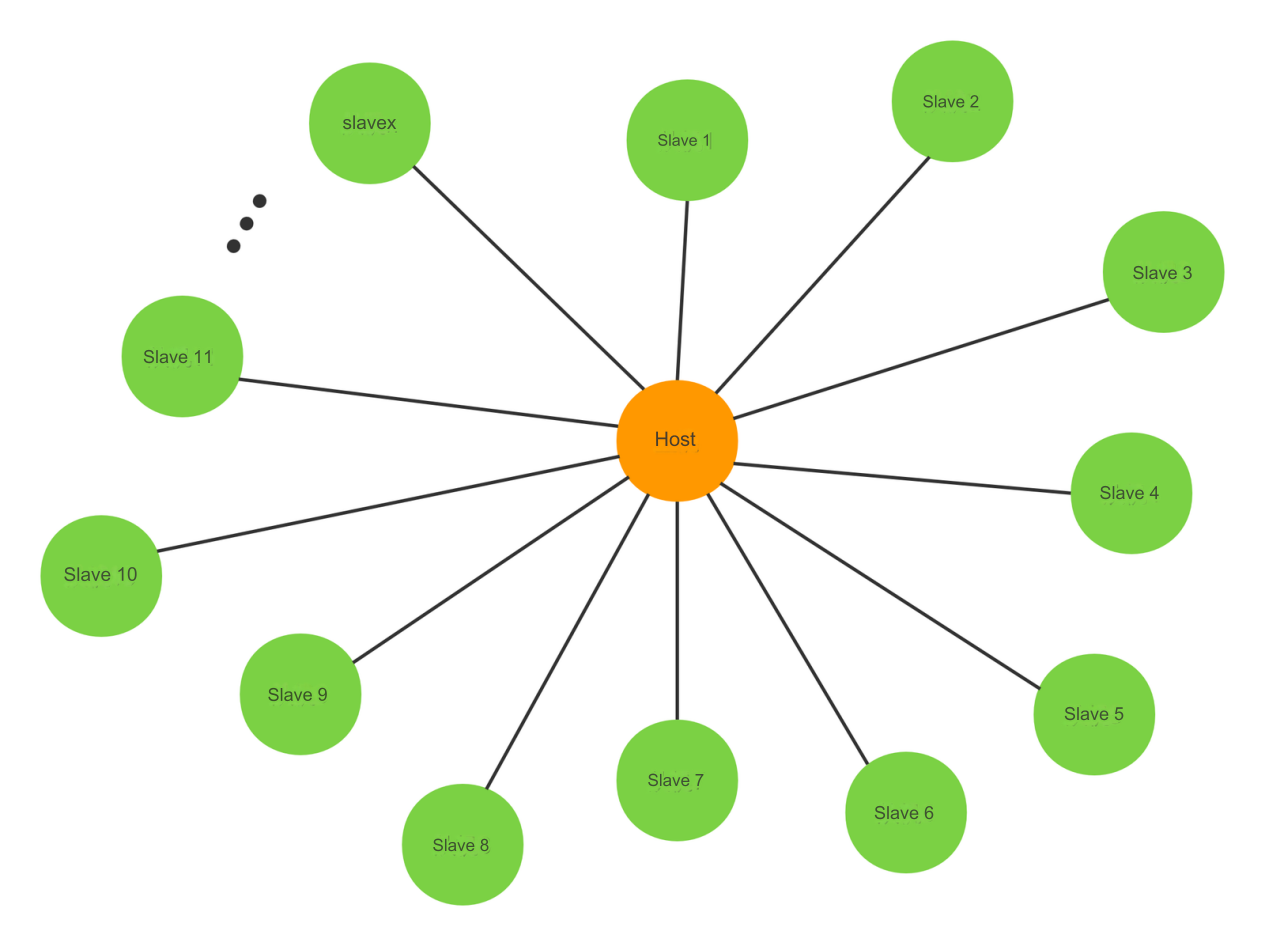 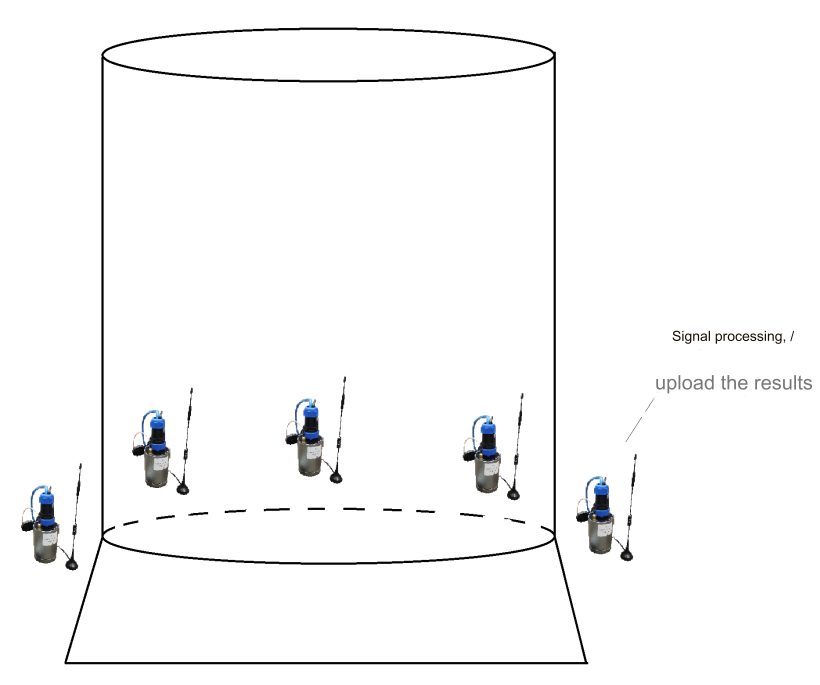 |
| json metadata | {"tags":["ndt"],"image":["https://cdn.steemitimages.com/DQmd3zbxinirH9BhTXWuiQHrwsYGJSEVSmTMwH61ADbgzyh/bigdata-online-condition-monitoring1.png","https://cdn.steemitimages.com/DQmYftSYmnkduAJknoau3f98n1XmePVxAdczL6oD6FVkdp9/bigdata-online-condition-monitoring2-2.png","https://cdn.steemitimages.com/DQmVUVjmRX5Bbt53dMxuyKBi3SYsEPx9NvSTc9qdHuxozBY/bigdata-online-condition-monitoring3.png","https://cdn.steemitimages.com/DQmT8Eoxu1a7NEwyWic2UMJmqZTvVdvQpByzBY7NnSJ8K9e/bigdata-online-condition-monitoring11.jpg","https://cdn.steemitimages.com/DQmaFqE9ogR7ERUrxPGV97wPGPmAwfzwxGbGkp73VsWdpPr/bigdata-online-condition-monitoring12-2.png","https://cdn.steemitimages.com/DQmQhqooDC7s6TJtsvgDv3pFKBauHRQQ2xfTnQ7PXQp3Ect/bigdata-online-condition-monitoring22-2.png"],"app":"steemit/0.2","format":"markdown"} |
| parent author | |
| parent permlink | ndt |
| permlink | intelligent-acoustic-emission-online-monitoring-and-fault-diagnosis-system-based-on-internet-of-things-and-big-data |
| title | Intelligent acoustic emission online monitoring and fault diagnosis system based on Internet of Things and big data |
| Transaction Info | Block #87803529/Trx d877c0e236e93d8feb3a53c9553cb895557746f4 |
View Raw JSON Data
{
"block": 87803529,
"op": [
"comment",
{
"author": "barrylee",
"body": "Intelligent acoustic emission online monitoring and fault diagnosis system based on Internet of Things and big data\n2024-08-17 16:05\n\nXie Jiehui, Liu Yating, Liu Shifeng\nQingCheng AE institute (Guangzhou) Co., Ltd\n \nAbstract: Online (non-stop operation) tank bottom corrosion monitoring, crack monitoring of pressure vessels and other structures, pipeline valve leakage monitoring, bridge wire rope broken wire monitoring, wind turbine blade crack monitoring, wind turbine bearing amusement facilities, wear/damage/lubrication status monitoring of various rotating mechanical equipment, tool wear and other machining process monitoring, and other online monitoring and fault diagnosis of various structures and equipment are hot topics in industry, national defense, and national economy, and are also technologies with great demand. With the rapid development of the Internet of Things, the Internet of Things acoustic wave (acoustic emission) monitoring and diagnosis technology that has emerged is a new technology for online monitoring and fault diagnosis of the above structures and equipment, and has been successfully applied in large numbers, demonstrating a strong prospect for wide application. This article reports and introduces the principles of the Internet of Things acoustic wave (acoustic emission) technology, the Internet of Things acoustic wave (acoustic emission) monitoring and diagnosis equipment, and the application solutions and practical application cases of online monitoring and fault diagnosis of structures and equipment.\n\nKeywords: sound wave; acoustic emission; online monitoring; Internet of Things; structure and equipment case;\n1 Principle of Internet of Things Acoustic Wave (Acoustic Emission) Technology\nThe Internet of Things Acoustic Wave (Acoustic Emission) system consists of an intelligent acoustic emission collector (sensor, preamplifier, embedded data acquisition, embedded analysis software, communication), cloud platform, and client. First, the acoustic emission sensor collects the acoustic emission signal from the monitored object (tank bottom plate, pressure vessel, pipeline valve, bridge wire rope, wind turbine blade, rotating machinery, tool machine, etc.), converts the tiny mechanical vibration signal into a voltage signal and transmits it to the acoustic emission data acquisition and analysis module (acquisition module). The acquisition module performs signal processing edge computing, and then sends the valid data to the cloud platform for further cloud computing processing through various networking communications, and outputs alarms or reports directly to the client mobile phone, or logs in to the cloud platform on the computer to view current/historical data.\nCompared with the classic acoustic emission instrument, the IoT acoustic emission equipment system has the following characteristics:\nA. The IoT acoustic emission equipment is an embedded Linux system, while the classic acoustic emission instrument is a Windows system. The former has the characteristics of long-term stable automatic operation and low cost and small size, while the latter relies on computers and cannot guarantee long-term stable automatic operation and has a large size and high cost.\nB. The IoT acoustic emission system can realize online, remote, and unattended acoustic emission monitoring and detection, while the classic acoustic emission instrument cannot do these points. It requires technicians to operate the instrument on site and give results after detection and analysis.\nC. The IoT acoustic emission system is a software that automatically analyzes and automatically gives results according to standards, while the classic acoustic emission instrument relies on technicians to rate.\n\n\n\n\nFigure 1 - RAEM system and application overview\n2 Current status and key technical points of the Internet of Things acoustic wave (acoustic emission) monitoring and diagnosis system\n2.1 RAEM series intelligent acoustic emission acquisition system\n The RAEM module is an intelligent single-channel acoustic emission collector that integrates signal acquisition, signal analysis, and communication data output. After the collected signal is digitized by AD, the signal is subjected to frequency domain filtering, waveform processing, acoustic emission impact characteristic parameter extraction, and impact parameter evaluation and rating. The data is transmitted to the Internet of Things platform through the communication module built into the small cylinder, such as 4G, WiFi, network cable, etc.\n\n\n\nFigure 2 - RAEM system flow chart\n \nThe following are several intelligent acoustic emission collectors that have been developed and their introduction:\nTechnical indicators\tRAEM1\tRAEM2\tRAEM1-6\nGraphics\t \t\t\nNumber of channels\tSingle channel or multi-channel networking\tSingle Channel\t2 to 36 channels or more\nSampling method\tThreshold or time trigger\tTime trigger\tThreshold or time trigger\nSampling rate/sampling accuracy\t2M/16bit\nInput frequency\t10kHz-1000kHz\t10kHz-400kHz\t10kHz-1000kHz\nProtection level\tIP62\tIP62\t/\nSystem noise\tBetter than 30dB\tBetter than 30dB\tBetter than 30dB\nDynamic Range\t70dB\t70dB\t70dB\npowered by\t12VDC\nor battery powered\tBuilt-in 3000mAh rechargeable lithium battery\t12VDC\nOperating temperature\t-20℃ to 60℃\t-15℃ to 60℃\t-20℃ to 60℃\nsensor\tBuilt-in preamplifier sensor optional: 28V40dB, 12V34dB, 5V26dB\tBuilt-in sensor, 28V40dB\tBuilt-in preamplifier sensor optional: 28V40dB, 12V34dB, 5V26dB\nAE characteristic parameters\tAmplitude, Energy, RMS, ASL, Ring Count, Rise Time, Duration\tAmplitude, Energy, RMS, ASL\tAmplitude, Energy, RMS, ASL, Ring Count, Rise Time, Duration\nWaveform\thave\thave\thave\nCommunication method (others can be customized)\t4G, Ethernet, WiFi, RS485\t4G, Bluetooth\t4G, Ethernet, WiFi, RS485\nClock synchronization\tSingle channel: no synchronization clock\nMulti-channel GPS wireless synchronization clock accuracy: better than 1uS\nMulti-channel WiFi wireless synchronization clock accuracy: better than 10uS\tSingle channel without synchronous clock\tWired synchronous clock: better than 10uS\n \n \nThe Qingcheng big data platform expression, mobile phone alarm push, and smart phone patrol interface are as follows:\n\t\t \n\n\nFigure 3 - Big Data Cloud Platform\tFigure 4 - Mobile phone alarm\tFigure 5 - Mobile phone inspection \n2.2 System automatic calibration mechanism\nAs a long-term monitoring product, the calibration of the acoustic emission system cannot rely on people going to the site to give standard signals such as lead breaking like traditional acoustic emission instruments, because this method is very unfriendly, especially in some field scenes, it is very troublesome for people to go to the site, which is very time-consuming and labor-intensive.\nTherefore, the system automatic calibration mechanism, namely sensor automatic calibration, is developed, which refers to a technology that emits pulse mechanical signals under voltage excitation by sensors and receives them through adjacent sensors to evaluate the sensitivity and coupling of the received sensors. RAEM can be configured with sensor automatic calibration (AST) function, with two sensors, one transmitting sensor and one collecting sensor. The transmitting unit circuit board outputs a low-level pulse control IO signal through an external controller, and controls the switch circuit to output a pulse voltage signal to the transmitting unit piezoelectric element. The transmitting unit piezoelectric element will output a weak mechanical vibration signal accordingly due to the reverse effect of the piezoelectric effect; the mechanical vibration signal is transmitted to the collecting unit piezoelectric element through the surface of the object to be measured, and is converted into an electrical signal due to the piezoelectric effect, and then collected by the collecting unit circuit board. The received signal strength and energy are used to judge whether the receiving end sensor is well coupled and whether the system is normal. The whole process is completed automatically by the system or by remote operation, which is very effective for automatic calibration of long-term monitoring systems. Its structure and transmitting circuit are shown in the figure below:\n \n\t\nFigure 6 - AST system automatic calibration structure diagram\tFigure 7 - Transmitter circuit schematic \n2.3 Automatic acoustic emission data classification algorithm (automatic rating)\n\nTraditional acoustic emission testing relies on professional acoustic emission technicians to deeply analyze the acoustic emission data in order to evaluate and rate the test object. This method is not only time-consuming and labor-intensive, but also has many application industries, large differences, and non-universal technical standards. As a result, acoustic emission monitoring technology can only be used in some research fields and is difficult to popularize in industrial applications. In addition, in the engineering application site of mechanical equipment status monitoring and fault diagnosis, it is often not only acoustic emission technology, but also other methods such as vibration, stress, strain and temperature. Compared with other technologies, the amount of acoustic emission data is often relatively large, especially when the threshold is set relatively low and the number of channels is relatively large. The large amount of data will cause a relatively large burden on the server.\nTherefore, an automatic monitoring and alarm method based on acoustic emission data classification is proposed, including: obtaining the acoustic emission data of the monitored object within the sampling time period; determining the type of acoustic emission parameter data participating in the rating according to the industry to which the application scenario of the monitored object belongs; and dividing the intervals within the selected parameter value range according to the national standard or industry standard for the type of selected acoustic emission parameter data, setting different statistical intensity levels, different statistical activity levels and comprehensive level criteria, and making corresponding alarm level responses according to the signals collected by the sensor in real time; finally, the alarm level of the monitored object is pushed through the communication network to realize unattended monitoring alarm, and the user determines the performance or status of the monitored object according to the alarm level. Automatically converting complex acoustic emission data into easy-to-understand alarm levels and lowering the technical requirements for users are of great significance to the large-scale application of acoustic emission technology in industry. In addition, through the embedded chip hardware and software implementation of the intelligent collector, noise data can be effectively reduced, data communication pressure can be reduced, and the speed of alarm judgment can be improved. The\ndata flow chart of its automatic monitoring and alarm method is shown in the figure below:\n \n\n \n \nFigure 8 - Data flow chart of automatic acoustic emission data classification algorithm\n \n2.4 High-precision wireless/wired synchronous clock\n As we all know, the premise of time difference positioning is the high-precision clock synchronization within the channel array. Classic acoustic emission instruments often use inter-board communication to achieve clock synchronization, that is, by using an extremely high-precision on-board high-speed bus to control the synchronous acquisition of multiple channels, so as to achieve clock synchronization. Its synchronization accuracy is very high and can reach the level of hundreds of nanoseconds, but the equipment is complex, large in size, high in cost, and has limited integrated channels. Although the method of using the 485 industrial bus for wired time synchronization has the advantages of high accuracy, stable connection and high robustness, it is inadequate in the application of large-scale acoustic emission wireless device clusters arranged in an array due to the lack of flexibility and convenience. It is particularly important to choose a wireless and high-precision synchronous clock method.\n Therefore, after repeated comparisons and experiments, the two mainstream wireless time synchronization methods based on GPS and Wifi with long controllable distance, stability and reliability were determined. GPS wireless synchronization adopts multi-mode satellite navigation synchronization, which is timed by satellite and supports satellite positioning systems such as Beidou III/GPS/GLONASS. The accuracy of wireless synchronization clock is better than ±1us, which is suitable for various occasions of wireless time difference positioning, but the premise is that satellite signals can be received. WIFI wireless synchronization realizes synchronization networking function through star network technology (1 host and the rest are routing nodes), and the accuracy of wireless synchronization clock is better than ±10us. It is suitable for closed plants such as dam plants, tunnel projects, nuclear power plants, etc. where satellite signals cannot be received, and can only be synchronized by time synchronization servers. In the field of monitoring, for convenience and safety considerations, some systems have to adopt wireless communication, especially for mobile inspection and monitoring systems, which can only achieve time synchronization and second pulse synchronization by wireless means.\n\n \nFigure 9 - Distributed wireless acoustic emission system based on Wifi high-precision wireless synchronous clock\n \n \n3 Application schemes and practical application cases of Internet of Things acoustic wave (acoustic emission) monitoring and diagnosis equipment and online monitoring and fault diagnosis of structures and equipment\n3.1 Monitoring of broken wire ropes in bridges\n Suspension bridge slings, main cables, cable-stayed bridges, and arch bridge suspenders (cables) tie rods are made of several strands of steel wire. During long-term use, they are affected by excessive loads, environmental corrosion, stress corrosion, corrosion fatigue, hydrogen embrittlement, etc., and local wire breakage is prone to occur. At the moment of wire breakage, a strong elastic wave signal is generated and propagates along the wire rope. It is detected by the acoustic emission sensor placed within a certain distance and converted into an electrical signal and transmitted to the acoustic emission collector. The acoustic emission collector processes the signal, identifies the broken wire, uploads the broken wire warning to the cloud platform and then pushes it to the mobile phone, so as to achieve the purpose of real-time monitoring of broken wires.\n Wire breakage is a random event that may occur at any time. Therefore, continuous and long-term monitoring of wire breakage monitoring of bridges is required. No time without data collection is allowed, and frequent power outages and crashes that require someone to recover are not allowed. RAEM1 can realize 24 hours a day, 365 days a year uninterrupted waiting for triggering collection in the wire rope broken wire system of the bridge. It adopts Linux software and hardware architecture, watchdog circuit and other designs to adapt to long-term unattended monitoring.\n At the invitation of the user unit, Qingcheng Company's RAEM1 system conducted an acoustic emission monitoring test on the broken wire of a full-size bridge cable of a certain bridge, and accumulated a large amount of data. The experimental results show that the acoustic emission signal of the broken wire has high amplitude, high energy, high ringing count, high RMS, and obvious characteristics, which can be distinguished from most noise signals. The RAEM1 Internet of Things Acoustic Emission Monitoring System can accurately and effectively monitor the broken wire phenomenon. The experimental data of the broken wire has a 100% accuracy rate without missing or false alarms. RAEM1 can remotely and automatically monitor the broken wire without missing a single broken wire phenomenon, and can automatically push the broken wire and the broken wire rate to mobile phones and emails.\n\n\t\n \n \nFigure 10 - Broken wire signal displayed in real time on the cloud platform (left) and broken wire alarm email (right)\n\n \nCurrently, the RAEM1 acoustic wave (acoustic emission) detection system has been installed on several bridges:\n\n\t\nFigure 11 - Installation diagram of RAEM1 system on a bridge\n \n3.2 Pipeline valve leakage monitoring\n When gas or liquid leaks from a leak under a certain pressure, continuous mechanical waves will be stimulated at the leak. The acoustic emission waveform stimulated by the leak is observed through an oscilloscope, and its shape is a continuous fluctuation with very small amplitude fluctuations and almost no regularity. The frequency band distribution of the leakage acoustic emission wave can range from a few Hz to hundreds of kHz depending on the size of the leak, the leakage speed, and the leakage medium. Qingcheng's RAEM1 system uses suitable acoustic emission sensors to receive these acoustic emission waves from the leak site, and then converts the mechanical waves into electrical signals and amplifies them and transmits them to the acoustic emission host. After analysis and processing, the information on the size of the leakage can be obtained, and the appropriate threshold can be set to output an alarm when the threshold is reached. The leakage amount or alarm parameters are transmitted to the Internet cloud platform through the Internet of Things communication, and then pushed to the terminal user administrator to achieve the purpose of unattended quantitative leakage monitoring intelligent alarm.\n Under the same medium and material size, there is a certain functional quantitative relationship between different leakage amounts and acoustic emission parameters (RMS, ASL, energy, etc.) under the same pressure difference conditions; there is a quantitative relationship between different pressure differences and acoustic emission parameters and leakage amounts under the same valve opening conditions; and there is a characteristic relationship between different leakage openings and acoustic emission parameters under the same pressure difference conditions (tank wall plug).\n\t\nFigure 12 - Smart acoustic emission sensor layout\tFigure 13 - Qingcheng IoT platform monitoring leakage and leakage rate \n3.3 Pressure vessel structural crack monitoring\n When pressure vessel equipment is in long-term operation, the defects inherent in it or generated during operation expand as the loading progresses, resulting in energy release in the local structure, part of which is emitted in the form of elastic waves. The RAEM system can regularly collect acoustic emission signals during equipment operation, and through trend experience diagrams and feature analysis calculated from data, it can invert the active changes of equipment defects, inform equipment management personnel in the form of alarm results, and pay attention to and process the location of the abnormal signal. The regional positioning method is used to determine the dynamic changes of hazardous defects such as active defect expansion and medium leakage that may exist in the operating state of the container, and conduct all-weather monitoring of the dynamic changes in the operating state process under abnormal acoustic emission data.\nFigure 14 - Schematic diagram of RAEM1 system monitoring pressure vessel cracks\n \nFigure 15 - RAEM1 system monitoring pressure vessel case diagram and site map\n3.4 Online tank bottom corrosion monitoring\n Online (non-stop operation) tank bottom corrosion monitoring uses the RAEM system, which has a built-in independent storage acoustic emission real-time collector and does not rely on a user-operated computer. The collector automatically collects, stores, and analyzes the data, and pushes the evaluation results (the evaluation results are in accordance with the National Standard of the People's Republic of China GB/T18182-2012 Acoustic Emission Detection and Result Evaluation Method for Metal Pressure Vessels) to the user's mobile phone or PC through the communication module of the third-party cloud platform, so as to achieve timely warning and timely processing to complete the monitoring of the corrosion status of the tank bottom.\n \nFigure 16 - Schematic diagram of RAEM1 used for tank bottom corrosion monitoring\n \n Automatic comprehensive assessment of corrosion classification: automatic signal processing and analysis of data can be performed according to the testing requirements of standard JB/T10764-2007 \"Non-destructive testing of atmospheric pressure metal storage tanks - Acoustic emission testing and evaluation methods\".\n \nFigure 17 - Activity time diagram for RAEM1 tank bottom corrosion monitoring\n\n3.5 Damage status monitoring of rotating mechanical equipment\n RAEM online monitoring can be used to monitor the wear, damage, and lubrication status of various rotating mechanical equipment such as wind power bearings and amusement facilities. The RAEM system was first used on a wind turbine of a wind power company to monitor the operating status of the bearings in the chassis. The sensor is installed on the inner shaft wall of the bearing to continuously collect the acoustic emission signals generated by the wind turbine in operation. The collector will upload the collected signal data to the server or cloud server via the 4G network. Then use Qingcheng's analysis software to display and analyze the operating status of the bearing, and even calculate the cycle speed of the wind turbine.\n \nFigure 18 - Schematic diagram of RAEM installed in wind turbine bearing monitoring\n \nFigure 19 - Photo of RAEM installed at the wind turbine bearing monitoring site\n \nFigure 20 - RAEM data view and cycle calculation in the analysis software\n3.6 Tool wear and other machining process monitoring\n The highly sensitive sensor receives the sound (acoustic emission signal) generated by the friction and collision between the tool and the workpiece during machining processes such as cutting, milling, grinding, and punching, and analyzes the acoustic emission signal to obtain the corresponding tool status (degree of wear, whether the tool grinding wheel contacts the workpiece, punch damage, etc.). Usually, the acoustic emission signal of the tool status during normal machining is small, while the acoustic emission signal of the abnormal machining process where the tool is worn or damaged is large. The ringing count and rise count of a good tool are usually much larger than those of a bad tool, and the frequency characteristics will also be different. The RAEM1 acoustic emission acquisition system receives and processes wide-band 2KHz-1MHz signals. The high sensitivity and powerful noise-removing signal processing capabilities make the acoustic emission tool status detection sensitivity much higher than methods such as human ears and vibration. The results of long-term continuous monitoring and automatic alarm output can be achieved online, remote unmanned by the Internet of Things, and other methods to meet the intelligent machining needs of the application. Replace the tool in time according to the tool status to extend the tool life, reduce tool costs, avoid quality accidents, and reduce the rate of unqualified products. \nFigure 21 - Tool wear monitoring case diagram\n4 Conclusion and Outlook\nRAEM Internet of Things acoustic wave (acoustic emission) online monitoring system has been applied in some fields, such as bridge suspension cable wire breakage monitoring, valve pipeline leakage monitoring, pressure vessel crack monitoring, container tank bottom corrosion monitoring, and rotating machinery status monitoring. Compared with traditional acoustic emission instruments, the Internet of Things acoustic emission equipment system has the advantages of free and flexible installation, wireless data transmission, real-time cloud data display, wireless synchronization clock to locate the sound source, no need for professional personnel to analyze the results, and automatic result rating and reporting. The cloud server can access a large number of monitoring points and long-term monitoring to form acoustic emission monitoring and detection big data. The application of big data and artificial intelligence AI technology big data models can greatly improve the accuracy and ability of acoustic emission monitoring and detection. It can also form a dedicated ChatGPT for acoustic emission detection, which greatly facilitates the application.\n \n \n \nReferences\n[1] Ministry of Transport of the People’s Republic of China. “JT/T 1037-2022 Technical Specification for Highway Bridge Structure Inspection”. 2022\n[2] Xie, J., Wang, S., Liu, W., Yang, H., Zhang, L., Liu, S. (2021). “Internet of Things Acoustic Emission: Systems and Applications”. In: Shen, G., Zhang, J., Wu, Z. (eds) Advances in Acoustic Emission Technology. Springer Proceedings in Physics, vol 259. Springer, Singapore. \n\n\n\n\n",
"json_metadata": "{\"tags\":[\"ndt\"],\"image\":[\"https://cdn.steemitimages.com/DQmd3zbxinirH9BhTXWuiQHrwsYGJSEVSmTMwH61ADbgzyh/bigdata-online-condition-monitoring1.png\",\"https://cdn.steemitimages.com/DQmYftSYmnkduAJknoau3f98n1XmePVxAdczL6oD6FVkdp9/bigdata-online-condition-monitoring2-2.png\",\"https://cdn.steemitimages.com/DQmVUVjmRX5Bbt53dMxuyKBi3SYsEPx9NvSTc9qdHuxozBY/bigdata-online-condition-monitoring3.png\",\"https://cdn.steemitimages.com/DQmT8Eoxu1a7NEwyWic2UMJmqZTvVdvQpByzBY7NnSJ8K9e/bigdata-online-condition-monitoring11.jpg\",\"https://cdn.steemitimages.com/DQmaFqE9ogR7ERUrxPGV97wPGPmAwfzwxGbGkp73VsWdpPr/bigdata-online-condition-monitoring12-2.png\",\"https://cdn.steemitimages.com/DQmQhqooDC7s6TJtsvgDv3pFKBauHRQQ2xfTnQ7PXQp3Ect/bigdata-online-condition-monitoring22-2.png\"],\"app\":\"steemit/0.2\",\"format\":\"markdown\"}",
"parent_author": "",
"parent_permlink": "ndt",
"permlink": "intelligent-acoustic-emission-online-monitoring-and-fault-diagnosis-system-based-on-internet-of-things-and-big-data",
"title": "Intelligent acoustic emission online monitoring and fault diagnosis system based on Internet of Things and big data"
}
],
"op_in_trx": 0,
"timestamp": "2024-08-17T09:10:57",
"trx_id": "d877c0e236e93d8feb3a53c9553cb895557746f4",
"trx_in_block": 3,
"virtual_op": 0
}2024/08/16 10:23:48
2024/08/16 10:23:48
| author | barrylee |
| body | 引江济淮之 — — 合六叶桥梁箱梁焊缝声发射监测 2023年2月引江济淮之 — — 合六叶桥安装<a href="https://ae-ndt.com/plus/view.php?aid=609">RAEM1智能声发射监测设备</a>对桥梁箱梁内垂直于车道方向的焊缝进行在线监测。引江济淮工程是一项以城乡供水和发展江淮航运为主,结合灌溉补水和改善巢湖及淮河水生态环境为主要任务的大型跨流域调水工程。焊缝处理不当,易发生大载荷而骤然断裂事故。 ![1-230302103KKK[1].jpg](https://cdn.steemitimages.com/DQmeyFBpJ1SCguYL6wXswkfu3vxAa9abTPxrWMhhaKSk7Zb/1-230302103KKK[1].jpg) 合六叶桥 使用声发射智能监测设备能够365天在线实时监测检测,全过程自动分析结果,支持手机蓝牙巡检,物联网远程操作使用,手机报警推送。 引江济淮之 — — 铭传路桥梁断丝声发射监测 2023年2月引江济淮之 — — 铭传路桥安装<a href="https://ae-ndt.com/plus/view.php?aid=609">RAEM1智能声发射监测设备</a>对拱桥吊杆断丝进行在线监测,为桥梁安全保驾护航。引江济淮工程是一项以城乡供水和发展江淮航运为主,结合灌溉补水和改善巢湖及淮河水生态环境为主要任务的大型跨流域调水工程。 铭传路桥 声发射传感器安装分布图 声发射采集器的优势 特点过程·信号和时间触发 ·瞬态信号和连续信号采集 ·长期监测诊断 ·远程监测和无线单通道检测仪◆关键部位安装RAEM1,监测缆索断丝 ◆开启采集 ◆分析验证,得到判据标准 ◆验证效果良好,关闭波形和参数输出 ◆设置判据,手机平台推送信息 总结 实现了按标准(JT/T 1037–2022公路桥梁结构监测技术规范)对悬索桥吊索、主缆,斜拉桥斜拉索,拱桥吊杆(索)或系杆的桥梁缆索断丝声波(声发射)监测检测。 并按标准给出每一条缆索的断丝根数及断丝率(断丝根数占该条缆索总根数的百分比即为断丝率)。用户可根据标准内容及时开展检查维修、缆索更换。杜绝因损伤累积发展而导致的损失和事故。 引江济淮之 — — 清溪西路桥梁系杆断丝声发射监测 2023年2月引江济淮之 — — 清溪西路桥安装<a href="https://ae-ndt.com/plus/view.php?aid=609">RAEM1智能声发射监测设备</a>对桥梁系杆断丝进行在线声发射监测,为桥梁安全保驾护航。引江济淮工程是一项以城乡供水和发展江淮航运为主,结合灌溉补水和改善巢湖及淮河水生态环境为主要任务的大型跨流域调水工程。 清溪西路桥梁 声发射传感器安装是示意图 RAEM1声发射监测设备监测现场 RAEM1声发射监测设备可接入用户监控平台或云服务等数据平台实时显示数据,也可将参数评级结果等数据内容推送给手机APP,实现实时参数评级判据报警等实时手机数据内容提醒功能;可设置并输出出现断丝报警及设置断丝率报警:出现断丝二级报警,断丝率2%以上,三级报警; |
| json metadata | {"tags":["bridge"],"image":["https://cdn.steemitimages.com/DQmeyFBpJ1SCguYL6wXswkfu3vxAa9abTPxrWMhhaKSk7Zb/1-230302103KKK[1].jpg"],"links":["https://ae-ndt.com/plus/view.php?aid=609"],"app":"steemit/0.2","format":"markdown"} |
| parent author | |
| parent permlink | bridge |
| permlink | 2mgijf |
| title | 引江济淮-声发射监测应用案例 |
| Transaction Info | Block #87776241/Trx 1d8eb59668fcf32a75bede3b335e5db77cf010b4 |
View Raw JSON Data
{
"block": 87776241,
"op": [
"comment",
{
"author": "barrylee",
"body": "引江济淮之 — — 合六叶桥梁箱梁焊缝声发射监测\n2023年2月引江济淮之 — — 合六叶桥安装<a href=\"https://ae-ndt.com/plus/view.php?aid=609\">RAEM1智能声发射监测设备</a>对桥梁箱梁内垂直于车道方向的焊缝进行在线监测。引江济淮工程是一项以城乡供水和发展江淮航运为主,结合灌溉补水和改善巢湖及淮河水生态环境为主要任务的大型跨流域调水工程。焊缝处理不当,易发生大载荷而骤然断裂事故。\n\n![1-230302103KKK[1].jpg](https://cdn.steemitimages.com/DQmeyFBpJ1SCguYL6wXswkfu3vxAa9abTPxrWMhhaKSk7Zb/1-230302103KKK[1].jpg)\n\n\n合六叶桥\n\n\n\n使用声发射智能监测设备能够365天在线实时监测检测,全过程自动分析结果,支持手机蓝牙巡检,物联网远程操作使用,手机报警推送。\n\n引江济淮之 — — 铭传路桥梁断丝声发射监测\n2023年2月引江济淮之 — — 铭传路桥安装<a href=\"https://ae-ndt.com/plus/view.php?aid=609\">RAEM1智能声发射监测设备</a>对拱桥吊杆断丝进行在线监测,为桥梁安全保驾护航。引江济淮工程是一项以城乡供水和发展江淮航运为主,结合灌溉补水和改善巢湖及淮河水生态环境为主要任务的大型跨流域调水工程。\n\n\n铭传路桥\n\n\n声发射传感器安装分布图\n\n声发射采集器的优势\n\n特点过程·信号和时间触发\n·瞬态信号和连续信号采集\n·长期监测诊断\n·远程监测和无线单通道检测仪◆关键部位安装RAEM1,监测缆索断丝\n◆开启采集\n◆分析验证,得到判据标准\n◆验证效果良好,关闭波形和参数输出\n◆设置判据,手机平台推送信息\n\n总结\n\n实现了按标准(JT/T 1037–2022公路桥梁结构监测技术规范)对悬索桥吊索、主缆,斜拉桥斜拉索,拱桥吊杆(索)或系杆的桥梁缆索断丝声波(声发射)监测检测。\n\n并按标准给出每一条缆索的断丝根数及断丝率(断丝根数占该条缆索总根数的百分比即为断丝率)。用户可根据标准内容及时开展检查维修、缆索更换。杜绝因损伤累积发展而导致的损失和事故。\n\n引江济淮之 — — 清溪西路桥梁系杆断丝声发射监测\n2023年2月引江济淮之 — — 清溪西路桥安装<a href=\"https://ae-ndt.com/plus/view.php?aid=609\">RAEM1智能声发射监测设备</a>对桥梁系杆断丝进行在线声发射监测,为桥梁安全保驾护航。引江济淮工程是一项以城乡供水和发展江淮航运为主,结合灌溉补水和改善巢湖及淮河水生态环境为主要任务的大型跨流域调水工程。\n\n\n清溪西路桥梁\n\n\n声发射传感器安装是示意图\n\n\nRAEM1声发射监测设备监测现场\n\nRAEM1声发射监测设备可接入用户监控平台或云服务等数据平台实时显示数据,也可将参数评级结果等数据内容推送给手机APP,实现实时参数评级判据报警等实时手机数据内容提醒功能;可设置并输出出现断丝报警及设置断丝率报警:出现断丝二级报警,断丝率2%以上,三级报警;",
"json_metadata": "{\"tags\":[\"bridge\"],\"image\":[\"https://cdn.steemitimages.com/DQmeyFBpJ1SCguYL6wXswkfu3vxAa9abTPxrWMhhaKSk7Zb/1-230302103KKK[1].jpg\"],\"links\":[\"https://ae-ndt.com/plus/view.php?aid=609\"],\"app\":\"steemit/0.2\",\"format\":\"markdown\"}",
"parent_author": "",
"parent_permlink": "bridge",
"permlink": "2mgijf",
"title": "引江济淮-声发射监测应用案例"
}
],
"op_in_trx": 0,
"timestamp": "2024-08-16T10:23:48",
"trx_id": "1d8eb59668fcf32a75bede3b335e5db77cf010b4",
"trx_in_block": 0,
"virtual_op": 0
}bluesniperupvoted (100.00%) @barrylee / 2f1jeg2024/08/15 10:48:27
bluesniperupvoted (100.00%) @barrylee / 2f1jeg
2024/08/15 10:48:27
| author | barrylee |
| permlink | 2f1jeg |
| voter | bluesniper |
| weight | 10000 (100.00%) |
| Transaction Info | Block #87747998/Trx 753717cb02523bf7d95126d3d093fbd4a3cec8f6 |
View Raw JSON Data
{
  "block": 87747998,
  "op": [
    "vote",
    {
      "author": "barrylee",
      "permlink": "2f1jeg",
      "voter": "bluesniper",
      "weight": 10000
    }
  ],
  "op_in_trx": 0,
  "timestamp": "2024-08-15T10:48:27",
  "trx_id": "753717cb02523bf7d95126d3d093fbd4a3cec8f6",
  "trx_in_block": 2,
  "virtual_op": 0
}2024/08/15 10:42:57
2024/08/15 10:42:57
| author | barrylee |
| body | 铸铁烘缸声发射检测 发布时间:2023-02-01 13:59 阅读次数:284 在复杂应力条件下,铸铁烘缸应力危险区最先出现失效,最终导致整个烘缸压力容器的安全隐患。采用动态监测的声发射技术对保证铸铁烘缸安全提供重要保障。 ![1-23030Q4114Q30[1].jpg](https://cdn.steemitimages.com/DQmfGXdS21xxRoWQuGw9e62KiZXi67M2bhZCc9xySftrDCw/1-23030Q4114Q30[1].jpg) 清诚声发射(原声华公司)应邀利用SAEU2S-18型声发射仪对金红叶纸业(苏州工业园区)有限公司使用的34.55 m3容量的铸铁烘缸进行检测,该铸铁烘缸完好,无需其他常规无损检测复验,避免了企业为保证安全而盲目更换新烘缸,为企业节省了购置更换新设备的费用。 |
| json metadata | {"tags":["ae"],"image":["https://cdn.steemitimages.com/DQmfGXdS21xxRoWQuGw9e62KiZXi67M2bhZCc9xySftrDCw/1-23030Q4114Q30[1].jpg"],"app":"steemit/0.2","format":"markdown"} |
| parent author | |
| parent permlink | ae |
| permlink | 2f1jeg |
| title | 铸铁烘缸声发射检测 |
| Transaction Info | Block #87747888/Trx ebf59f3da225b47ebe15c7aa5871edd72b618e83 |
View Raw JSON Data
{
  "block": 87747888,
  "op": [
    "comment",
    {
      "author": "barrylee",
      "body": "铸铁烘缸声发射检测\n发布时间:2023-02-01 13:59 阅读次数:284\n       在复杂应力条件下,铸铁烘缸应力危险区最先出现失效,最终导致整个烘缸压力容器的安全隐患。采用动态监测的声发射技术对保证铸铁烘缸安全提供重要保障。\n\n![1-23030Q4114Q30[1].jpg](https://cdn.steemitimages.com/DQmfGXdS21xxRoWQuGw9e62KiZXi67M2bhZCc9xySftrDCw/1-23030Q4114Q30[1].jpg)\n\n       清诚声发射(原声华公司)应邀利用SAEU2S-18型声发射仪对金红叶纸业(苏州工业园区)有限公司使用的34.55 m3容量的铸铁烘缸进行检测,该铸铁烘缸完好,无需其他常规无损检测复验,避免了企业为保证安全而盲目更换新烘缸,为企业节省了购置更换新设备的费用。",
      "json_metadata": "{\"tags\":[\"ae\"],\"image\":[\"https://cdn.steemitimages.com/DQmfGXdS21xxRoWQuGw9e62KiZXi67M2bhZCc9xySftrDCw/1-23030Q4114Q30[1].jpg\"],\"app\":\"steemit/0.2\",\"format\":\"markdown\"}",
      "parent_author": "",
      "parent_permlink": "ae",
      "permlink": "2f1jeg",
      "title": "铸铁烘缸声发射检测"
    }
  ],
  "op_in_trx": 0,
  "timestamp": "2024-08-15T10:42:57",
  "trx_id": "ebf59f3da225b47ebe15c7aa5871edd72b618e83",
  "trx_in_block": 7,
  "virtual_op": 0
}2024/08/11 09:03:12
2024/08/11 09:03:12
| author | barrylee |
| permlink | application-and-improvement-of-bridge-cable-broken-wire-acoustic-emission-monitoring-system |
| voter | bluesniper |
| weight | 10000 (100.00%) |
| Transaction Info | Block #87631012/Trx bbb28049f9a636e80589008cebb35d3c1cb3a04b |
View Raw JSON Data
{
  "block": 87631012,
  "op": [
    "vote",
    {
      "author": "barrylee",
      "permlink": "application-and-improvement-of-bridge-cable-broken-wire-acoustic-emission-monitoring-system",
      "voter": "bluesniper",
      "weight": 10000
    }
  ],
  "op_in_trx": 0,
  "timestamp": "2024-08-11T09:03:12",
  "trx_id": "bbb28049f9a636e80589008cebb35d3c1cb3a04b",
  "trx_in_block": 9,
  "virtual_op": 0
}2024/08/11 08:57:36
2024/08/11 08:57:36
| author | barrylee |
| body | Application and improvement of bridge cable broken wire acoustic emission monitoring system Zhang Lidong, Liu Shifeng, Wang Shuang, Xie Jiehui, QingCheng AE institute (Guangzhou) Co., Ltd, Guangzhou 510663 Abstract: With the release and implementation of "JT/T 1037-2022 Technical Specifications for Highway Bridge Structure Monitoring" and the draft for comments on related industry standards, the use of acoustic emission technology to monitor cable wire breakage has been extended from laboratory applications to field applications. Cable wire breakage has become a key monitoring target for bridge structure safety, especially for cables in suspension bridges, cable-stayed bridges, and arch bridges in long highway bridges. This paper systematically describes the application of acoustic emission technology in the test and on-site application, and proposes feasible improvement suggestions for the problems encountered in the implemented projects to solve the bottleneck problems encountered in the current monitoring of cable wire breakage. Keywords: Acoustic emission Cable Broken Wire Bridge Structure 1 Introduction After years of mechanical tests on steel strands in bridge cables and acoustic emission detection and verification of structures such as bridge sling cables and main cables on site, domestic scholars have updated the Technical Specifications for Monitoring Highway Bridge Structures from the 2016 version to the current JT/T 1037-2022 version, in which Item 8.5.5 clearly states: Acoustic emission monitoring methods should be used for broken wire monitoring. For broken wires in suspension bridge slings, main cables, cable-stayed bridge cables, arch bridge suspenders (cables), tie rods and other steel cable structures exposed to the air, acoustic emission sensors with higher resonant frequencies can be used. The working temperature range should be -30 ℃ ~ 70 ℃, and the working frequency range should be 40 kHz ~ 100 kHz; for broken wires in prestressed steel cables buried in concrete, acoustic emission sensors with slightly lower resonant frequencies can be used, and the working frequency range should be 10 kHz ~ 40 kHz. Item 7.5.5: For main cables and suspenders of cable bridges, cable-stayed bridges, and arch bridge suspenders (cables) and tie rods, which are rated as "corroded" or "rusted" with a scale of 3 or above according to JTG/T H21, it is advisable to set broken wire measuring points. The measuring points can be set at the head end position or the position of broken wires that are prone to corrosion. Table 8 Sampling frequency of structural change monitoring content The table mentions a 2M sampling rate to trigger collection. The specification only points out the hardware configuration, alarm content and monitoring location, and does not specify the specific installation location on the cable and the configuration of acoustic emission parameters. This article comprehensively describes the test and the acoustic emission of broken wires of installed suspenders, and puts forward feasible improvement suggestions for the problems encountered in the implemented projects. 2 Current status of acoustic emission technology and products The phenomenon that a material emits transient elastic waves due to the rapid release of energy is called acoustic emission, also known as stress wave emission. The technology of detecting, recording, analyzing the sound source signal with the help of sensitive electronic instruments and inferring the acoustic emission source by using the acoustic emission signal is called acoustic emission technology. Its system is mainly composed of acoustic emission acquisition instrument (card), preamplifier, sensor and computer and software based on Windows operating platform. At present, the simplified waveform characteristic parameter analysis method of acoustic emission is a classic analysis method widely used since the 1950s. Almost all acoustic emission detection standards use simplified waveform characteristic parameters as the criterion for the acoustic emission source. Generally, only the acoustic emission data exceeding the set trigger threshold are recorded and analyzed. In laboratories and engineering applications, it is generally believed that the lower the threshold setting, the better the signal can be captured. However, in terms of wire material testing machine stretching, simulated wire breaking, and bridge cable noise testing, it has been proved in practice that this rule does not need to be followed. In the process of converting laboratory results into engineering monitoring applications, acoustic emission technology faces two main technical difficulties: first, the acoustic emission instruments on the market are generally multi-channel systems, and the number of channels cannot be configured according to the actual monitoring point requirements, resulting in unnecessary cost increases; second, the acoustic emission instrument mainly relies on a computer based on the Windows operating platform to work, and the computer crash and restart will cause the communication of the acoustic emission instrument to be interrupted, requiring human intervention to recover. The problem that needs to be solved at present is to match the corresponding number of channels according to actual needs and to create an acoustic emission system that can work without relying on an industrial computer placed on site. 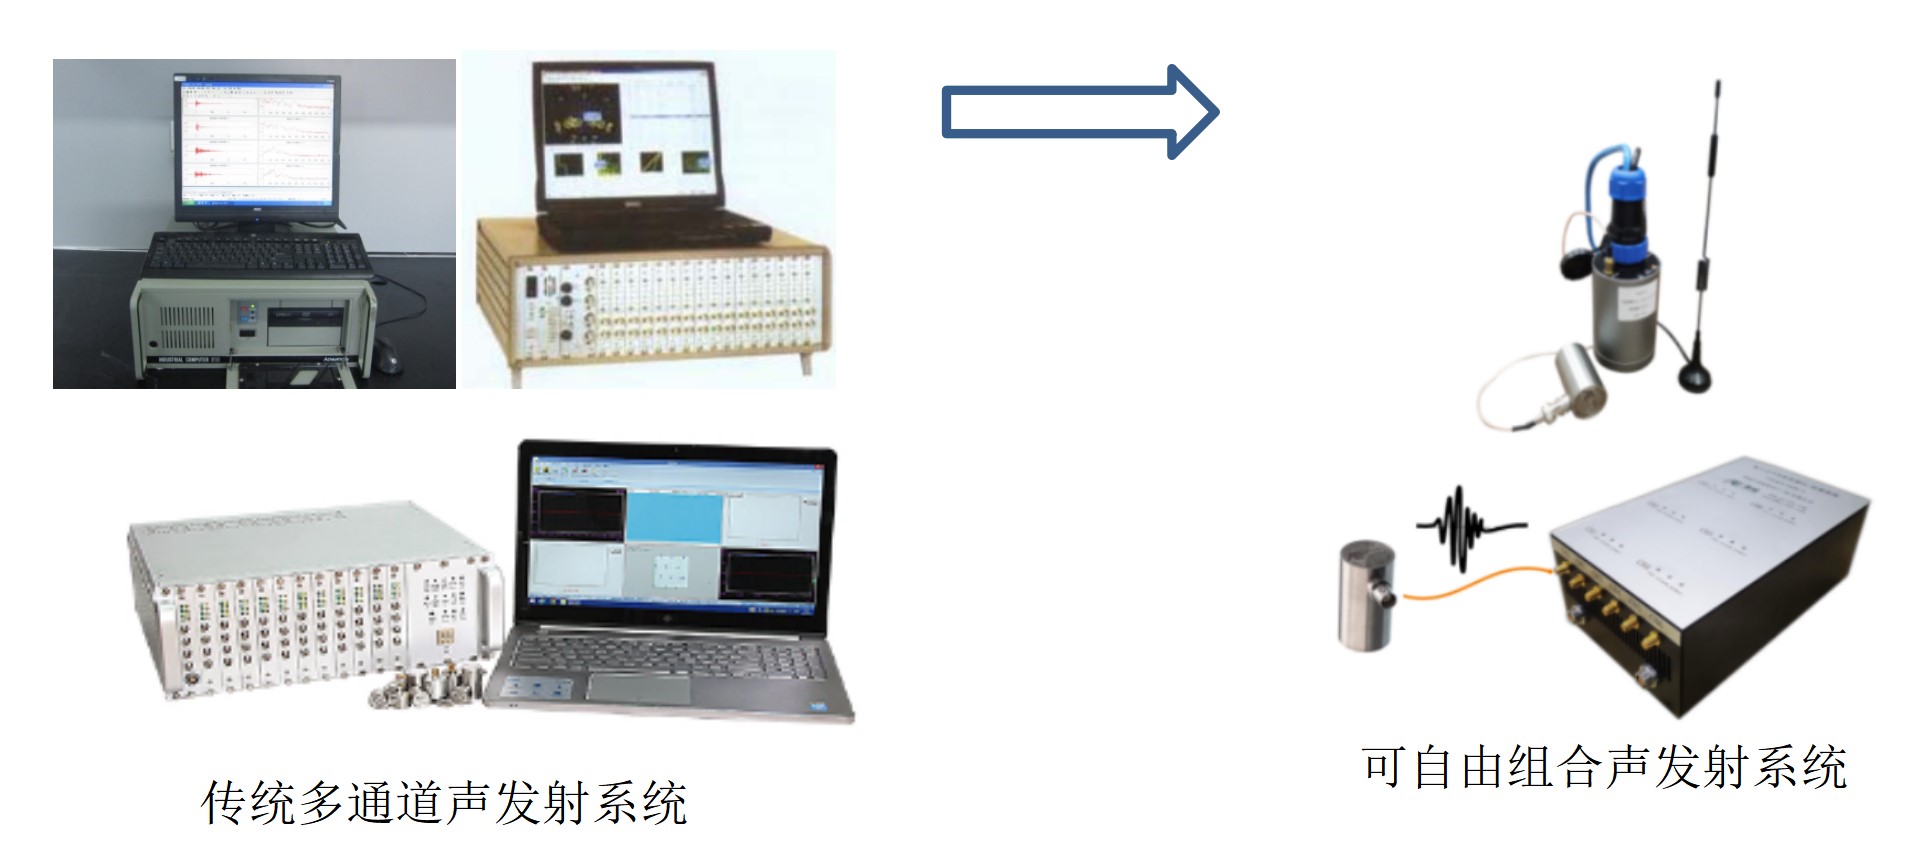 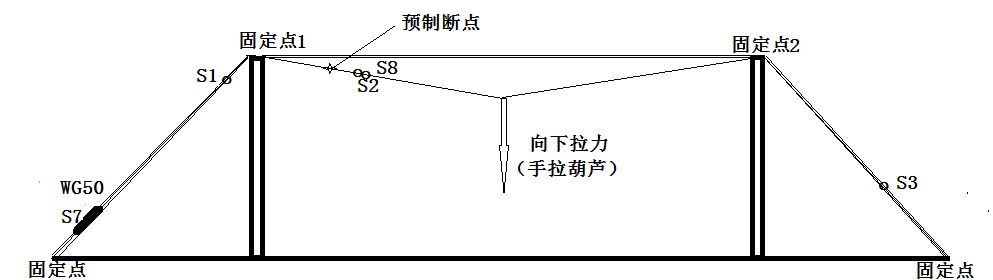 Figure 1 Transformation of acoustic emission detection system 3 Basic test of cable wire breakage 3.1 Simulate the collapse of a single steel wire 3.1.1 Test conditions Thesingle steel wire is fixed by using the concrete beam column of the factory building as a fulcrum. The test object is a single 7mm diameter steel wire commonly used in cables, with prefabricated slot defects. The manual hoist is used as an external force application method. The hoist is manually tightened until the steel wire breaks. The acoustic emission signal during the test is received by sensors of different frequencies installed on the steel wire. The acoustic emission instruments and performance used are as follows: SAEU2S-8 acoustic emission detector: 10M sampling rate, 16bitAD; G150 acoustic emission sensor: center frequency 150KHz, working frequency domain: 60~400KHz; WG50 acoustic emission sensor: frequency domain range: 50~800KHz; PAI preamplifier: working frequency domain: 20~1200KHz, 40dB (100 times) amplification 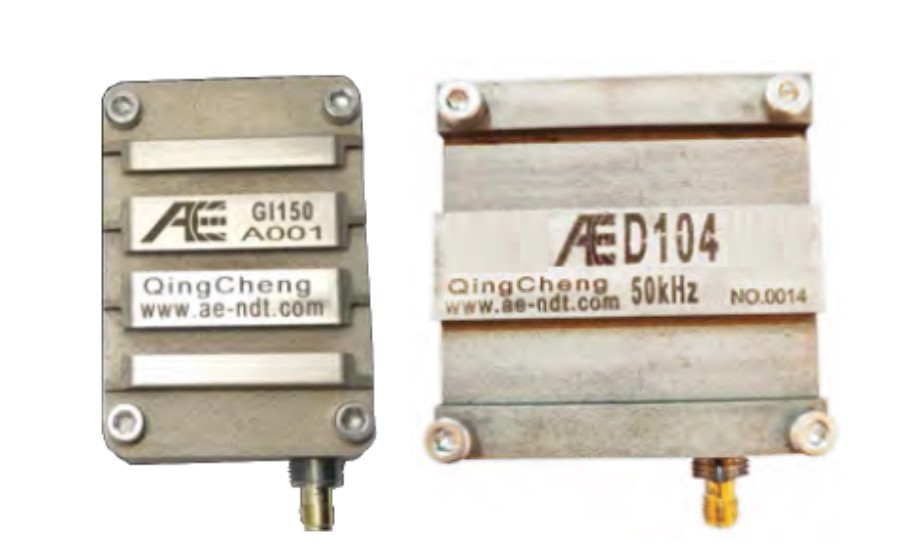 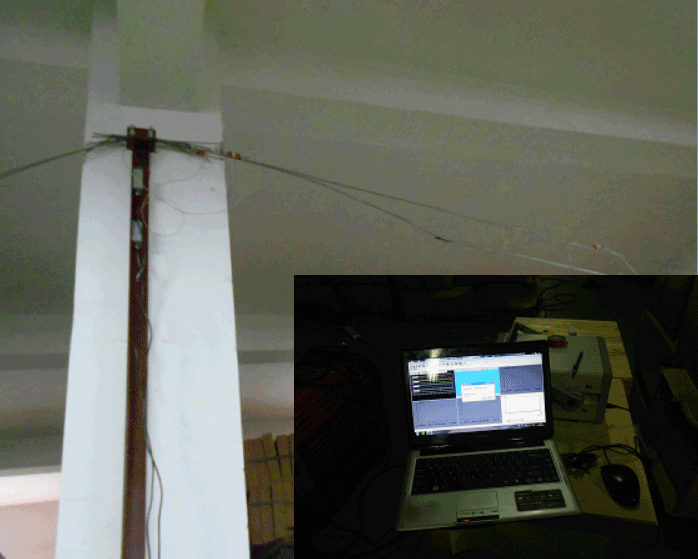 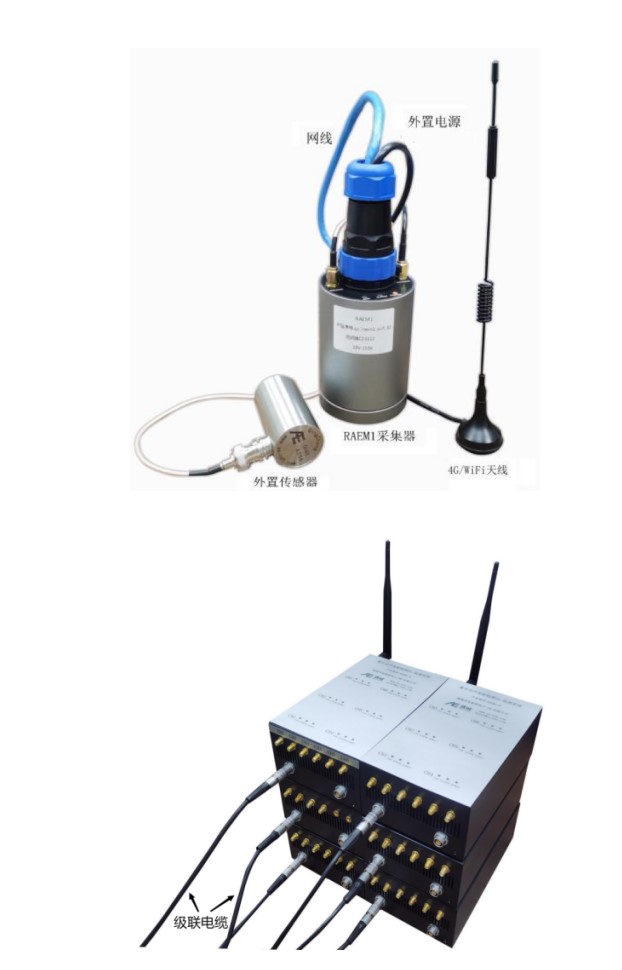 Figure 2 Schematic diagram of installation with a single steel wire breakage 3.1.2. Parameter configuration and installation The industry generally believes that the frequency domain of carbon steel crack signals is mainly distributed in the range of 100-300kHz. However, due to the influence of the size structure of the test object and the sound wave transmission path, its frequency domain characteristics may change. Therefore, a narrow-band sensor suitable for metal crack detection and a wide-band sensor convenient for frequency domain analysis are selected in the sensor frequency domain, and corresponding considerations are made on the installation position. Table 1 Sensor installation location and AE parameter configuration Sensor No. model Location Filter band S1 G150 The distance from the fixed point 1 is 500mm; the distance from the pre-breaking point is 1800mm 100kHz—400kHz S2 G150 300mm from the fracture position 100kHz—400kHz S3 G150 13500mm from the fracture position 100kHz—400kHz S7 WG50 Distance from fracture position 5300mm 20kHz—1200kHz S8 WG50 300mm from the fracture position 20kHz—1200kHz General acoustic emission configuration: sampling rate = 3000kHz, threshold = 40db, HDT = 2000us, PDT = 1000us, HLT = 20000us 3.1.3 Attenuation The 150K resonant sensor S2 and the broadband sensor S8 installed close to each other were used as the acquisition channels, and the signal attenuation of a single steel wire was tested by breaking a lead core with a diameter of 0.5 and a hardness of HB as a simulation source. In order to simulate the attenuation characteristics of the acoustic emission signal on the steel wire under actual working conditions, the steel wire was pre-tightened by a manual hoist, and then the lead breaking test was performed at different positions of the steel wire. The on-site and data results are as follows: Figure 3: Steel wire breaking test site Table 2 Attenuation test results Distance/m Measurement value/dB 0 0.1 0.5 1.0 2.0 3.0 5.0 7.0 9.0 11 14 S2 (150K resonance) 100 92 86 79 80 79 72 69 64 59 45 S8 (Broadband) 99 90 82 77 73 67 62 60 55 46 / 3.1.4 Test results A total of 4 pull-off tests were conducted during the experiment. The first test was for a new steel wire with prefabricated slot defects. After the fracture was lap-welded, the gap was prefabricated again and repeated. Because the steel wire fracture was welded multiple times and the fixed point structure was disassembled and installed multiple times, the subsequent 3 pull-offs not only verified the types of broken wire acoustic emission characteristic parameters, but also generated some interference source signals. Under the condition of attenuation of the broken lead signal test, the resonant narrowband sensor has a longer receiving distance and its frequency response range is more targeted at the metal crack characteristics, so the reference 150kHz sensor is selected as the type of judgment parameter. In order to obtain the frequency characteristics of the steel wire breakage and avoid the misjudgment of the signal frequency band distribution caused by the resonant sensor resonance point, the sensor selected for frequency domain processing is a broadband sensor. Figure 4 AE parameter history diagram of the new steel wire breaking process The broadband sensor receives the time domain signal before the fracture The broadband sensor receives the frequency domain signal before the fracture At the moment of fracture, the broadband sensor receives the time domain signal At the moment of fracture, the broadband sensor receives the frequency domain signal Fig.5 Time domain and frequency domain characteristics of the new steel wire breaking process 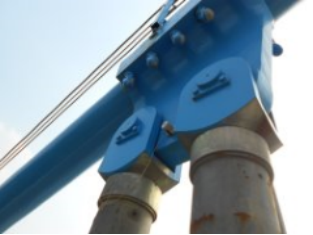 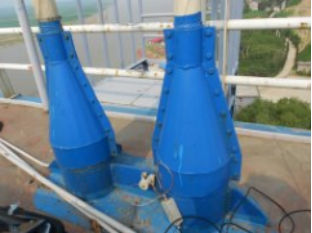 Fig.6 AE parameter history diagram of the first breaking process after weldingFig.7 AE parameter history diagram of the second breaking process after welding Time Domain Frequency Domain Figure 8 Crack signal at welding position Time Domain Frequency Domain Figure 9: Signal of wire sliding within the fixed point 3.1.4 Summary of this paragraph 1. The accumulated values of amplitude, energy and ringing count in the acoustic emission characteristic parameters can be consistent with the moment of wire breakage, and the above three can be used to determine wire breakage; 2. In the acoustic emission amplitude history diagram, the value displayed at the moment of wire breakage is 100dB, and the actual intensity is very likely to be greater than this value. This assumption can be confirmed in papers published by others; 3. The acoustic emission signal of wire breakage is a relatively broadband signal. The near-point frequency of a single steel wire is mainly distributed between 50kHz and 200kHz, but as the distance between the breakpoint and the sensor increases, the high-frequency component will decrease accordingly. (This experiment was conducted in 2015. The resonant frequency range of the cable wire monitoring sensor should be within the range of 100kHz to 400kHz, which has been revised to 50-100kHz in the 2022 version.) 4. The FFT spectrum peak of the sliding signal of the steel wire in the fixed point is displayed at 50kHz, which can be regarded as the friction signal between multiple strands of steel wire under the actual sling force to a certain extent. 4 Real bridge cable attenuation test Based on the test results of the single steel wire in the upper part and the theoretical basis of the short propagation distance of high-frequency signals, a sensor with a resonant frequency of 40kHz and a frequency domain range of 15 to 70kH was selected to perform the acoustic emission signal attenuation test of the real bridge cable. The real bridge is located near the current Zhengzhou East Station. The side span main cable was selected for the test. Its structural situation is shown in the following schematic diagram: Figure 10 Schematic diagram of the side span of Chaohe Bridge 4.1 Signal attenuation of the anti-corrosion layer The SR40M (15-75kHz) sensor is placed on the upper half of the first lock clamp structure. The lead break signal is given at two locations 10 cm away from the sensor. The lead is broken 5 times at each location. The 3 maximum amplitudes are taken to calculate the average value. The positions are defined as P1 and P2. P1 is on the lock clamp and P2 is on the anti-corrosion layer outside the main cable. Table 3 Anti-corrosion layer attenuation data Position measurement value dB P1 Position P2 Position first 91 76 Second time 89 75 The third time 88 77 average value 89 76 4.2 Signal attenuation of the lock clamp structure The sensor is fixed on the upper half of the lock clamp, and the lead-breaking signal is given at the typical position of the lock clamp to preliminarily measure the influence of the lock clamp structure on the acoustic emission signal Table 4 Lock clamp structure attenuation data Lead break position number Measuring amplitude P1 90 dB P2 87 dB P3 80 dB P4 73 dB P5 68 dB 4.3 Propagation distance test The sensor is installed on the anchor lock clamp (first lock clamp) at the bridge head for static noise collection. At that time, the test bridge was completed but not open to traffic, and the paint layer must not be damaged. The noise signal was less than 32dB. Since the catwalk will be climbed later to manually knock to give a simulated signal, the threshold is set to 40dB. Due to the attenuation effect caused by the anti-corrosion layer and paint, the lead break signal is not enough to be received by the distant sensor. Instead, the screwdriver knocks the lock clamp as the simulated source signal. The screwdriver knocks with moderate force to ensure that the knocking signal strength is lower than the signal strength at the moment of a single steel wire breaking and does not cause damage to the paint layer. The knocking position is each lock clamp, namely the first, second, third, fourth, fifth, sixth, and seventh lock clamps. Except for the first and second lock clamps at the bridge head, which are 7 meters apart horizontally, the remaining lock clamps are 5 meters apart. 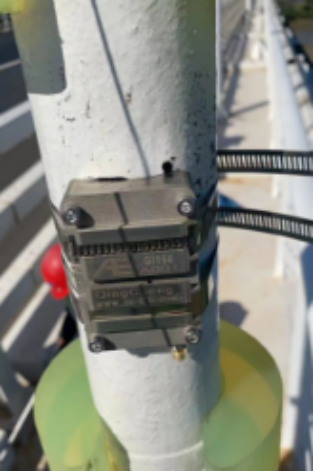 Figure 10: Location of the striking point The blade end of the screwdriver is downward, and the free fall of 50cm to the upper surface of the lock clamp is used as an artificial simulation source. Each lock clamp position is free-falling 5 times, and the three maximum amplitudes before each lock clamp are recorded to calculate the measurement value. The data list is as follows: Table 5 Propagation distance range list Position amplitude dB Lock clip 1 Lock Clip 2 Lock clip 3 Lock clip 4 Lock clip 5 Lock clip 6 Lock clip 7 first 100 78 55 52 43 43 / Second time 100 80 53 56 41 45 / The third time 100 87 53 50 47 41 / average value 100 82 54 53 44 43 / 4.4 Summary of this paragraph 1. The anti-corrosion layer of the main cable is relatively thick, and the paint layer has a signal attenuation of about 10dB, and the wrapped anti-corrosion structure has a signal attenuation of 25dB; 2. The lock clamp structure of the unserviced bridge has a large attenuation for the acoustic signal, and each additional level of structure attenuation is about 7dB; 3. The knocking signal provided by the 50cm free fall of the screwdriver can be received by the sensor 27 meters away. 5 Noise level test Acoustic emission technology is a passive receiving method, and there must be external excitation to make the defects "move" before they can be identified. For bridge cables, the main excitation is the quality of the box girder and road pavement, the weight and resonance of vehicles passing by; the main noise sources come from vehicles passing by, wind noise and whistles, rain, snow and hail weather, etc. The usual treatment method is to exclude noise except broken wire signals by setting a threshold value. Combined with the single steel wire breaking and structural attenuation test data, the instantaneous acoustic emission of the broken wire is characterized by high amplitude, high energy and high ringing count, and can be transmitted over a certain distance. It is feasible to do noise testing to determine whether it is feasible to only set a threshold. By installing the same signal sensors on the root structure and locking clamp of a short cable of about 3 meters in length on a suspension bridge, the response of different positions to the same signal was tested. The data showed that the noise level of the sensor installed on the locking clamp of the 3-meter-long cable was less than 45dB when a vehicle passed by, the signal level received at the bottom of the cable was less than 60dB, and the signal frequency domain distribution was less than 30kHz. Table 6 Noise test Sling Locking Clamp Sling root Sensor location diagram Threshold 40dB 40dB Passenger car Amplitude: None Amplitude: 45dB Large Trucks Amplitude: 44dB Amplitude: 60dB 6 Broken wire monitoring of suspension bridge suspenders 6.1 Brief description of instrument configuration The RAEM1 type broken wire intelligent acoustic wave monitoring system independently developed and produced by Qingcheng Acoustic Emission Research (Guangzhou) Co., Ltd. is selected. This product is an intelligent Internet of Things acoustic wave monitoring system that integrates signal acquisition control, analysis, storage and communication. The site no longer relies on computers based on the Windows operating platform. It has the function of automatic restart when power is off, and can perform unattended automatic data acquisition, storage, analysis and output 24 hours a day. It can be used as a detection instrument, and in-depth analysis can be performed through acoustic emission waveforms and characteristic parameter data. The data can also be uploaded to the designated cloud server as required for function display and alarm rating. On the Qingcheng self-built cloud platform, parameter configuration can be remotely realized, and the real-time and historical change trend charts of acoustic emission data can be viewed. According to the requirements of "JT/T 1037-2022 Highway Bridge Structure Monitoring Technical Specifications", the broken wire alarm conditions and parameter configuration are set. It is a dedicated monitoring of broken wires of suspension bridge suspenders, main cables, cable-stayed bridge cable, and arch bridge suspender (cable) tie rods; its specific functions and parameters of software and hardware are as follows: Sensor ★ Targeted fitting design ★ Center frequency: 50KHz ★ Frequency range: 40KHz-100KHz; ★ Operating temperature range: -30℃~70℃; ★ Meets the requirements of JT/T 1037-2022 standard; Figure 11 Broken wire sensor Collector ★ Independent channel, sampling rate 2M, sampling accuracy 16 bits; ★ Signal input bandwidth 10K-1000KHz; ★ Noise ASL better than 30dB, dynamic range 70dB; ★ Data type: original waveform or filtered waveform, characteristic parameters; ★ Acoustic emission impact parameter data, including arrival time, amplitude, ringing count, energy, rise time, duration, RMS, ASL, energy; ★ Built-in 64G data storage card, which can store the above 3 types of data; ★ Communication method: 4G Internet of Things and WAN port ★ Power supply: external power supply, DC 12V; ★ Working environment temperature -20℃--+60℃; ★ Dimensions φ50X120mm/220X130X80mm ★ The module comes with magnetic Figure 12 Broken wire intelligent monitoring system Cloud platform function interface (a) Remote configuration of collection parameters on the cloud (b) Wire break alarm setting (c) Cloud real-time parameters/historical parameters time history diagram (d) Real-time/historical waveforms on the cloud (e) Setting the wire break rate function in the cloud (f) Number and rate of broken wires in the cloud Figure 11 Qingcheng Cloud Platform Bridge Broken Wire Monitoring System Function 6.2 Pre-installation test Combined with the visual window installed after the partial demolition of the anti-corrosion layer on site, it was found that some steel wires had been corroded and broken, so the acoustic emission sensor was installed at a certain height above the window to conduct noise testing and simulate broken wire signal identification. The period with large traffic volume was selected as the test window to collect noise signals as much as possible. The sampling mode of the collector was set to threshold trigger, and the threshold was set to 70dB. During the debugging stage, because there was no mains power supply on site, a 12V lithium battery pack was used to power the collector. The acoustic emission timing parameters were configured and data was viewed on the "Qingcheng Cloud Platform" through 4G communication. Figure 13 Broken wire monitoring test site The data of static noise and artificial steel block impact simulation wire breaking were collected for about 40 minutes. The trend chart of acoustic emission parameters was checked on the "Qingcheng Cloud Platform". It was found that the noise level could be controlled within 80dB during the period when no artificial impact signal was applied. The 6 signals of 2 sets of steel blocks hitting the root of the rigging had a good correspondence in "amplitude", "energy" and "RMS". (4 consecutive hits at 12:46; 2 consecutive hits at 12:48). Figure 14 Amplitude history diagram Figure 15 Energy history diagram Figure 16 RMS process diagram 6.3 System Hardware Installation The basic cause of cable wire breakage is the damage of the anti-corrosion layer at the root, which leads to material corrosion and hard damage in the installation link. In the long run, when the load suddenly increases, the stress cannot be released evenly, and the weak steel wire releases energy in the form of instantaneous breaking. The acoustic emission amplitude generated at the moment of release is greater than or close to 100dB. According to the previous signal attenuation test, the anti-corrosion layer or PE sheath attenuates the signal by about 25dB. When the sensor is installed close to the broken wire, the acoustic emission signal is likely to have an amplitude of 100dB. The anti-corrosion layer or PE sheath can be used as an attenuation medium to attenuate large signals or eliminate background noise signals; adjusting the installation height and structural position of the sensor on the cable can reduce the impact of the bridge deck noise source to a certain extent. Both long-term monitoring of acoustic emission and short-term detection of traditional applications require the investigation and elimination of front-end noise. Acoustic emission sensors are generally installed in contact, and the sensitive end face is generally a white protective sheet or curved surface. However, knocking or hitting the sensor housing will also cause the signal to exceed the threshold and be recorded. When monitoring the acoustic emission of broken wires in bridge cables, it is necessary to protect the sensor housing and cables within a certain range to ensure that external factors such as hail, sand and gravel do not trigger the threshold. After determining the installation position and height of the sensor, glue is used as a coupling agent and fixing method. During the installation process, try to avoid the presence of particles and concave and convex surfaces. Then, the sensor is tied to the cable with a metal tie. The best effect is to see a certain amount of uniform extrusion on the edge. After the sensor is fixed and connected to the coaxial cable, the sensor sheath needs to be installed. Its significance is to prevent the sensor from receiving external mechanical shock. The basic requirement is that it is installed securely and does not age for a long time. The installation and placement of the collector is still based on the current data security considerations in the industry. The main focus is to first form a local area network and then a single point to the outside. The requirement for the acoustic emission collector is that it must have a LAN port or WIfi networking function. ![Uploading image #16...]() 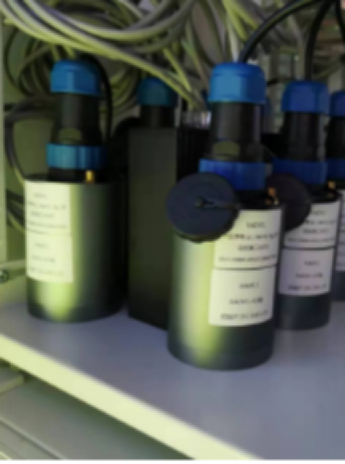 Figure 17 On-site installation diagram of broken wire monitoring system 6.4 Broken wire judgment For the monitoring of the fracture of a single steel wire inside the cable, the threshold trigger is used as the sampling method. While shielding the noise, the threshold must also ensure that the signal of the broken wire can be captured. The trigger threshold can be set to 70dB or 80dB for the monitoring of broken wires in long highway bridges. When the signal triggers the threshold, the energy, ringing count and RMS in the characteristic parameters are used to make a comprehensive judgment. Under relatively ideal working conditions, one or two of them can be used to judge the broken wire. For example, high amplitude, high energy, and high count are the main forms of characterizing fracture. When the noise of the on-site working conditions is large, the 80dB threshold cannot effectively shield the noise. You can first try to reduce the hardware amplifier multiple to increase the dynamic range of the system. At present, the maximum input voltage range of acoustic emission instruments and general data acquisition cards is generally ±10V. When the commonly used 40dB amplifier is selected, the signal at the moment of the broken wire will be limited and the amplitude difference with the noise cannot be widened. However, while reducing the gain, the signal-to-noise ratio of the signal is also reduced, and the transmission distance is also reduced. When it is impossible to effectively distinguish the broken wire signal by increasing the dynamic range, the amplitude should not be increased blindly. Energy, count, and RMS values can be used to assist in the judgment. If necessary, the proportional correspondence of "amplitude-ASL", "ring count-rise count", "duration-rise time" and so on can be added. 7 Summary 1. The break of a single steel wire in the cable is a representation of high amplitude, high energy, and high ring count in the acoustic emission signal; 2. The process can be displayed by the amplitude, energy, ring count, and RMS time history diagram; 3. The amplitude intensity of the acoustic emission signal at the moment of single steel wire breakage is greater than 100dB; for the monitoring of broken wires at key locations, the trigger threshold can be set to 70 or 80dB; 4. The anti-corrosion layer and the sheath are materials that attenuate the sound height by about 25dB. By changing the installation position of the sensor, the road noise source can be avoided to a certain extent; 5. The sound attenuation between the lock clamp and the anchor structure is large, and the attenuation is about 7dB for each structural member; 6. The signal of a 50cm screwdriver falling freely at 27 meters from the main cable of a newly built but unused bridge to the paint layer can be received by the acoustic emission system as 43dB; 8 Outlook 1. What is the real acoustic emission signal characterizing the specific situation of cable breakage in an in-service bridge? It is impossible to simulate, and there is currently no literature or experience to refer to; 2. There is no universal criterion for determining cable breakage based on acoustic emission, and specific problems must be analyzed specifically; 3. Acoustic emission researchers cannot have in-depth access to data due to industry closure or data security; 4. Bridge structure health monitoring is an integration of multiple means, and the integration of acoustic emission technology and other means is carried out throughout; 5. There is no practical support for the effective monitoring distance of acoustic emission technology for cables of different specifications. How to evolve it? 6. The authenticity of the location and number of cable breakage cannot be determined by acoustic emission alone. References [1] Ministry of Transport of the People's Republic of China. "JT/T 1037-2022 Technical Specifications for Highway Bridge Structure Inspection". 2022 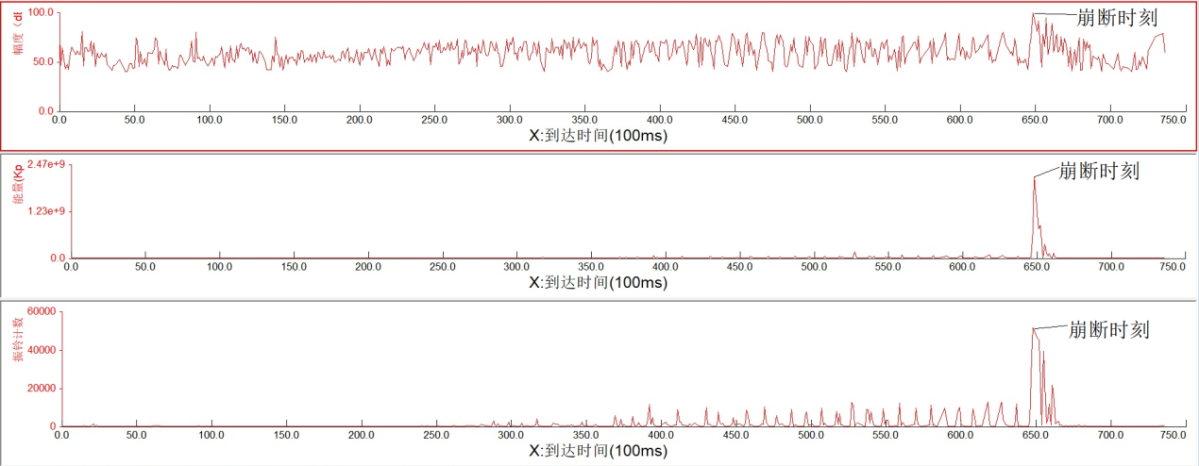 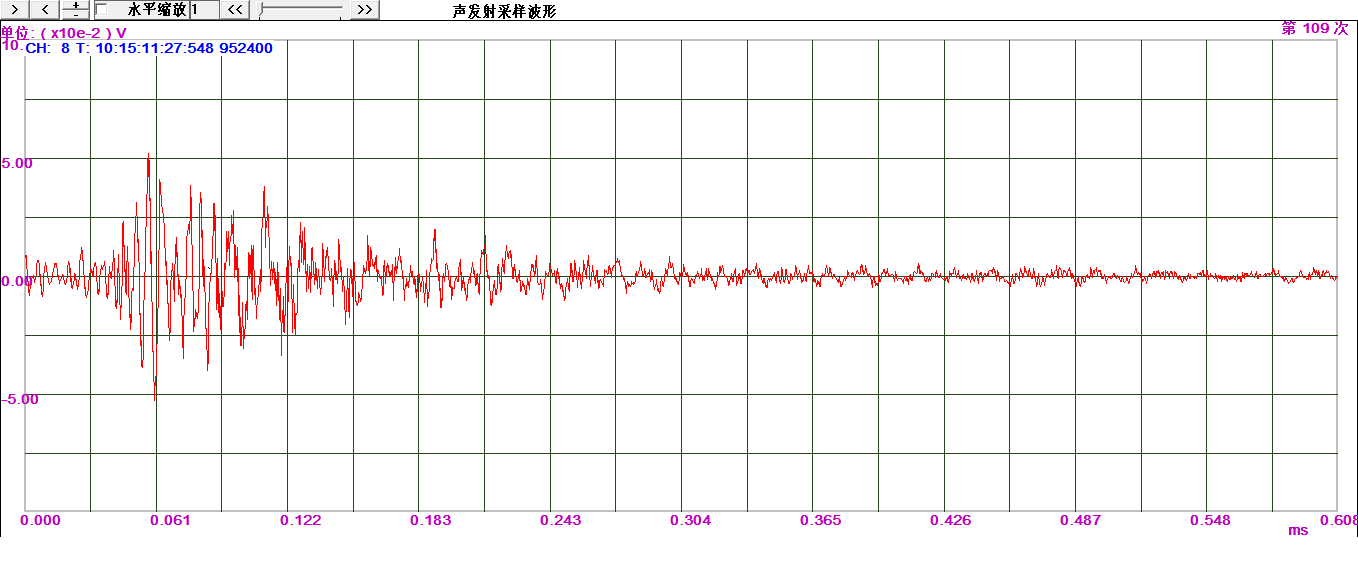 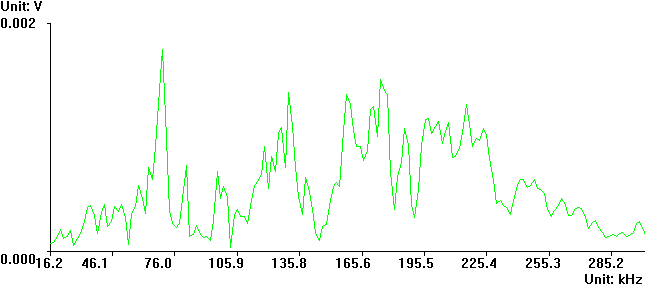 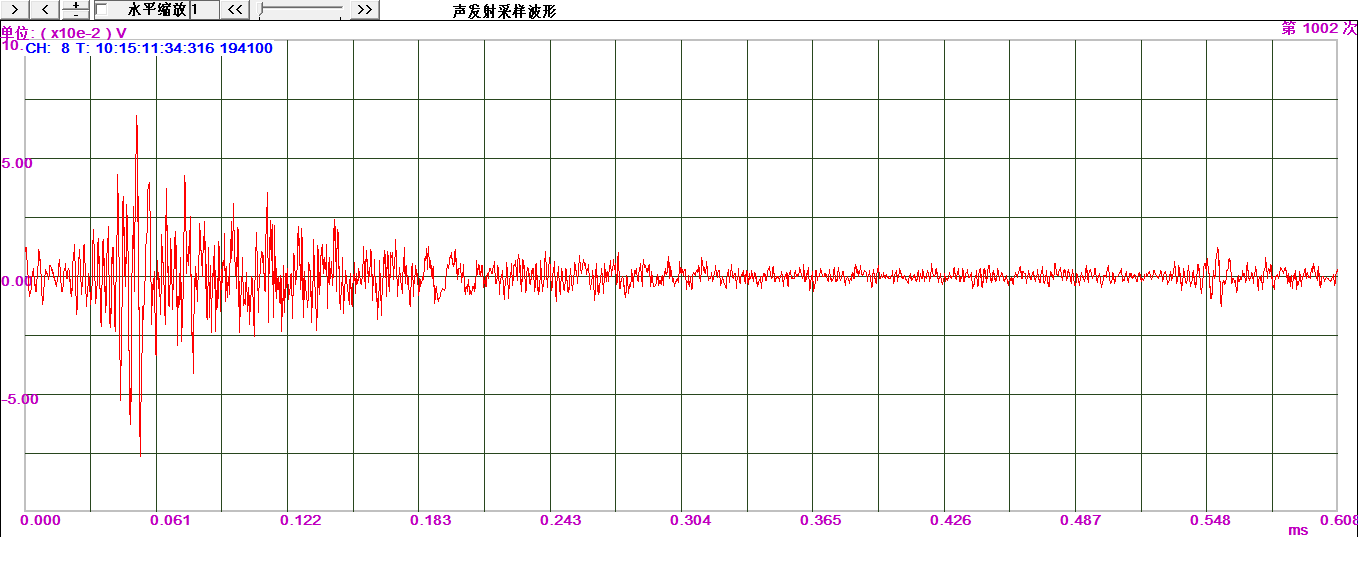 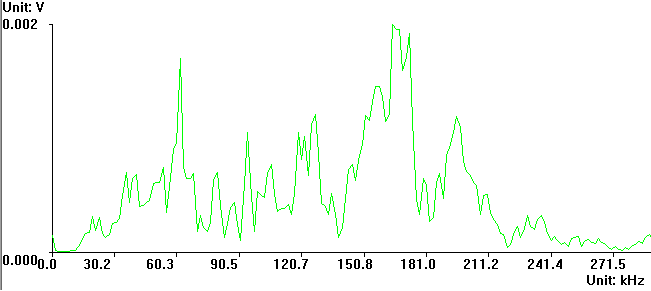  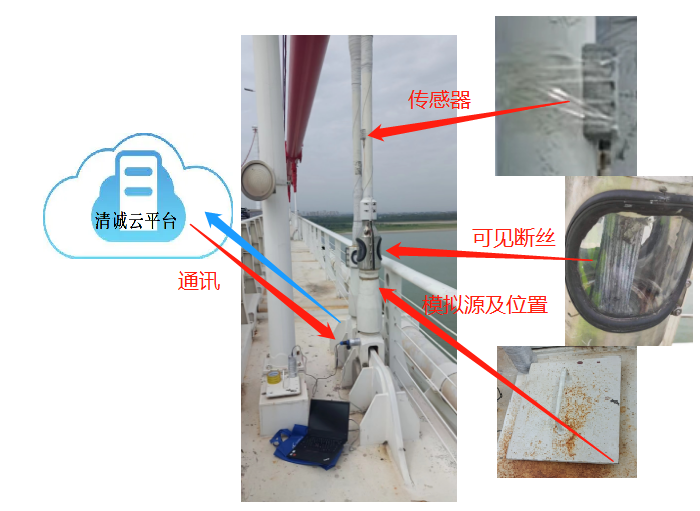 |
| json metadata | {"tags":["bridge"],"image":["https://cdn.steemitimages.com/DQmVZTPZVGhWMHz4rzDDic5jzHAzrNy1Vvoo18QX8Y9BjUw/bridge-cable-acoustic-emission-system1.jpg","https://cdn.steemitimages.com/DQmdPnVuoNZTZyMgbbxjR2U2j4fwBnfUduzCx2ACAnKcnhR/bridge-cable-acoustic-emission-system1.png","https://cdn.steemitimages.com/DQmTqfqtcbfj6khhH89RJ2k1GaGmtWQeq9r3Ykktgmeufpr/bridge-cable-acoustic-emission-system2.jpg","https://cdn.steemitimages.com/DQmUcCCjVZyWmRosVnY4TJSJdHarphTEGYn6pvvUHHcLwjo/bridge-cable-acoustic-emission-system2.png","https://cdn.steemitimages.com/DQmTUQqx292gLqMiHgArtriEcELMVYmQPFYd1yrgT48yzFk/bridge-cable-acoustic-emission-system3.jpg","https://cdn.steemitimages.com/DQmZh1vZ5Ryc5Nn8bomhtMk9xrTGJZFcfr5jzZeeAa7mxae/bridge-cable-acoustic-emission-system18.png","https://cdn.steemitimages.com/DQmauJYYGhYVyNKiZDGa2n8KcrYn9RaLzFrMicfFXr2Haq6/bridge-cable-acoustic-emission-system19.png","https://cdn.steemitimages.com/DQmcckGE9f8MZ79zW524LEGsQcm5NGmi3v2V1g2MfisWHPd/bridge-cable-acoustic-emission-system36.png","https://cdn.steemitimages.com/DQmSgDm9QJHVnbmgojWTqzgNNGh41m6gao5sZZTKS2hkxph/bridge-cable-acoustic-emission-system38.png","https://cdn.steemitimages.com/DQmby8nCRe9BFb8VS8AJFzBKDLaZawG4uBpHZ3mogMRKB7X/bridge-cable-acoustic-emission-system3.png","https://cdn.steemitimages.com/DQmcVn5iCNHwMqwHhiff5TCTe89WMf1urq5WAK6JMiuw3xj/bridge-cable-acoustic-emission-system4.png","https://cdn.steemitimages.com/DQmREiyeUqJGZrrbanw2R4WwtfUjK2XuJpGZRVCuwWW4uKV/bridge-cable-acoustic-emission-system5.png","https://cdn.steemitimages.com/DQmdrSK1rj13e4nzRkfJtyRxT4PDbEYvTJetteoSzfgqNYJ/bridge-cable-acoustic-emission-system6.png","https://cdn.steemitimages.com/DQmNzQZSPNpi1yPxcsiFzkNuh7RJ2ZL9993GotQ8vM7gWHW/bridge-cable-acoustic-emission-system7.png","https://cdn.steemitimages.com/DQmaLpNrvEKDk26CMwCM4websMZccvUCsjycem31BgrEmv4/bridge-cable-acoustic-emission-system32%20-%20%E5%89%AF%E6%9C%AC.png","https://cdn.steemitimages.com/DQmaLpNrvEKDk26CMwCM4websMZccvUCsjycem31BgrEmv4/bridge-cable-acoustic-emission-system32.png"],"app":"steemit/0.2","format":"markdown"} |
| parent author | |
| parent permlink | bridge |
| permlink | application-and-improvement-of-bridge-cable-broken-wire-acoustic-emission-monitoring-system |
| title | Application and improvement of bridge cable broken wire acoustic emission monitoring system |
| Transaction Info | Block #87630900/Trx 40ea84bcc3f433b6bd5f372b544fd982625d1ec1 |
View Raw JSON Data
{
"block": 87630900,
"op": [
"comment",
{
"author": "barrylee",
"body": "Application and improvement of bridge cable broken wire acoustic emission monitoring system\n\nZhang Lidong, Liu Shifeng, Wang Shuang, Xie Jiehui,\nQingCheng AE institute (Guangzhou) Co., Ltd, Guangzhou 510663\n \nAbstract: With the release and implementation of \"JT/T 1037-2022 Technical Specifications for Highway Bridge Structure Monitoring\" and the draft for comments on related industry standards, the use of acoustic emission technology to monitor cable wire breakage has been extended from laboratory applications to field applications. Cable wire breakage has become a key monitoring target for bridge structure safety, especially for cables in suspension bridges, cable-stayed bridges, and arch bridges in long highway bridges. This paper systematically describes the application of acoustic emission technology in the test and on-site application, and proposes feasible improvement suggestions for the problems encountered in the implemented projects to solve the bottleneck problems encountered in the current monitoring of cable wire breakage.\nKeywords: Acoustic emission Cable Broken Wire Bridge Structure\n \n1 Introduction\nAfter years of mechanical tests on steel strands in bridge cables and acoustic emission detection and verification of structures such as bridge sling cables and main cables on site, domestic scholars have updated the Technical Specifications for Monitoring Highway Bridge Structures from the 2016 version to the current JT/T 1037-2022 version, in which Item 8.5.5 clearly states: Acoustic emission monitoring methods should be used for broken wire monitoring. For broken wires in suspension bridge slings, main cables, cable-stayed bridge cables, arch bridge suspenders (cables), tie rods and other steel cable structures exposed to the air, acoustic emission sensors with higher resonant frequencies can be used. The working temperature range should be -30 ℃ ~ 70 ℃, and the working frequency range should be 40 kHz ~ 100 kHz; for broken wires in prestressed steel cables buried in concrete, acoustic emission sensors with slightly lower resonant frequencies can be used, and the working frequency range should be 10 kHz ~ 40 kHz. Item 7.5.5: For main cables and suspenders of cable bridges, cable-stayed bridges, and arch bridge suspenders (cables) and tie rods, which are rated as \"corroded\" or \"rusted\" with a scale of 3 or above according to JTG/T H21, it is advisable to set broken wire measuring points. The measuring points can be set at the head end position or the position of broken wires that are prone to corrosion. Table 8 Sampling frequency of structural change monitoring content The table mentions a 2M sampling rate to trigger collection. The specification only points out the hardware configuration, alarm content and monitoring location, and does not specify the specific installation location on the cable and the configuration of acoustic emission parameters. This article comprehensively describes the test and the acoustic emission of broken wires of installed suspenders, and puts forward feasible improvement suggestions for the problems encountered in the implemented projects.\n\n2 Current status of acoustic emission technology and products\nThe phenomenon that a material emits transient elastic waves due to the rapid release of energy is called acoustic emission, also known as stress wave emission. The technology of detecting, recording, analyzing the sound source signal with the help of sensitive electronic instruments and inferring the acoustic emission source by using the acoustic emission signal is called acoustic emission technology. Its system is mainly composed of acoustic emission acquisition instrument (card), preamplifier, sensor and computer and software based on Windows operating platform. At present, the simplified waveform characteristic parameter analysis method of acoustic emission is a classic analysis method widely used since the 1950s. Almost all acoustic emission detection standards use simplified waveform characteristic parameters as the criterion for the acoustic emission source. Generally, only the acoustic emission data exceeding the set trigger threshold are recorded and analyzed. In laboratories and engineering applications, it is generally believed that the lower the threshold setting, the better the signal can be captured. However, in terms of wire material testing machine stretching, simulated wire breaking, and bridge cable noise testing, it has been proved in practice that this rule does not need to be followed.\nIn the process of converting laboratory results into engineering monitoring applications, acoustic emission technology faces two main technical difficulties: first, the acoustic emission instruments on the market are generally multi-channel systems, and the number of channels cannot be configured according to the actual monitoring point requirements, resulting in unnecessary cost increases; second, the acoustic emission instrument mainly relies on a computer based on the Windows operating platform to work, and the computer crash and restart will cause the communication of the acoustic emission instrument to be interrupted, requiring human intervention to recover. The problem that needs to be solved at present is to match the corresponding number of channels according to actual needs and to create an acoustic emission system that can work without relying on an industrial computer placed on site.\n\n\n\n\n\nFigure 1 Transformation of acoustic emission detection system\n3 Basic test of cable wire breakage\n3.1 Simulate the collapse of a single steel wire\n 3.1.1 Test conditions\nThesingle steel wire is fixed by using the concrete beam column of the factory building as a fulcrum. The test object is a single 7mm diameter steel wire commonly used in cables, with prefabricated slot defects. The manual hoist is used as an external force application method. The hoist is manually tightened until the steel wire breaks. The acoustic emission signal during the test is received by sensors of different frequencies installed on the steel wire. The acoustic emission instruments and performance used are as follows:\nSAEU2S-8 acoustic emission detector: 10M sampling rate, 16bitAD;\nG150 acoustic emission sensor: center frequency 150KHz, working frequency domain: 60~400KHz;\nWG50 acoustic emission sensor: frequency domain range: 50~800KHz;\nPAI preamplifier: working frequency domain: 20~1200KHz, 40dB (100 times) amplification\n \n\n\n\n\n\n\n\nFigure 2 Schematic diagram of installation with a single steel wire breakage\n3.1.2. Parameter configuration and installation\n The industry generally believes that the frequency domain of carbon steel crack signals is mainly distributed in the range of 100-300kHz. However, due to the influence of the size structure of the test object and the sound wave transmission path, its frequency domain characteristics may change. Therefore, a narrow-band sensor suitable for metal crack detection and a wide-band sensor convenient for frequency domain analysis are selected in the sensor frequency domain, and corresponding considerations are made on the installation position.\nTable 1 Sensor installation location and AE parameter configuration\nSensor No.\tmodel\tLocation\tFilter band\nS1\tG150\tThe distance from the fixed point 1 is 500mm; the distance from the pre-breaking point is 1800mm\t100kHz—400kHz\nS2\tG150\t300mm from the fracture position\t100kHz—400kHz\nS3\tG150\t13500mm from the fracture position\t100kHz—400kHz\nS7\tWG50\tDistance from fracture position 5300mm\t20kHz—1200kHz\nS8\tWG50\t300mm from the fracture position\t20kHz—1200kHz\nGeneral acoustic emission configuration:\nsampling rate = 3000kHz, threshold = 40db, HDT = 2000us, PDT = 1000us, HLT = 20000us\n3.1.3 Attenuation\nThe 150K resonant sensor S2 and the broadband sensor S8 installed close to each other were used as the acquisition channels, and the signal attenuation of a single steel wire was tested by breaking a lead core with a diameter of 0.5 and a hardness of HB as a simulation source. In order to simulate the attenuation characteristics of the acoustic emission signal on the steel wire under actual working conditions, the steel wire was pre-tightened by a manual hoist, and then the lead breaking test was performed at different positions of the steel wire. The on-site and data results are as follows:\n\n\nFigure 3: Steel wire breaking test site\nTable 2 Attenuation test results\n Distance/m\nMeasurement value/dB\t0\t0.1\t0.5\t1.0\t2.0\t3.0\t5.0\t7.0\t9.0\t11\t14\nS2 (150K resonance)\t100\t92\t86\t79\t80\t79\t72\t69\t64\t59\t45\nS8 (Broadband)\t99\t90\t82\t77\t73\t67\t62\t60\t55\t46\t/\n3.1.4 Test results\nA total of 4 pull-off tests were conducted during the experiment. The first test was for a new steel wire with prefabricated slot defects. After the fracture was lap-welded, the gap was prefabricated again and repeated. Because the steel wire fracture was welded multiple times and the fixed point structure was disassembled and installed multiple times, the subsequent 3 pull-offs not only verified the types of broken wire acoustic emission characteristic parameters, but also generated some interference source signals. Under the condition of attenuation of the broken lead signal test, the resonant narrowband sensor has a longer receiving distance and its frequency response range is more targeted at the metal crack characteristics, so the reference 150kHz sensor is selected as the type of judgment parameter. In order to obtain the frequency characteristics of the steel wire breakage and avoid the misjudgment of the signal frequency band distribution caused by the resonant sensor resonance point, the sensor selected for frequency domain processing is a broadband sensor.\n\nFigure 4 AE parameter history diagram of the new steel wire breaking process\n \n\nThe broadband sensor receives the time domain signal before the fracture\n \t\nThe broadband sensor receives the frequency domain signal before the fracture\n\nAt the moment of fracture, the broadband sensor receives the time domain signal\n \t\nAt the moment of fracture, the broadband sensor receives the frequency domain signal\nFig.5 Time domain and frequency domain characteristics of the new steel wire breaking process\n\n\n\n\n\nFig.6 AE parameter history diagram of the first breaking process after weldingFig.7\n\nAE parameter history diagram of the second breaking process after welding\n\nTime Domain\t\nFrequency Domain\nFigure 8 Crack signal at welding position\n \n \nTime Domain\t\nFrequency Domain\nFigure 9: Signal of wire sliding within the fixed point\n3.1.4 Summary of this paragraph\n 1. The accumulated values of amplitude, energy and ringing count in the acoustic emission characteristic parameters can be consistent with the moment of wire breakage, and the above three can be used to determine wire breakage;\n 2. In the acoustic emission amplitude history diagram, the value displayed at the moment of wire breakage is 100dB, and the actual intensity is very likely to be greater than this value. This assumption can be confirmed in papers published by others;\n 3. The acoustic emission signal of wire breakage is a relatively broadband signal. The near-point frequency of a single steel wire is mainly distributed between 50kHz and 200kHz, but as the distance between the breakpoint and the sensor increases, the high-frequency component will decrease accordingly. (This experiment was conducted in 2015. The resonant frequency range of the cable wire monitoring sensor should be within the range of 100kHz to 400kHz, which has been revised to 50-100kHz in the 2022 version.)\n 4. The FFT spectrum peak of the sliding signal of the steel wire in the fixed point is displayed at 50kHz, which can be regarded as the friction signal between multiple strands of steel wire under the actual sling force to a certain extent.\n4 Real bridge cable attenuation test\nBased on the test results of the single steel wire in the upper part and the theoretical basis of the short propagation distance of high-frequency signals, a sensor with a resonant frequency of 40kHz and a frequency domain range of 15 to 70kH was selected to perform the acoustic emission signal attenuation test of the real bridge cable. The real bridge is located near the current Zhengzhou East Station. The side span main cable was selected for the test. Its structural situation is shown in the following schematic diagram:\n\nFigure 10 Schematic diagram of the side span of Chaohe Bridge\n4.1 Signal attenuation of the anti-corrosion layer\nThe SR40M (15-75kHz) sensor is placed on the upper half of the first lock clamp structure. The lead break signal is given at two locations 10 cm away from the sensor. The lead is broken 5 times at each location. The 3 maximum amplitudes are taken to calculate the average value. The positions are defined as P1 and P2. P1 is on the lock clamp and P2 is on the anti-corrosion layer outside the main cable.\nTable 3 Anti-corrosion layer attenuation data\n Position\nmeasurement value dB\tP1 Position\tP2 Position\t\nfirst\t91\t76\nSecond time\t89\t75\nThe third time\t88\t77\naverage value\t89\t76 \n4.2 Signal attenuation of the lock clamp structure\nThe sensor is fixed on the upper half of the lock clamp, and the lead-breaking signal is given at the typical position of the lock clamp to preliminarily measure the influence of the lock clamp structure on the acoustic emission signal\nTable 4 Lock clamp structure attenuation data\nLead break position number\tMeasuring amplitude\t\nP1\t90 dB\nP2\t87 dB\nP3\t80 dB\nP4\t73 dB\nP5\t68 dB\n4.3 Propagation distance test\nThe sensor is installed on the anchor lock clamp (first lock clamp) at the bridge head for static noise collection. At that time, the test bridge was completed but not open to traffic, and the paint layer must not be damaged. The noise signal was less than 32dB. Since the catwalk will be climbed later to manually knock to give a simulated signal, the threshold is set to 40dB. Due to the attenuation effect caused by the anti-corrosion layer and paint, the lead break signal is not enough to be received by the distant sensor. Instead, the screwdriver knocks the lock clamp as the simulated source signal. The screwdriver knocks with moderate force to ensure that the knocking signal strength is lower than the signal strength at the moment of a single steel wire breaking and does not cause damage to the paint layer. The knocking position is each lock clamp, namely the first, second, third, fourth, fifth, sixth, and seventh lock clamps. Except for the first and second lock clamps at the bridge head, which are 7 meters apart horizontally, the remaining lock clamps are 5 meters apart.\n\n\n\nFigure 10: Location of the striking point\nThe blade end of the screwdriver is downward, and the free fall of 50cm to the upper surface of the lock clamp is used as an artificial simulation source. Each lock clamp position is free-falling 5 times, and the three maximum amplitudes before each lock clamp are recorded to calculate the measurement value. The data list is as follows:\n \nTable 5 Propagation distance range list\nPosition\n \namplitude dB\tLock clip 1\tLock Clip 2\tLock clip 3\tLock clip 4\tLock clip 5\tLock clip 6\tLock clip 7\nfirst\t100\t78\t55\t52\t43\t43\t/\nSecond time\t100\t80\t53\t56\t41\t45\t/\nThe third time\t100\t87\t53\t50\t47\t41\t/\naverage value\t100\t82\t54\t53\t44\t43\t/\n4.4 Summary of this paragraph\n1. The anti-corrosion layer of the main cable is relatively thick, and the paint layer has a signal attenuation of about 10dB, and the wrapped anti-corrosion structure has a signal attenuation of 25dB;\n2. The lock clamp structure of the unserviced bridge has a large attenuation for the acoustic signal, and each additional level of structure attenuation is about 7dB;\n3. The knocking signal provided by the 50cm free fall of the screwdriver can be received by the sensor 27 meters away.\n5 Noise level test\nAcoustic emission technology is a passive receiving method, and there must be external excitation to make the defects \"move\" before they can be identified. For bridge cables, the main excitation is the quality of the box girder and road pavement, the weight and resonance of vehicles passing by; the main noise sources come from vehicles passing by, wind noise and whistles, rain, snow and hail weather, etc. The usual treatment method is to exclude noise except broken wire signals by setting a threshold value. Combined with the single steel wire breaking and structural attenuation test data, the instantaneous acoustic emission of the broken wire is characterized by high amplitude, high energy and high ringing count, and can be transmitted over a certain distance. It is feasible to do noise testing to determine whether it is feasible to only set a threshold.\nBy installing the same signal sensors on the root structure and locking clamp of a short cable of about 3 meters in length on a suspension bridge, the response of different positions to the same signal was tested. The data showed that the noise level of the sensor installed on the locking clamp of the 3-meter-long cable was less than 45dB when a vehicle passed by, the signal level received at the bottom of the cable was less than 60dB, and the signal frequency domain distribution was less than 30kHz.\n\nTable 6 Noise test\n \tSling Locking Clamp\tSling root\nSensor location diagram\t\t\nThreshold\t40dB\t40dB\nPassenger car\tAmplitude: None\tAmplitude: 45dB\n\t\n \t\nLarge Trucks\tAmplitude: 44dB\tAmplitude: 60dB\n\t\n\t\n \n6 Broken wire monitoring of suspension bridge suspenders\n6.1 Brief description of instrument configuration\nThe RAEM1 type broken wire intelligent acoustic wave monitoring system independently developed and produced by Qingcheng Acoustic Emission Research (Guangzhou) Co., Ltd. is selected. This product is an intelligent Internet of Things acoustic wave monitoring system that integrates signal acquisition control, analysis, storage and communication. The site no longer relies on computers based on the Windows operating platform. It has the function of automatic restart when power is off, and can perform unattended automatic data acquisition, storage, analysis and output 24 hours a day. It can be used as a detection instrument, and in-depth analysis can be performed through acoustic emission waveforms and characteristic parameter data. The data can also be uploaded to the designated cloud server as required for function display and alarm rating. On the Qingcheng self-built cloud platform, parameter configuration can be remotely realized, and the real-time and historical change trend charts of acoustic emission data can be viewed. According to the requirements of \"JT/T 1037-2022 Highway Bridge Structure Monitoring Technical Specifications\", the broken wire alarm conditions and parameter configuration are set. It is a dedicated monitoring of broken wires of suspension bridge suspenders, main cables, cable-stayed bridge cable, and arch bridge suspender (cable) tie rods; its specific functions and parameters of software and hardware are as follows:\nSensor\n★ Targeted fitting design\n★ Center frequency: 50KHz\n★ Frequency range: 40KHz-100KHz;\n★ Operating temperature range: -30℃~70℃;\n★ Meets the requirements of JT/T 1037-2022 standard;\t \n\nFigure 11 Broken wire sensor\n \n \nCollector\n★ Independent channel, sampling rate 2M, sampling accuracy 16 bits;\n★ Signal input bandwidth 10K-1000KHz;\n★ Noise ASL better than 30dB, dynamic range 70dB;\n★ Data type: original waveform or filtered waveform, characteristic parameters;\n★ Acoustic emission impact parameter data, including arrival time, amplitude, ringing count, energy, rise time, duration, RMS, ASL, energy;\n★ Built-in 64G data storage card, which can store the above 3 types of data;\n★ Communication method: 4G Internet of Things and WAN port\n★ Power supply: external power supply, DC 12V;\n★ Working environment temperature -20℃--+60℃;\n★ Dimensions φ50X120mm/220X130X80mm\n★ The module comes with magnetic\t\n\nFigure 12 Broken wire intelligent monitoring system\n \nCloud platform function interface\n \n(a) Remote configuration of collection parameters on the cloud\t \n(b) Wire break alarm setting\n \n(c) Cloud real-time parameters/historical parameters time history diagram\t \n(d) Real-time/historical waveforms on the cloud\n \n(e) Setting the wire break rate function in the cloud\t \n(f) Number and rate of broken wires in the cloud\n \nFigure 11 Qingcheng Cloud Platform Bridge Broken Wire Monitoring System Function\n \n6.2 Pre-installation test\nCombined with the visual window installed after the partial demolition of the anti-corrosion layer on site, it was found that some steel wires had been corroded and broken, so the acoustic emission sensor was installed at a certain height above the window to conduct noise testing and simulate broken wire signal identification. The period with large traffic volume was selected as the test window to collect noise signals as much as possible. The sampling mode of the collector was set to threshold trigger, and the threshold was set to 70dB. During the debugging stage, because there was no mains power supply on site, a 12V lithium battery pack was used to power the collector. The acoustic emission timing parameters were configured and data was viewed on the \"Qingcheng Cloud Platform\" through 4G communication.\n\nFigure 13 Broken wire monitoring test site\n \nThe data of static noise and artificial steel block impact simulation wire breaking were collected for about 40 minutes. The trend chart of acoustic emission parameters was checked on the \"Qingcheng Cloud Platform\". It was found that the noise level could be controlled within 80dB during the period when no artificial impact signal was applied. The 6 signals of 2 sets of steel blocks hitting the root of the rigging had a good correspondence in \"amplitude\", \"energy\" and \"RMS\". (4 consecutive hits at 12:46; 2 consecutive hits at 12:48).\n\nFigure 14 Amplitude history diagram\n \n\nFigure 15 Energy history diagram\n \n\nFigure 16 RMS process diagram\n \n6.3 System Hardware Installation\nThe basic cause of cable wire breakage is the damage of the anti-corrosion layer at the root, which leads to material corrosion and hard damage in the installation link. In the long run, when the load suddenly increases, the stress cannot be released evenly, and the weak steel wire releases energy in the form of instantaneous breaking. The acoustic emission amplitude generated at the moment of release is greater than or close to 100dB. According to the previous signal attenuation test, the anti-corrosion layer or PE sheath attenuates the signal by about 25dB. When the sensor is installed close to the broken wire, the acoustic emission signal is likely to have an amplitude of 100dB.\nThe anti-corrosion layer or PE sheath can be used as an attenuation medium to attenuate large signals or eliminate background noise signals; adjusting the installation height and structural position of the sensor on the cable can reduce the impact of the bridge deck noise source to a certain extent. Both long-term monitoring of acoustic emission and short-term detection of traditional applications require the investigation and elimination of front-end noise. Acoustic emission sensors are generally installed in contact, and the sensitive end face is generally a white protective sheet or curved surface. However, knocking or hitting the sensor housing will also cause the signal to exceed the threshold and be recorded. When monitoring the acoustic emission of broken wires in bridge cables, it is necessary to protect the sensor housing and cables within a certain range to ensure that external factors such as hail, sand and gravel do not trigger the threshold.\nAfter determining the installation position and height of the sensor, glue is used as a coupling agent and fixing method. During the installation process, try to avoid the presence of particles and concave and convex surfaces. Then, the sensor is tied to the cable with a metal tie. The best effect is to see a certain amount of uniform extrusion on the edge. After the sensor is fixed and connected to the coaxial cable, the sensor sheath needs to be installed. Its significance is to prevent the sensor from receiving external mechanical shock. The basic requirement is that it is installed securely and does not age for a long time. The installation and placement of the collector is still based on the current data security considerations in the industry. The main focus is to first form a local area network and then a single point to the outside. The requirement for the acoustic emission collector is that it must have a LAN port or WIfi networking function.\n\n\t\n![Uploading image #16...]()\n\n\n\t\nFigure 17 On-site installation diagram of broken wire monitoring system\n6.4 Broken wire judgment\nFor the monitoring of the fracture of a single steel wire inside the cable, the threshold trigger is used as the sampling method. While shielding the noise, the threshold must also ensure that the signal of the broken wire can be captured. The trigger threshold can be set to 70dB or 80dB for the monitoring of broken wires in long highway bridges. When the signal triggers the threshold, the energy, ringing count and RMS in the characteristic parameters are used to make a comprehensive judgment. Under relatively ideal working conditions, one or two of them can be used to judge the broken wire. For example, high amplitude, high energy, and high count are the main forms of characterizing fracture. When the noise of the on-site working conditions is large, the 80dB threshold cannot effectively shield the noise. You can first try to reduce the hardware amplifier multiple to increase the dynamic range of the system. At present, the maximum input voltage range of acoustic emission instruments and general data acquisition cards is generally ±10V. When the commonly used 40dB amplifier is selected, the signal at the moment of the broken wire will be limited and the amplitude difference with the noise cannot be widened. However, while reducing the gain, the signal-to-noise ratio of the signal is also reduced, and the transmission distance is also reduced. When it is impossible to effectively distinguish the broken wire signal by increasing the dynamic range, the amplitude should not be increased blindly. Energy, count, and RMS values can be used to assist in the judgment. If necessary, the proportional correspondence of \"amplitude-ASL\", \"ring count-rise count\", \"duration-rise time\" and so on can be added.\n7 Summary\n1. The break of a single steel wire in the cable is a representation of high amplitude, high energy, and high ring count in the acoustic emission signal;\n2. The process can be displayed by the amplitude, energy, ring count, and RMS time history diagram;\n3. The amplitude intensity of the acoustic emission signal at the moment of single steel wire breakage is greater than 100dB; for the monitoring of broken wires at key locations, the trigger threshold can be set to 70 or 80dB;\n4. The anti-corrosion layer and the sheath are materials that attenuate the sound height by about 25dB. By changing the installation position of the sensor, the road noise source can be avoided to a certain extent;\n5. The sound attenuation between the lock clamp and the anchor structure is large, and the attenuation is about 7dB for each structural member;\n6. The signal of a 50cm screwdriver falling freely at 27 meters from the main cable of a newly built but unused bridge to the paint layer can be received by the acoustic emission system as 43dB;\n8 Outlook\n1. What is the real acoustic emission signal characterizing the specific situation of cable breakage in an in-service bridge? It is impossible to simulate, and there is currently no literature or experience to refer to;\n2. There is no universal criterion for determining cable breakage based on acoustic emission, and specific problems must be analyzed specifically;\n3. Acoustic emission researchers cannot have in-depth access to data due to industry closure or data security;\n4. Bridge structure health monitoring is an integration of multiple means, and the integration of acoustic emission technology and other means is carried out throughout;\n5. There is no practical support for the effective monitoring distance of acoustic emission technology for cables of different specifications. How to evolve it?\n6. The authenticity of the location and number of cable breakage cannot be determined by acoustic emission alone.\n\nReferences\n[1] Ministry of Transport of the People's Republic of China. \"JT/T 1037-2022 Technical Specifications for Highway Bridge Structure Inspection\". 2022\n\n\n\n\n\n\n\n\n\n\n\n\n",
"json_metadata": "{\"tags\":[\"bridge\"],\"image\":[\"https://cdn.steemitimages.com/DQmVZTPZVGhWMHz4rzDDic5jzHAzrNy1Vvoo18QX8Y9BjUw/bridge-cable-acoustic-emission-system1.jpg\",\"https://cdn.steemitimages.com/DQmdPnVuoNZTZyMgbbxjR2U2j4fwBnfUduzCx2ACAnKcnhR/bridge-cable-acoustic-emission-system1.png\",\"https://cdn.steemitimages.com/DQmTqfqtcbfj6khhH89RJ2k1GaGmtWQeq9r3Ykktgmeufpr/bridge-cable-acoustic-emission-system2.jpg\",\"https://cdn.steemitimages.com/DQmUcCCjVZyWmRosVnY4TJSJdHarphTEGYn6pvvUHHcLwjo/bridge-cable-acoustic-emission-system2.png\",\"https://cdn.steemitimages.com/DQmTUQqx292gLqMiHgArtriEcELMVYmQPFYd1yrgT48yzFk/bridge-cable-acoustic-emission-system3.jpg\",\"https://cdn.steemitimages.com/DQmZh1vZ5Ryc5Nn8bomhtMk9xrTGJZFcfr5jzZeeAa7mxae/bridge-cable-acoustic-emission-system18.png\",\"https://cdn.steemitimages.com/DQmauJYYGhYVyNKiZDGa2n8KcrYn9RaLzFrMicfFXr2Haq6/bridge-cable-acoustic-emission-system19.png\",\"https://cdn.steemitimages.com/DQmcckGE9f8MZ79zW524LEGsQcm5NGmi3v2V1g2MfisWHPd/bridge-cable-acoustic-emission-system36.png\",\"https://cdn.steemitimages.com/DQmSgDm9QJHVnbmgojWTqzgNNGh41m6gao5sZZTKS2hkxph/bridge-cable-acoustic-emission-system38.png\",\"https://cdn.steemitimages.com/DQmby8nCRe9BFb8VS8AJFzBKDLaZawG4uBpHZ3mogMRKB7X/bridge-cable-acoustic-emission-system3.png\",\"https://cdn.steemitimages.com/DQmcVn5iCNHwMqwHhiff5TCTe89WMf1urq5WAK6JMiuw3xj/bridge-cable-acoustic-emission-system4.png\",\"https://cdn.steemitimages.com/DQmREiyeUqJGZrrbanw2R4WwtfUjK2XuJpGZRVCuwWW4uKV/bridge-cable-acoustic-emission-system5.png\",\"https://cdn.steemitimages.com/DQmdrSK1rj13e4nzRkfJtyRxT4PDbEYvTJetteoSzfgqNYJ/bridge-cable-acoustic-emission-system6.png\",\"https://cdn.steemitimages.com/DQmNzQZSPNpi1yPxcsiFzkNuh7RJ2ZL9993GotQ8vM7gWHW/bridge-cable-acoustic-emission-system7.png\",\"https://cdn.steemitimages.com/DQmaLpNrvEKDk26CMwCM4websMZccvUCsjycem31BgrEmv4/bridge-cable-acoustic-emission-system32%20-%20%E5%89%AF%E6%9C%AC.png\",\"https://cdn.steemitimages.com/DQmaLpNrvEKDk26CMwCM4websMZccvUCsjycem31BgrEmv4/bridge-cable-acoustic-emission-system32.png\"],\"app\":\"steemit/0.2\",\"format\":\"markdown\"}",
"parent_author": "",
"parent_permlink": "bridge",
"permlink": "application-and-improvement-of-bridge-cable-broken-wire-acoustic-emission-monitoring-system",
"title": "Application and improvement of bridge cable broken wire acoustic emission monitoring system"
}
],
"op_in_trx": 0,
"timestamp": "2024-08-11T08:57:36",
"trx_id": "40ea84bcc3f433b6bd5f372b544fd982625d1ec1",
"trx_in_block": 5,
"virtual_op": 0
}2024/08/10 09:48:39
2024/08/10 09:48:39
| author | barrylee |
| permlink | distributed-wireless-acoustic-emission-system-and-its-application-based-on-gps-wifi-high-precision-wireless-synchronous-clock |
| voter | bluesniper |
| weight | 10000 (100.00%) |
| Transaction Info | Block #87603205/Trx 4b09bbc6ebdcb124468e26a6a381e3eb8a0dcecb |
View Raw JSON Data
{
  "block": 87603205,
  "op": [
    "vote",
    {
      "author": "barrylee",
      "permlink": "distributed-wireless-acoustic-emission-system-and-its-application-based-on-gps-wifi-high-precision-wireless-synchronous-clock",
      "voter": "bluesniper",
      "weight": 10000
    }
  ],
  "op_in_trx": 0,
  "timestamp": "2024-08-10T09:48:39",
  "trx_id": "4b09bbc6ebdcb124468e26a6a381e3eb8a0dcecb",
  "trx_in_block": 3,
  "virtual_op": 0
}2024/08/10 09:48:06
2024/08/10 09:48:06
| author | barrylee |
| body | @@ -23726,172 +23726,1014 @@ .%0A!%5B -Uploading image #8...%5D()%0A%0A!%5BUploading image #9...%5D()%0A%0A!%5BUploading image #10...%5D()%0A%0A!%5BUploading image #11...%5D()%0A%0A!%5BUploading image #12...%5D()%0A%0A!%5BUploading image #13...%5D( +distributed-acoustic-emission-system10.png%5D(https://cdn.steemitimages.com/DQmQ5v2aUDMgCgndGoS15uk1T1zXgaswVeBnLH6CxHifioA/distributed-acoustic-emission-system10.png)%0A%0A!%5Bdistributed-acoustic-emission-system11.png%5D(https://cdn.steemitimages.com/DQmduXWcVvvXUFa2yJE8sVjtakLVTuXipy93QUCYEvzTxJ9/distributed-acoustic-emission-system11.png)%0A%0A!%5Bdistributed-acoustic-emission-system12.png%5D(https://cdn.steemitimages.com/DQmWs7v8aqs1kZbUGWYfJwQYv6ybMuwvpN6yqC466mdcB5k/distributed-acoustic-emission-system12.png)%0A%0A!%5Bdistributed-acoustic-emission-system13.png%5D(https://cdn.steemitimages.com/DQmdAjnBUGxsjwdPxjJkMkNRLLHFqdSuVHYxaRq89ewaYZC/distributed-acoustic-emission-system13.png)%0A%0A!%5Bdistributed-acoustic-emission-system16.png%5D(https://cdn.steemitimages.com/DQmcKRZYWa3uVeGicBPC68rXSqb4xYUQpRa8PJVcQypU4Gx/distributed-acoustic-emission-system16.png)%0A%0A!%5Bdistributed-acoustic-emission-system17.png%5D(https://cdn.steemitimages.com/DQmVYZx6nqjoDaz96VCDcy1J9qfLwHf1fqTX75oARvaGQxP/distributed-acoustic-emission-system17.png ) |
| json metadata | {"app":"steemit/0.2","format":"markdown","links":["https://www.aendt.com","https://www.aendt.com/products/multichannel-systems/"],"image":["https://cdn.steemitimages.com/DQmdG2ju83PN5KCimaCWXf1DGrCqExVogBBQNi2xfPQQ4VR/distributed-acoustic-emission-system1.png","https://cdn.steemitimages.com/DQmdBToj7XXKkckVbBYneRQH4unVj5DFH84KLBJd3soMRcu/distributed-acoustic-emission-system2.png","https://cdn.steemitimages.com/DQmWaKwVU7sAaQdhTQcjPAZfHffa4WrarWfBbA61nFJ62B9/distributed-acoustic-emission-system4.png","https://cdn.steemitimages.com/DQmXx8sW9RiegK1567LtG4PoXNahk3ESfH2Ye6DL9KPn1jw/distributed-acoustic-emission-system5.png","https://cdn.steemitimages.com/DQmT8Rq6YCju2X1AyNZeW3jQkTX62yAoMEFPSBNjnKUc92N/distributed-acoustic-emission-system6.png","https://cdn.steemitimages.com/DQmdu4yaD69jo6DZu6C51jcJs7a3fGyKfw7M1cUepejo3mh/distributed-acoustic-emission-system7.png","https://cdn.steemitimages.com/DQmNvBBbaMm6ngQM23zyh7ySApUARiDhifAjGVX5LpXqcUa/distributed-acoustic-emission-system8.png","https://cdn.steemitimages.com/DQmQ5v2aUDMgCgndGoS15uk1T1zXgaswVeBnLH6CxHifioA/distributed-acoustic-emission-system10.png","https://cdn.steemitimages.com/DQmduXWcVvvXUFa2yJE8sVjtakLVTuXipy93QUCYEvzTxJ9/distributed-acoustic-emission-system11.png","https://cdn.steemitimages.com/DQmWs7v8aqs1kZbUGWYfJwQYv6ybMuwvpN6yqC466mdcB5k/distributed-acoustic-emission-system12.png","https://cdn.steemitimages.com/DQmdAjnBUGxsjwdPxjJkMkNRLLHFqdSuVHYxaRq89ewaYZC/distributed-acoustic-emission-system13.png","https://cdn.steemitimages.com/DQmcKRZYWa3uVeGicBPC68rXSqb4xYUQpRa8PJVcQypU4Gx/distributed-acoustic-emission-system16.png","https://cdn.steemitimages.com/DQmVYZx6nqjoDaz96VCDcy1J9qfLwHf1fqTX75oARvaGQxP/distributed-acoustic-emission-system17.png"]} |
| parent author | |
| parent permlink | ae |
| permlink | distributed-wireless-acoustic-emission-system-and-its-application-based-on-gps-wifi-high-precision-wireless-synchronous-clock |
| title | Distributed wireless acoustic emission system and its application based on GPS/Wifi high-precision wireless synchronous clock |
| Transaction Info | Block #87603194/Trx 0b722e005f37c5e9aaefcd36e9343d861ca76ed8 |
View Raw JSON Data
{
  "block": 87603194,
  "op": [
    "comment",
    {
      "author": "barrylee",
      "body": "@@ -23726,172 +23726,1014 @@\n .%0A!%5B\n-Uploading image #8...%5D()%0A%0A!%5BUploading image #9...%5D()%0A%0A!%5BUploading image #10...%5D()%0A%0A!%5BUploading image #11...%5D()%0A%0A!%5BUploading image #12...%5D()%0A%0A!%5BUploading image #13...%5D(\n+distributed-acoustic-emission-system10.png%5D(https://cdn.steemitimages.com/DQmQ5v2aUDMgCgndGoS15uk1T1zXgaswVeBnLH6CxHifioA/distributed-acoustic-emission-system10.png)%0A%0A!%5Bdistributed-acoustic-emission-system11.png%5D(https://cdn.steemitimages.com/DQmduXWcVvvXUFa2yJE8sVjtakLVTuXipy93QUCYEvzTxJ9/distributed-acoustic-emission-system11.png)%0A%0A!%5Bdistributed-acoustic-emission-system12.png%5D(https://cdn.steemitimages.com/DQmWs7v8aqs1kZbUGWYfJwQYv6ybMuwvpN6yqC466mdcB5k/distributed-acoustic-emission-system12.png)%0A%0A!%5Bdistributed-acoustic-emission-system13.png%5D(https://cdn.steemitimages.com/DQmdAjnBUGxsjwdPxjJkMkNRLLHFqdSuVHYxaRq89ewaYZC/distributed-acoustic-emission-system13.png)%0A%0A!%5Bdistributed-acoustic-emission-system16.png%5D(https://cdn.steemitimages.com/DQmcKRZYWa3uVeGicBPC68rXSqb4xYUQpRa8PJVcQypU4Gx/distributed-acoustic-emission-system16.png)%0A%0A!%5Bdistributed-acoustic-emission-system17.png%5D(https://cdn.steemitimages.com/DQmVYZx6nqjoDaz96VCDcy1J9qfLwHf1fqTX75oARvaGQxP/distributed-acoustic-emission-system17.png\n )\n",
      "json_metadata": "{\"app\":\"steemit/0.2\",\"format\":\"markdown\",\"links\":[\"https://www.aendt.com\",\"https://www.aendt.com/products/multichannel-systems/\"],\"image\":[\"https://cdn.steemitimages.com/DQmdG2ju83PN5KCimaCWXf1DGrCqExVogBBQNi2xfPQQ4VR/distributed-acoustic-emission-system1.png\",\"https://cdn.steemitimages.com/DQmdBToj7XXKkckVbBYneRQH4unVj5DFH84KLBJd3soMRcu/distributed-acoustic-emission-system2.png\",\"https://cdn.steemitimages.com/DQmWaKwVU7sAaQdhTQcjPAZfHffa4WrarWfBbA61nFJ62B9/distributed-acoustic-emission-system4.png\",\"https://cdn.steemitimages.com/DQmXx8sW9RiegK1567LtG4PoXNahk3ESfH2Ye6DL9KPn1jw/distributed-acoustic-emission-system5.png\",\"https://cdn.steemitimages.com/DQmT8Rq6YCju2X1AyNZeW3jQkTX62yAoMEFPSBNjnKUc92N/distributed-acoustic-emission-system6.png\",\"https://cdn.steemitimages.com/DQmdu4yaD69jo6DZu6C51jcJs7a3fGyKfw7M1cUepejo3mh/distributed-acoustic-emission-system7.png\",\"https://cdn.steemitimages.com/DQmNvBBbaMm6ngQM23zyh7ySApUARiDhifAjGVX5LpXqcUa/distributed-acoustic-emission-system8.png\",\"https://cdn.steemitimages.com/DQmQ5v2aUDMgCgndGoS15uk1T1zXgaswVeBnLH6CxHifioA/distributed-acoustic-emission-system10.png\",\"https://cdn.steemitimages.com/DQmduXWcVvvXUFa2yJE8sVjtakLVTuXipy93QUCYEvzTxJ9/distributed-acoustic-emission-system11.png\",\"https://cdn.steemitimages.com/DQmWs7v8aqs1kZbUGWYfJwQYv6ybMuwvpN6yqC466mdcB5k/distributed-acoustic-emission-system12.png\",\"https://cdn.steemitimages.com/DQmdAjnBUGxsjwdPxjJkMkNRLLHFqdSuVHYxaRq89ewaYZC/distributed-acoustic-emission-system13.png\",\"https://cdn.steemitimages.com/DQmcKRZYWa3uVeGicBPC68rXSqb4xYUQpRa8PJVcQypU4Gx/distributed-acoustic-emission-system16.png\",\"https://cdn.steemitimages.com/DQmVYZx6nqjoDaz96VCDcy1J9qfLwHf1fqTX75oARvaGQxP/distributed-acoustic-emission-system17.png\"]}",
      "parent_author": "",
      "parent_permlink": "ae",
      "permlink": "distributed-wireless-acoustic-emission-system-and-its-application-based-on-gps-wifi-high-precision-wireless-synchronous-clock",
      "title": "Distributed wireless acoustic emission system and its application based on GPS/Wifi high-precision wireless synchronous clock"
    }
  ],
  "op_in_trx": 0,
  "timestamp": "2024-08-10T09:48:06",
  "trx_id": "0b722e005f37c5e9aaefcd36e9343d861ca76ed8",
  "trx_in_block": 0,
  "virtual_op": 0
}2024/08/10 09:47:30
2024/08/10 09:47:30
| author | barrylee |
| body | @@ -1920,16 +1920,350 @@ area.%0A%0A +!%5Bdistributed-acoustic-emission-system1.png%5D(https://cdn.steemitimages.com/DQmdG2ju83PN5KCimaCWXf1DGrCqExVogBBQNi2xfPQQ4VR/distributed-acoustic-emission-system1.png)%0A%0A!%5Bdistributed-acoustic-emission-system2.png%5D(https://cdn.steemitimages.com/DQmdBToj7XXKkckVbBYneRQH4unVj5DFH84KLBJd3soMRcu/distributed-acoustic-emission-system2.png)%0A%0A 2 Backgr @@ -3714,16 +3714,852 @@ ited.%0A %0A +%0A!%5Bdistributed-acoustic-emission-system4.png%5D(https://cdn.steemitimages.com/DQmWaKwVU7sAaQdhTQcjPAZfHffa4WrarWfBbA61nFJ62B9/distributed-acoustic-emission-system4.png)%0A%0A!%5Bdistributed-acoustic-emission-system5.png%5D(https://cdn.steemitimages.com/DQmXx8sW9RiegK1567LtG4PoXNahk3ESfH2Ye6DL9KPn1jw/distributed-acoustic-emission-system5.png)%0A%0A!%5Bdistributed-acoustic-emission-system6.png%5D(https://cdn.steemitimages.com/DQmT8Rq6YCju2X1AyNZeW3jQkTX62yAoMEFPSBNjnKUc92N/distributed-acoustic-emission-system6.png)%0A%0A!%5Bdistributed-acoustic-emission-system7.png%5D(https://cdn.steemitimages.com/DQmdu4yaD69jo6DZu6C51jcJs7a3fGyKfw7M1cUepejo3mh/distributed-acoustic-emission-system7.png)%0A%0A!%5Bdistributed-acoustic-emission-system8.png%5D(https://cdn.steemitimages.com/DQmNvBBbaMm6ngQM23zyh7ySApUARiDhifAjGVX5LpXqcUa/distributed-acoustic-emission-system8.png)%0A%0A 2.2 Wire @@ -8514,16 +8514,17 @@ sy use.%0A +%0A Qingchen @@ -23703,24 +23703,195 @@ tioning can be realized. +%0A!%5BUploading image #8...%5D()%0A%0A!%5BUploading image #9...%5D()%0A%0A!%5BUploading image #10...%5D()%0A%0A!%5BUploading image #11...%5D()%0A%0A!%5BUploading image #12...%5D()%0A%0A!%5BUploading image #13...%5D() |
| json metadata | {"app":"steemit/0.2","format":"markdown","links":["https://www.aendt.com","https://www.aendt.com/products/multichannel-systems/"],"image":["https://cdn.steemitimages.com/DQmdG2ju83PN5KCimaCWXf1DGrCqExVogBBQNi2xfPQQ4VR/distributed-acoustic-emission-system1.png","https://cdn.steemitimages.com/DQmdBToj7XXKkckVbBYneRQH4unVj5DFH84KLBJd3soMRcu/distributed-acoustic-emission-system2.png","https://cdn.steemitimages.com/DQmWaKwVU7sAaQdhTQcjPAZfHffa4WrarWfBbA61nFJ62B9/distributed-acoustic-emission-system4.png","https://cdn.steemitimages.com/DQmXx8sW9RiegK1567LtG4PoXNahk3ESfH2Ye6DL9KPn1jw/distributed-acoustic-emission-system5.png","https://cdn.steemitimages.com/DQmT8Rq6YCju2X1AyNZeW3jQkTX62yAoMEFPSBNjnKUc92N/distributed-acoustic-emission-system6.png","https://cdn.steemitimages.com/DQmdu4yaD69jo6DZu6C51jcJs7a3fGyKfw7M1cUepejo3mh/distributed-acoustic-emission-system7.png","https://cdn.steemitimages.com/DQmNvBBbaMm6ngQM23zyh7ySApUARiDhifAjGVX5LpXqcUa/distributed-acoustic-emission-system8.png"]} |
| parent author | |
| parent permlink | ae |
| permlink | distributed-wireless-acoustic-emission-system-and-its-application-based-on-gps-wifi-high-precision-wireless-synchronous-clock |
| title | Distributed wireless acoustic emission system and its application based on GPS/Wifi high-precision wireless synchronous clock |
| Transaction Info | Block #87603182/Trx 53a82e44a29aba751230179e09bafd6b2bb3b0fb |
View Raw JSON Data
{
  "block": 87603182,
  "op": [
    "comment",
    {
      "author": "barrylee",
      "body": "@@ -1920,16 +1920,350 @@\n  area.%0A%0A\n+!%5Bdistributed-acoustic-emission-system1.png%5D(https://cdn.steemitimages.com/DQmdG2ju83PN5KCimaCWXf1DGrCqExVogBBQNi2xfPQQ4VR/distributed-acoustic-emission-system1.png)%0A%0A!%5Bdistributed-acoustic-emission-system2.png%5D(https://cdn.steemitimages.com/DQmdBToj7XXKkckVbBYneRQH4unVj5DFH84KLBJd3soMRcu/distributed-acoustic-emission-system2.png)%0A%0A\n 2 Backgr\n@@ -3714,16 +3714,852 @@\n ited.%0A %0A\n+%0A!%5Bdistributed-acoustic-emission-system4.png%5D(https://cdn.steemitimages.com/DQmWaKwVU7sAaQdhTQcjPAZfHffa4WrarWfBbA61nFJ62B9/distributed-acoustic-emission-system4.png)%0A%0A!%5Bdistributed-acoustic-emission-system5.png%5D(https://cdn.steemitimages.com/DQmXx8sW9RiegK1567LtG4PoXNahk3ESfH2Ye6DL9KPn1jw/distributed-acoustic-emission-system5.png)%0A%0A!%5Bdistributed-acoustic-emission-system6.png%5D(https://cdn.steemitimages.com/DQmT8Rq6YCju2X1AyNZeW3jQkTX62yAoMEFPSBNjnKUc92N/distributed-acoustic-emission-system6.png)%0A%0A!%5Bdistributed-acoustic-emission-system7.png%5D(https://cdn.steemitimages.com/DQmdu4yaD69jo6DZu6C51jcJs7a3fGyKfw7M1cUepejo3mh/distributed-acoustic-emission-system7.png)%0A%0A!%5Bdistributed-acoustic-emission-system8.png%5D(https://cdn.steemitimages.com/DQmNvBBbaMm6ngQM23zyh7ySApUARiDhifAjGVX5LpXqcUa/distributed-acoustic-emission-system8.png)%0A%0A\n 2.2 Wire\n@@ -8514,16 +8514,17 @@\n sy use.%0A\n+%0A\n Qingchen\n@@ -23703,24 +23703,195 @@\n tioning can be realized.\n+%0A!%5BUploading image #8...%5D()%0A%0A!%5BUploading image #9...%5D()%0A%0A!%5BUploading image #10...%5D()%0A%0A!%5BUploading image #11...%5D()%0A%0A!%5BUploading image #12...%5D()%0A%0A!%5BUploading image #13...%5D()\n",
      "json_metadata": "{\"app\":\"steemit/0.2\",\"format\":\"markdown\",\"links\":[\"https://www.aendt.com\",\"https://www.aendt.com/products/multichannel-systems/\"],\"image\":[\"https://cdn.steemitimages.com/DQmdG2ju83PN5KCimaCWXf1DGrCqExVogBBQNi2xfPQQ4VR/distributed-acoustic-emission-system1.png\",\"https://cdn.steemitimages.com/DQmdBToj7XXKkckVbBYneRQH4unVj5DFH84KLBJd3soMRcu/distributed-acoustic-emission-system2.png\",\"https://cdn.steemitimages.com/DQmWaKwVU7sAaQdhTQcjPAZfHffa4WrarWfBbA61nFJ62B9/distributed-acoustic-emission-system4.png\",\"https://cdn.steemitimages.com/DQmXx8sW9RiegK1567LtG4PoXNahk3ESfH2Ye6DL9KPn1jw/distributed-acoustic-emission-system5.png\",\"https://cdn.steemitimages.com/DQmT8Rq6YCju2X1AyNZeW3jQkTX62yAoMEFPSBNjnKUc92N/distributed-acoustic-emission-system6.png\",\"https://cdn.steemitimages.com/DQmdu4yaD69jo6DZu6C51jcJs7a3fGyKfw7M1cUepejo3mh/distributed-acoustic-emission-system7.png\",\"https://cdn.steemitimages.com/DQmNvBBbaMm6ngQM23zyh7ySApUARiDhifAjGVX5LpXqcUa/distributed-acoustic-emission-system8.png\"]}",
      "parent_author": "",
      "parent_permlink": "ae",
      "permlink": "distributed-wireless-acoustic-emission-system-and-its-application-based-on-gps-wifi-high-precision-wireless-synchronous-clock",
      "title": "Distributed wireless acoustic emission system and its application based on GPS/Wifi high-precision wireless synchronous clock"
    }
  ],
  "op_in_trx": 0,
  "timestamp": "2024-08-10T09:47:30",
  "trx_id": "53a82e44a29aba751230179e09bafd6b2bb3b0fb",
  "trx_in_block": 2,
  "virtual_op": 0
}2024/08/10 09:46:09
2024/08/10 09:46:09
| author | barrylee |
| body | @@ -171,16 +171,48 @@ iu3)%0A1) +%3Ca href=%22https://www.aendt.com%22%3E QingChen @@ -249,16 +249,20 @@ , Ltd., +%3C/a%3E Guangzho @@ -345,16 +345,79 @@ ireless +%3Ca href=%22https://www.aendt.com/products/multichannel-systems/%22%3E Acoustic @@ -432,16 +432,20 @@ n System +%3C/a%3E %22 as the |
| json metadata | {"app":"steemit/0.2","format":"markdown","links":["https://www.aendt.com","https://www.aendt.com/products/multichannel-systems/"]} |
| parent author | |
| parent permlink | ae |
| permlink | distributed-wireless-acoustic-emission-system-and-its-application-based-on-gps-wifi-high-precision-wireless-synchronous-clock |
| title | Distributed wireless acoustic emission system and its application based on GPS/Wifi high-precision wireless synchronous clock |
| Transaction Info | Block #87603155/Trx b1b0c11ff269337ab2becf5a4eaf18688191dad0 |
View Raw JSON Data
{
  "block": 87603155,
  "op": [
    "comment",
    {
      "author": "barrylee",
      "body": "@@ -171,16 +171,48 @@\n iu3)%0A1) \n+%3Ca href=%22https://www.aendt.com%22%3E\n QingChen\n@@ -249,16 +249,20 @@\n , Ltd., \n+%3C/a%3E\n Guangzho\n@@ -345,16 +345,79 @@\n ireless \n+%3Ca href=%22https://www.aendt.com/products/multichannel-systems/%22%3E\n Acoustic\n@@ -432,16 +432,20 @@\n n System\n+%3C/a%3E\n %22 as the\n",
      "json_metadata": "{\"app\":\"steemit/0.2\",\"format\":\"markdown\",\"links\":[\"https://www.aendt.com\",\"https://www.aendt.com/products/multichannel-systems/\"]}",
      "parent_author": "",
      "parent_permlink": "ae",
      "permlink": "distributed-wireless-acoustic-emission-system-and-its-application-based-on-gps-wifi-high-precision-wireless-synchronous-clock",
      "title": "Distributed wireless acoustic emission system and its application based on GPS/Wifi high-precision wireless synchronous clock"
    }
  ],
  "op_in_trx": 0,
  "timestamp": "2024-08-10T09:46:09",
  "trx_id": "b1b0c11ff269337ab2becf5a4eaf18688191dad0",
  "trx_in_block": 0,
  "virtual_op": 0
}2024/08/10 09:42:51
2024/08/10 09:42:51
| author | barrylee |
| body | Distributed wireless acoustic emission system and its application based on GPS/Wifi high-precision wireless synchronous clock 2024-08-10 17:21 Jiehui Xie1) and Shifeng Liu3) 1) QingCheng AE Institute (Guangzhou) Co., Ltd., Guangzhou, Guangdong, 510670, China. Editor's Note: This report takes "Distributed Wireless Acoustic Emission System" as the research object, adopts two mainstream wireless synchronization methods, GPS and Wifi, and conducts research on high-precision wireless synchronization clocks. It has achieved satisfactory results in distributed acoustic emission positioning and data analysis of large-scale dot matrix arrangements, and is supplemented by field cases for specific explanations. 1 Fault location based on acoustic emission technology One of the most important steps in the signal analysis of acoustic emission is positioning. The positioning function can directly know the location of the acoustic emission source, which is convenient for secondary inspection of the designated area. For example, the common positioning of the bottom of a storage tank may take several months if the traditional ultrasonic detection method is used, and the tank needs to be cleaned during the detection process. However, acoustic emission positioning does not require cleaning of the tank, and it only takes a few hours. If the test results show that further testing is necessary, ultrasonic testing is used. If there is no need for further testing, the test can be completed directly. Compared with the two, the acoustic emission method can reduce a lot of testing costs. In order to realize the positioning function of acoustic emission, the time of each acoustic emission sensor collector needs to be synchronized, and the synchronization must reach the us level to achieve positioning in a smaller area. 2 Background of Traditional Time Synchronization In desktop acoustic emission detectors before the Internet of Things era, inter-board transmission or wired transmission was widely used to achieve time synchronization. 2.1 Inter-board synchronization method The figure below shows a company's acoustic emission tank bottom corrosion leakage detection system, which uses an inter-board transmission synchronization solution. Acoustic Emission Tank Bottom Corrosion Leak Detection System Figure 2-1 A company's acoustic emission tank bottom corrosion leakage detection system This solution uses multiple acoustic emission sensors arranged around the tank body, and connected to the computer equipment with acoustic emission acquisition card through long-distance cables. By using an onboard high-speed bus with extremely high accuracy (up to 100 ns), the synchronous acquisition of multiple channels is controlled to achieve the positioning function. The advantages of this method are: 1. The synchronization accuracy is very high, which can reach the level of 100 ns; 2. The sampling accuracy is high, which can reach 16~18 bits, and the sampling speed is high, 10Msps. However, there are the following disadvantages: 1. The equipment installation is complicated; 2. The cost is high; 3. The integrated channels are limited, and it is difficult to achieve more than 100 channels; 4. Affected by the length of the sensor line, the layout space is limited. 2.2 Wired synchronization method The wired transmission method usually uses a serial interface as the transmission medium. Through the distributed chassis layout, the chassis transmits waveform parameters through wireless/wired networks (WIFI, 4G, LORAWAN, etc.), which can increase the layout space. The following figure shows a company's distributed acoustic emission detection system based on 485 bus. Distributed Acoustic Emission Detection System Based on 485 Bus Figure 2-2 A company's distributed acoustic emission detection system based on 485 bus Schematic diagram of the distributed acoustic emission detection system Figure 2-3 Schematic diagram of the distributed acoustic emission detection system Each group of acoustic emission equipment contains N acoustic emission data acquisition channels (from 1 to N, dynamically configurable). The synchronization signal is transmitted through a high-precision bus within the equipment. The devices between the devices transmit synchronization information through the RS485 bus ring network connected by transceiver to achieve synchronization of the entire network. According to the load capacity of the RS485 bus, 30-40 groups of equipment can be connected, and the clock synchronization of the entire network can be achieved for a maximum of 700-800 channels. This method has the following advantages: 1. It can accommodate a large number of channels; 2. Distributed installation can reduce the difficulty of installation; 3. The layout space is large and the distance between devices can be very wide. However, there are the following disadvantages: 1. The synchronization accuracy is general and can reach ten us level; 2. When the 485 cable is long, a relay needs to be added; 3. The installation is complicated, and there are many sensor cables and communication cables. 3 New time synchronization model in the era of the Internet of Things Modern acoustic emission instruments have gradually entered the era of the Internet of Things. The previous method of using 485 industrial bus for wired time synchronization has the advantages of high accuracy, stable connection and high robustness, but it is not flexible and convenient in the application of large-scale acoustic emission wireless device clusters arranged in arrays. It is particularly important to choose a wireless and high-precision clock synchronization method. Therefore, after repeated comparisons and experiments, we have determined the two mainstream wireless time synchronization methods based on GPS and Wifi, which have long controllable distances, stability and reliability. The specific design scheme is as follows: 3.1 GPS synchronization method The GPS synchronization scheme of Qingcheng IOT acoustic emission equipment adopts a multi-mode satellite navigation synchronization method, supports Beidou III/GPS/GLONASS and other satellite positioning systems, supports multi-system joint positioning and single-system independent positioning, and realizes high-precision synchronization function. Qingcheng IOT acoustic emission equipment receives the timing synchronization pulse of the GPS/Beidou module in space, uses a high-precision clock source (±1ppm) for timing, and refreshes the time by detecting the pulse edge of PPS, which can achieve a synchronization function of ±1us. In addition, by receiving the positioning information RMC message of Beidou III/GPS/GLONASS, the positioning function of the device can be realized. Qingcheng IOT acoustic emission equipment adopts a miniaturized and integrated design. The equipment integrates sensors, acquisition circuits, rechargeable batteries and wireless synchronous communication function boards. It can realize wide-range acoustic emission signal acquisition, support networking of multiple wireless communication methods, support multi-channel combination synchronous network and other functions. It has the characteristics of small size, strong function and easy use. Qingcheng IOT acoustic emission equipment based on GPS has the following advantages: 1. It can accommodate a large number of channels; 2. It is easy to install and only needs to be installed once; 3. It is convenient to network and can realize communication with distance; 4. It can realize long-term unattended operation; 5. The layout space is wide and no cables are required; 6. The synchronization accuracy is high, up to ±1us; 7. Low cost. There are disadvantages: 1. It needs to be placed outdoors and is greatly affected by GPS signals. 3.2 Wifi wireless synchronization method The application of GPS and Beidou is ubiquitous, but the premise is to receive satellite signals. In closed plants such as dam plants, tunnel projects, and nuclear power plants where no signal can be received, synchronization can only be achieved by relying on time synchronization servers. In the field of monitoring, for convenience and safety reasons, some systems have to use wireless communication , especially for mobile inspection and monitoring systems, which can only achieve time synchronization and second pulse synchronization by wireless means. 3.2.1 WIFI wireless synchronization technology WIFI wireless synchronization technology is controlled by the wireless master device in the WIFI network, and sends synchronization sequence beacons containing synchronization time identifiers and synchronization data packets to several wireless slave devices in the target device group in a wireless directional broadcast mode of a specific wireless mode. When a nearby wireless slave device receives the synchronization time identifier sent by the wireless master device, it establishes and maintains a synchronization matching state with the wireless master device according to the synchronization time identifier, and places the corresponding matching verification identifier in its device status beacon. In the synchronization matching state with the wireless master device, the wireless slave device maintains wireless time slot synchronization in each synchronization time period, and performs synchronization time correction at least once in each synchronization validity period to maintain the synchronization matching state. The wireless slave device starts receiving the synchronization data packet in its synchronization detection reception time slot, receives the synchronization data packet within the synchronization validity period, and places the status verification code of the current corresponding synchronization data packet reception into the device status beacon. 3.2.2 Qingcheng IOT sound emission device Qingcheng IOT sound emission device is based on the above wireless synchronization technology, uses the 2.4GHz ISM frequency band (the same frequency band as 2.4G WiFi, automatically avoids WiFi channels), and realizes the synchronization networking function through star network technology (1 host, the rest are routing nodes), as shown in the figure below. Qingcheng IOT acoustic emission equipment system based on WIFI wireless synchronous networking Figure 3-1 Qingcheng IOT acoustic emission equipment system based on WIFI wireless synchronous networking The following figure shows an acoustic emission detection system based on WIFI wireless synchronization used in a project. 100 devices are used to transmit data through a wireless WIFI router and a computer (analysis terminal). Time synchronization is performed through a wireless WIFI synchronization network to analyze the acoustic emission signal generated by the leak, thereby locating the fault. Qingcheng IOT acoustic emission equipment based on GPS has the following advantages: 1. It can accommodate a large number of channels; 2. It is easy to install and only needs to be installed once; 3. It is convenient to network and can realize distance communication; 4. It can achieve long-term unattended operation; 5. The layout space is wide and no cables are required; 6. The synchronization accuracy is high, up to ±1us; 7. The cost is low. There are disadvantages: 1. It is greatly affected by the strength of the wireless signal and is easily affected by obstacles. 3.3 Summary The above 4 synchronization methods have their own characteristics. When using them, you can choose the appropriate equipment according to your needs. The comparison of the 4 synchronization methods is as follows: Table 1 Comparison of 4 synchronization methods Signal accuracy Installation Difficulty Synchronization accuracy Layout space Maintenance Difficulty cost Inter-board synchronization Highest high Highest Small high Highest Wired Sync high generally middle middle middle middle GPS Sync middle Low high wide Low Low Wireless Sync middle Low high wide Low Low 3. 4 Overall design of wireless clock synchronization system Large-scale equipment or systems in industrial production environments may experience unpredictable faults or anomalies during long-term operation. Acoustic emission equipment based on the Internet of Things can quickly detect the occurrence of faults or anomalies, and can be used for long-term real-time remote monitoring of large-scale equipment; based on high-precision acoustic emission source positioning, it can help engineers quickly locate the location of faults or anomalies, and can be used for structural reliability monitoring and detection of large-scale equipment. The environment in which large-scale equipment or systems are located is complex and diverse. Some are outdoor environments, some are indoor environments, and some are environments where wireless networks cannot be used. In order to adapt to the needs of various environments, the latest Qingcheng IOT acoustic emission equipment is internally compatible with three synchronization modes: GPS/wireless/wired. You can select GPS synchronization, wireless synchronization, and wired synchronization by configuring the synchronization mode. The device integrates GPS, WIFI synchronization, and 485 synchronization circuits. The switching of these synchronization function circuits is realized through the main control chip, thereby adapting to a variety of synchronization methods. The principle block diagram of the device is as follows: Schematic diagram of the hardware principle of Qingcheng IOT acoustic emission equipment Figure 3-3 Schematic diagram of the hardware principle of Qingcheng IOT acoustic emission equipment In this way, the device can be compatible with a variety of indoor and outdoor, wired and wireless application scenarios, providing high-precision synchronization functions, thereby realizing the fault location function of the acoustic emission system. The parameters of the device are shown in Table 2. Table 2 Hardware parameters of Qingcheng IOT acoustic emission equipment Channel combination Multi-channel combination use Input bandwidth 10KHz-1000KHz Collection method Signal trigger/time trigger Analog Filters Multiple frequency bands available Synchronous clock GPS: Synchronous clock better than 1us WiFi: Synchronous clock better than 10us Wired: Synchronous clock better than 10us Protection level IP62~IP67, can be configured according to user environment requirements Collection frequency Maximum sampling rate of single channel: 2M points/s Built-in SD card capacity 64GB (expandable to 512GB) Collection accuracy 16-bit Communication 4G、WiFi、LAN等; System noise Better than 30dB Operating temperature range -20℃-60℃ AE characteristic parameters Arrival time, amplitude, ring count, energy, rise time, duration, RMS, ASL Data Output Waveform, parameters, parameter rating, you can choose whether to upload waveform, parameters according to parameter rating Digital Filter 256-order FIR filter, any value setting of pass-through, high-pass, low-pass, band-pass in the frequency range of 0KHz~1000KHz powered by 12VDC external power supply, or built-in battery power supply, the battery working time is up to 40 hours. 4 Current Status of Wireless Synchronous Clock Equipment and Synchronous Clock Accuracy Test 4.1 GPS /Wifi Wireless Synchronous Clock Version M1 Product Status The GPS wireless synchronous clock version M1 acoustic emission detection system is a multi-channel real-time acoustic emission acquisition system that is transmitted from multiple independent single-channel acoustic emission collectors to the computer host software via WiFi or to the cloud platform via 4G. The data time synchronization between each collector is achieved by receiving GPS time, and the synchronization clock accuracy can reach within 1us, which is suitable for various occasions where time difference positioning is required, such as tank bottom corrosion time difference positioning, pressure vessel crack cracking positioning detection, etc. The WiFi wireless synchronous clock version M1 acoustic emission detection system is a multi-channel real-time acoustic emission acquisition system that is transmitted from multiple independent single-channel acoustic emission collectors to the computer host software via WiFi. The synchronization networking function is realized through WiFi star network technology (1 host, the rest are routing nodes), and the wireless synchronization clock accuracy is better than ±10us. It is suitable for environments where synchronization can only be achieved by local networking in closed plants such as dam plants, tunnel projects, nuclear power plants, etc. where satellite signals cannot be received. GPS Wireless Synchronous Clock Version M1 WiFi Wireless Synchronous Clock Version M1 4-1 GPS Wireless Synchronous Clock Version M1 4-2 WiFi Wireless Synchronous Clock Version M1 Table 2 GPS/WiFi Wireless Synchronous Clock Edition M1 Hardware Parameters Channel combination Single channel or multi-channel combination use Input bandwidth 10KHz-1000KHz Collection method Signal trigger/time trigger Analog Filters Multiple frequency bands available Wireless Synchronous Clock GPS, synchronization clock is better than 1us WiFi, synchronization clock is better than 10us Protection level IP62 Collection frequency Maximum sampling rate of single channel: 2M points/s Built-in SD card capacity 64GB (expandable to 512GB) Collection accuracy 16-bit Communication 4G、WiFi; System noise Better than 30dB Operating temperature range -20℃-60℃ AE characteristic parameters Arrival time, amplitude, ring count, energy, rise time, duration, RMS, ASL Data Output Waveform, parameters, parameter rating, you can choose whether to upload waveform, parameters according to parameter rating Digital Filter 256-order FIR filter, any value setting of pass-through, high-pass, low-pass, band-pass in the frequency range of 0KHz~1000KHz powered by 12VDC external power supply, or built-in battery power supply 4.2 Synchronous clock accuracy test Take a 500mm×500mm steel plate, place the wireless synchronous clock RAEM1 on the four corners respectively, and break the 0.5mm HB hardness pencil lead along the path "A" on the iron plate to obtain the positioning diagram as shown in the right figure. The time difference accuracy is high and the positioning effect is good. Test environment Test Results Figure 4-3: Test environment Figure 4-4: Test results 5 Application solutions and cases 5.1 Accurate positioning of leakage in a nuclear power containment When the leakage rate exceeds the standard during the overall sealing test of the containment of a nuclear power reactor building, the data is collected by the RAEM1 with high-precision wireless synchronous clock installed inside the containment and transmitted to the computer host software outside the containment, which can quickly and accurately find the location of the leakage point. The wireless sensor system consists of 100 wireless sensor units (1 host, 99 slaves) and computer host software. When a leak occurs, 100 RAEM1 with high synchronous clock accuracy simultaneously collect waveform data, and the time difference to the sensor in the array is calculated by the waveform correlation algorithm, and then the location of the leak source is calculated by the surface positioning algorithm. The structure and layout diagram of its wireless sensor system are shown in the figure below. Sensor Block Diagram Sensor Detailed Layout Figure 5-1 Sensor principle block diagram Figure 5-2 Detailed sensor layout 5.2 Pipeline Leakage Location The sensor is installed on a 10-meter-long pipeline and connected to two GPS wireless synchronous clock versions RAEM1, as shown in Figures 5-3 and 5-4 below. The data is transmitted to the computer host software via WiFi. Experiment 1: The lead is broken once in the middle of the two sensors, and the positioning diagram is shown in Figure 5-5; Experiment 2: The lead is broken 6 times at a position 2 meters close to the 1# sensor, and the positioning diagram is shown in Figure 5-5; Conclusion: The GPS version of RAEM1 synchronous clock accuracy can accurately locate, and combined with relevant algorithms, it can be used for pressure pipeline external leakage or valve internal leakage. Sensor installation diagram Sensor distribution map Figure 5-3 Sensor installation diagram Figure 5-4 Distribution diagram of 1# and 2# sensors Figure 5-5 Lead cut once in the middle Figure 5-6 Lead breaks 6 times at 2 meters near sensor 1# 5.3 Atmospheric pressure tank bottom plate corrosion detection, spherical tank and other pressure vessel crack detection In traditional tank bottom plate corrosion detection, the sensor needs to be wired to the acoustic emission collector, and the cable needs to be pulled to power the acoustic emission collector. There are many cables, which is time-consuming and labor-intensive. The RAEM1 with WiFi wireless synchronous clock version has its sensor, collector, communication, clock synchronization, and battery integrated into the cylinder, which can completely eliminate wiring. The whole is powered by batteries and can work continuously for more than 5 hours, which fully meets the needs of 2-3 times of detection. The number of channels can be flexibly configured, which greatly improves the efficiency of detection. Its principle block diagram is shown in Figures 5-7 and 5-8 below: WiFi wireless synchronous clock integrated version RAEM1 atmospheric pressure tank bottom corrosion detection Figure 5-7 WiFi wireless synchronous clock integrated version RAEM1 atmospheric pressure tank bottom corrosion detection WiFi wireless synchronous clock integrated version RAEM1 spherical tank detection Figure 5-8 WiFi wireless synchronous clock integrated version RAEM1 spherical tank detection 6 Conclusion The distributed wireless acoustic emission system based on GPS/Wifi high-precision wireless synchronous clock can realize distributed high-precision wireless synchronous clock positioning. At present, it has been applied in the corrosion positioning of the bottom plate of atmospheric pressure storage tanks, crack positioning of pressure vessels, and leakage source positioning. With the Internet of Things acoustic emission equipment of the Internet of Things architecture, long-term online monitoring of wireless synchronous clock time difference positioning can be realized. |
| json metadata | {"tags":["ae"],"app":"steemit/0.2","format":"markdown"} |
| parent author | |
| parent permlink | ae |
| permlink | distributed-wireless-acoustic-emission-system-and-its-application-based-on-gps-wifi-high-precision-wireless-synchronous-clock |
| title | Distributed wireless acoustic emission system and its application based on GPS/Wifi high-precision wireless synchronous clock |
| Transaction Info | Block #87603089/Trx 51a21f9b982fa577530f8bfd29ef807f1afb540d |
View Raw JSON Data
{
  "block": 87603089,
  "op": [
    "comment",
    {
      "author": "barrylee",
      "body": "Distributed wireless acoustic emission system and its application based on GPS/Wifi high-precision wireless synchronous clock\n2024-08-10 17:21\n\nJiehui Xie1) and Shifeng Liu3)\n1) QingCheng AE Institute (Guangzhou) Co., Ltd., Guangzhou, Guangdong, 510670, China.\nEditor's Note: This report takes \"Distributed Wireless Acoustic Emission System\" as the research object, adopts two mainstream wireless synchronization methods, GPS and Wifi, and conducts research on high-precision wireless synchronization clocks. It has achieved satisfactory results in distributed acoustic emission positioning and data analysis of large-scale dot matrix arrangements, and is supplemented by field cases for specific explanations.\n1 Fault location based on acoustic emission technology\nOne of the most important steps in the signal analysis of acoustic emission is positioning. The positioning function can directly know the location of the acoustic emission source, which is convenient for secondary inspection of the designated area. For example, the common positioning of the bottom of a storage tank may take several months if the traditional ultrasonic detection method is used, and the tank needs to be cleaned during the detection process. However, acoustic emission positioning does not require cleaning of the tank, and it only takes a few hours. If the test results show that further testing is necessary, ultrasonic testing is used. If there is no need for further testing, the test can be completed directly. Compared with the two, the acoustic emission method can reduce a lot of testing costs. In\norder to realize the positioning function of acoustic emission, the time of each acoustic emission sensor collector needs to be synchronized, and the synchronization must reach the us level to achieve positioning in a smaller area.\n\n2 Background of Traditional Time Synchronization\n \nIn desktop acoustic emission detectors before the Internet of Things era, inter-board transmission or wired transmission was widely used to achieve time synchronization.\n\n2.1 Inter-board synchronization method\n\nThe figure below shows a company's acoustic emission tank bottom corrosion leakage detection system, which uses an inter-board transmission synchronization solution.\nAcoustic Emission Tank Bottom Corrosion Leak Detection System\nFigure 2-1 A company's acoustic emission tank bottom corrosion leakage detection system\nThis solution uses multiple acoustic emission sensors arranged around the tank body, and connected to the computer equipment with acoustic emission acquisition card through long-distance cables. By using an onboard high-speed bus with extremely high accuracy (up to 100 ns), the synchronous acquisition of multiple channels is controlled to achieve the positioning function.\nThe advantages of this method are:\n1. The synchronization accuracy is very high, which can reach the level of 100 ns;\n2. The sampling accuracy is high, which can reach 16~18 bits, and the sampling speed is high, 10Msps.\nHowever, there are the following disadvantages:\n1. The equipment installation is complicated;\n2. The cost is high;\n3. The integrated channels are limited, and it is difficult to achieve more than 100 channels;\n4. Affected by the length of the sensor line, the layout space is limited.\n \n2.2 Wired synchronization method\nThe wired transmission method usually uses a serial interface as the transmission medium. Through the distributed chassis layout, the chassis transmits waveform parameters through wireless/wired networks (WIFI, 4G, LORAWAN, etc.), which can increase the layout space. The following figure shows a company's distributed acoustic emission detection system based on 485 bus.\nDistributed Acoustic Emission Detection System Based on 485 Bus\nFigure 2-2 A company's distributed acoustic emission detection system based on 485 bus\nSchematic diagram of the distributed acoustic emission detection system\nFigure 2-3 Schematic diagram of the distributed acoustic emission detection system\nEach group of acoustic emission equipment contains N acoustic emission data acquisition channels (from 1 to N, dynamically configurable). The synchronization signal is transmitted through a high-precision bus within the equipment. The devices between the devices transmit synchronization information through the RS485 bus ring network connected by transceiver to achieve synchronization of the entire network. According to the load capacity of the RS485 bus, 30-40 groups of equipment can be connected, and the clock synchronization of the entire network can be achieved for a maximum of 700-800 channels.\nThis method has the following advantages:\n1. It can accommodate a large number of channels;\n2. Distributed installation can reduce the difficulty of installation;\n3. The layout space is large and the distance between devices can be very wide.\nHowever, there are the following disadvantages:\n1. The synchronization accuracy is general and can reach ten us level;\n2. When the 485 cable is long, a relay needs to be added;\n3. The installation is complicated, and there are many sensor cables and communication cables.\n3 New time synchronization model in the era of the Internet of Things\nModern acoustic emission instruments have gradually entered the era of the Internet of Things. The previous method of using 485 industrial bus for wired time synchronization has the advantages of high accuracy, stable connection and high robustness, but it is not flexible and convenient in the application of large-scale acoustic emission wireless device clusters arranged in arrays. It is particularly important to choose a wireless and high-precision clock synchronization method.\nTherefore, after repeated comparisons and experiments, we have determined the two mainstream wireless time synchronization methods based on GPS and Wifi, which have long controllable distances, stability and reliability. The specific design scheme is as follows:\n3.1  GPS synchronization method\nThe GPS synchronization scheme of Qingcheng IOT acoustic emission equipment adopts a multi-mode satellite navigation synchronization method, supports Beidou III/GPS/GLONASS and other satellite positioning systems, supports multi-system joint positioning and single-system independent positioning, and realizes high-precision synchronization function.\nQingcheng IOT acoustic emission equipment receives the timing synchronization pulse of the GPS/Beidou module in space, uses a high-precision clock source (±1ppm) for timing, and refreshes the time by detecting the pulse edge of PPS, which can achieve a synchronization function of ±1us. In addition, by receiving the positioning information RMC message of Beidou III/GPS/GLONASS, the positioning function of the device can be realized.\nQingcheng IOT acoustic emission equipment adopts a miniaturized and integrated design. The equipment integrates sensors, acquisition circuits, rechargeable batteries and wireless synchronous communication function boards. It can realize wide-range acoustic emission signal acquisition, support networking of multiple wireless communication methods, support multi-channel combination synchronous network and other functions. It has the characteristics of small size, strong function and easy use.\nQingcheng IOT acoustic emission equipment based on GPS has the following advantages:\n1. It can accommodate a large number of channels;\n2. It is easy to install and only needs to be installed once;\n3. It is convenient to network and can realize communication with distance;\n4. It can realize long-term unattended operation;\n5. The layout space is wide and no cables are required;\n6. The synchronization accuracy is high, up to ±1us;\n7. Low cost.\nThere are disadvantages:\n1. It needs to be placed outdoors and is greatly affected by GPS signals.\n \n3.2 Wifi wireless synchronization method\nThe application of GPS and Beidou is ubiquitous, but the premise is to receive satellite signals. In closed plants such as dam plants, tunnel projects, and nuclear power plants where no signal can be received, synchronization can only be achieved by relying on time synchronization servers. In the field of monitoring, for convenience and safety reasons, some systems have to use wireless communication , especially for mobile inspection and monitoring systems, which can only achieve time synchronization and second pulse synchronization by wireless means.\n3.2.1 WIFI wireless synchronization technology\nWIFI wireless synchronization technology is controlled by the wireless master device in the WIFI network, and sends synchronization sequence beacons containing synchronization time identifiers and synchronization data packets to several wireless slave devices in the target device group in a wireless directional broadcast mode of a specific wireless mode. When a nearby wireless slave device receives the synchronization time identifier sent by the wireless master device, it establishes and maintains a synchronization matching state with the wireless master device according to the synchronization time identifier, and places the corresponding matching verification identifier in its device status beacon. In the synchronization matching state with the wireless master device, the wireless slave device maintains wireless time slot synchronization in each synchronization time period, and performs synchronization time correction at least once in each synchronization validity period to maintain the synchronization matching state. The wireless slave device starts receiving the synchronization data packet in its synchronization detection reception time slot, receives the synchronization data packet within the synchronization validity period, and places the status verification code of the current corresponding synchronization data packet reception into the device status beacon.\n3.2.2 Qingcheng IOT sound emission device\nQingcheng IOT sound emission device is based on the above wireless synchronization technology, uses the 2.4GHz ISM frequency band (the same frequency band as 2.4G WiFi, automatically avoids WiFi channels), and realizes the synchronization networking function through star network technology (1 host, the rest are routing nodes), as shown in the figure below.\n \n Qingcheng IOT acoustic emission equipment system based on WIFI wireless synchronous networking\nFigure 3-1 Qingcheng IOT acoustic emission equipment system based on WIFI wireless synchronous networking\n\nThe following figure shows an acoustic emission detection system based on WIFI wireless synchronization used in a project. 100 devices are used to transmit data through a wireless WIFI router and a computer (analysis terminal). Time synchronization is performed through a wireless WIFI synchronization network to analyze the acoustic emission signal generated by the leak, thereby locating the fault.\nQingcheng IOT acoustic emission equipment based on GPS has the following advantages:\n1. It can accommodate a large number of channels;\n2. It is easy to install and only needs to be installed once;\n3. It is convenient to network and can realize distance communication;\n4. It can achieve long-term unattended operation;\n5. The layout space is wide and no cables are required;\n6. The synchronization accuracy is high, up to ±1us;\n7. The cost is low.\nThere are disadvantages:\n1. It is greatly affected by the strength of the wireless signal and is easily affected by obstacles.\n3.3 Summary\nThe above 4 synchronization methods have their own characteristics. When using them, you can choose the appropriate equipment according to your needs. The comparison of the 4 synchronization methods is as follows:\n\nTable 1 Comparison of 4 synchronization methods\n \nSignal accuracy\nInstallation Difficulty\nSynchronization accuracy\nLayout space\nMaintenance Difficulty\ncost\nInter-board synchronization\nHighest\nhigh\nHighest\nSmall\nhigh\nHighest\nWired Sync\nhigh\ngenerally\nmiddle\nmiddle\nmiddle\nmiddle\nGPS Sync\nmiddle\nLow\nhigh\nwide\nLow\nLow\nWireless Sync\nmiddle\nLow\nhigh\nwide\nLow\nLow\n \n \n3. 4 Overall design of wireless clock synchronization system\nLarge-scale equipment or systems in industrial production environments may experience unpredictable faults or anomalies during long-term operation. Acoustic emission equipment based on the Internet of Things can quickly detect the occurrence of faults or anomalies, and can be used for long-term real-time remote monitoring of large-scale equipment; based on high-precision acoustic emission source positioning, it can help engineers quickly locate the location of faults or anomalies, and can be used for structural reliability monitoring and detection of large-scale equipment. The environment in which large-scale equipment or systems are located is complex and diverse. Some are outdoor environments, some are indoor environments, and some are environments where wireless networks cannot be used. In order to adapt to the needs of various environments, the latest Qingcheng IOT acoustic emission equipment is internally compatible with three synchronization modes: GPS/wireless/wired. You can select GPS synchronization, wireless synchronization, and wired synchronization by configuring the synchronization mode. The device integrates GPS, WIFI synchronization, and 485 synchronization circuits. The switching of these synchronization function circuits is realized through the main control chip, thereby adapting to a variety of synchronization methods. The principle block diagram of the device is as follows:\nSchematic diagram of the hardware principle of Qingcheng IOT acoustic emission equipment\nFigure 3-3 Schematic diagram of the hardware principle of Qingcheng IOT acoustic emission equipment\nIn this way, the device can be compatible with a variety of indoor and outdoor, wired and wireless application scenarios, providing high-precision synchronization functions, thereby realizing the fault location function of the acoustic emission system.        \nThe parameters of the device are shown in Table 2.\nTable 2 Hardware parameters of Qingcheng IOT acoustic emission equipment\nChannel combination\nMulti-channel combination use\nInput bandwidth\n10KHz-1000KHz\nCollection method\nSignal trigger/time trigger\nAnalog Filters\nMultiple frequency bands available\nSynchronous clock\nGPS: Synchronous clock better than 1us\nWiFi: Synchronous clock better than 10us\nWired: Synchronous clock better than 10us\nProtection level\nIP62~IP67, can be configured according to user environment requirements\nCollection frequency\nMaximum sampling rate of single channel: 2M points/s\nBuilt-in SD card capacity\n64GB (expandable to 512GB)\nCollection accuracy\n16-bit\nCommunication\n4G、WiFi、LAN等;\nSystem noise\nBetter than 30dB\nOperating temperature range\n-20℃-60℃\nAE characteristic parameters\nArrival time, amplitude, ring count, energy, rise time, duration, RMS, ASL\nData Output\nWaveform, parameters, parameter rating, you can choose whether to upload waveform, parameters according to parameter rating\nDigital Filter\n256-order FIR filter, any value setting of pass-through, high-pass, low-pass, band-pass in the frequency range of 0KHz~1000KHz\npowered by\n12VDC external power supply, or built-in battery power supply, the battery working time is up to 40 hours.\n \n4 Current Status of Wireless Synchronous Clock Equipment and Synchronous Clock Accuracy Test\n4.1 GPS /Wifi Wireless Synchronous Clock Version M1 Product Status\nThe GPS wireless synchronous clock version M1 acoustic emission detection system is a multi-channel real-time acoustic emission acquisition system that is transmitted from multiple independent single-channel acoustic emission collectors to the computer host software via WiFi or to the cloud platform via 4G. The data time synchronization between each collector is achieved by receiving GPS time, and the synchronization clock accuracy can reach within 1us, which is suitable for various occasions where time difference positioning is required, such as tank bottom corrosion time difference positioning, pressure vessel crack cracking positioning detection, etc. The\nWiFi wireless synchronous clock version M1 acoustic emission detection system is a multi-channel real-time acoustic emission acquisition system that is transmitted from multiple independent single-channel acoustic emission collectors to the computer host software via WiFi. The synchronization networking function is realized through WiFi star network technology (1 host, the rest are routing nodes), and the wireless synchronization clock accuracy is better than ±10us. It is suitable for environments where synchronization can only be achieved by local networking in closed plants such as dam plants, tunnel projects, nuclear power plants, etc. where satellite signals cannot be received.\n \nGPS Wireless Synchronous Clock Version M1\nWiFi Wireless Synchronous Clock Version M1\n4-1 GPS Wireless Synchronous Clock Version M1\n4-2 WiFi Wireless Synchronous Clock Version M1\n \nTable 2 GPS/WiFi Wireless Synchronous Clock Edition M1 Hardware Parameters\nChannel combination\nSingle channel or multi-channel combination use\nInput bandwidth\n10KHz-1000KHz\nCollection method\nSignal trigger/time trigger\nAnalog Filters\nMultiple frequency bands available\nWireless Synchronous Clock\nGPS, synchronization clock is better than 1us\nWiFi, synchronization clock is better than 10us\nProtection level\nIP62\nCollection frequency\nMaximum sampling rate of single channel: 2M points/s\nBuilt-in SD card capacity\n64GB (expandable to 512GB)\nCollection accuracy\n16-bit\nCommunication\n4G、WiFi;\nSystem noise\nBetter than 30dB\nOperating temperature range\n-20℃-60℃\nAE characteristic parameters\nArrival time, amplitude, ring count, energy, rise time, duration, RMS, ASL\nData Output\nWaveform, parameters, parameter rating, you can choose whether to upload waveform, parameters according to parameter rating\nDigital Filter\n256-order FIR filter, any value setting of pass-through, high-pass, low-pass, band-pass in the frequency range of 0KHz~1000KHz\npowered by\n12VDC external power supply, or built-in battery power supply\n \n4.2 Synchronous clock accuracy test\nTake a 500mm×500mm steel plate, place the wireless synchronous clock RAEM1 on the four corners respectively, and break the 0.5mm HB hardness pencil lead along the path \"A\" on the iron plate to obtain the positioning diagram as shown in the right figure. The time difference accuracy is high and the positioning effect is good.\nTest environment\nTest Results\nFigure 4-3: Test environment\nFigure 4-4: Test results\n \n5 Application solutions and cases\n5.1 Accurate positioning of leakage in a nuclear power containment\nWhen the leakage rate exceeds the standard during the overall sealing test of the containment of a nuclear power reactor building, the data is collected by the RAEM1 with high-precision wireless synchronous clock installed inside the containment and transmitted to the computer host software outside the containment, which can quickly and accurately find the location of the leakage point. The\nwireless sensor system consists of 100 wireless sensor units (1 host, 99 slaves) and computer host software. When a leak occurs, 100 RAEM1 with high synchronous clock accuracy simultaneously collect waveform data, and the time difference to the sensor in the array is calculated by the waveform correlation algorithm, and then the location of the leak source is calculated by the surface positioning algorithm. The structure and layout diagram of its wireless sensor system are shown in the figure below.\nSensor Block Diagram\nSensor Detailed Layout\nFigure 5-1 Sensor principle block diagram\nFigure 5-2 Detailed sensor layout\n \n5.2 Pipeline Leakage Location\nThe sensor is installed on a 10-meter-long pipeline and connected to two GPS wireless synchronous clock versions RAEM1, as shown in Figures 5-3 and 5-4 below. The data is transmitted to the computer host software via WiFi.\nExperiment 1: The lead is broken once in the middle of the two sensors, and the positioning diagram is shown in Figure 5-5;\nExperiment 2: The lead is broken 6 times at a position 2 meters close to the 1# sensor, and the positioning diagram is shown in Figure 5-5;\nConclusion:\n\nThe GPS version of RAEM1 synchronous clock accuracy can accurately locate, and combined with relevant algorithms, it can be used for pressure pipeline external leakage or valve internal leakage.\nSensor installation diagram\nSensor distribution map\nFigure 5-3 Sensor installation diagram\nFigure 5-4 Distribution diagram of 1# and 2# sensors\n\n\nFigure 5-5 Lead cut once in the middle\nFigure 5-6 Lead breaks 6 times at 2 meters near sensor 1#\n \n5.3 Atmospheric pressure tank bottom plate corrosion detection, spherical tank and other pressure vessel crack detection\nIn traditional tank bottom plate corrosion detection, the sensor needs to be wired to the acoustic emission collector, and the cable needs to be pulled to power the acoustic emission collector. There are many cables, which is time-consuming and labor-intensive. The RAEM1 with WiFi wireless synchronous clock version has its sensor, collector, communication, clock synchronization, and battery integrated into the cylinder, which can completely eliminate wiring. The whole is powered by batteries and can work continuously for more than 5 hours, which fully meets the needs of 2-3 times of detection. The number of channels can be flexibly configured, which greatly improves the efficiency of detection. Its principle block diagram is shown in Figures 5-7 and 5-8 below:\nWiFi wireless synchronous clock integrated version RAEM1 atmospheric pressure tank bottom corrosion detection\nFigure 5-7 WiFi wireless synchronous clock integrated version RAEM1 atmospheric pressure tank bottom corrosion detection\n \nWiFi wireless synchronous clock integrated version RAEM1 spherical tank detection\nFigure 5-8 WiFi wireless synchronous clock integrated version RAEM1 spherical tank detection\n \n6 Conclusion\nThe distributed wireless acoustic emission system based on GPS/Wifi high-precision wireless synchronous clock can realize distributed high-precision wireless synchronous clock positioning. At present, it has been applied in the corrosion positioning of the bottom plate of atmospheric pressure storage tanks, crack positioning of pressure vessels, and leakage source positioning. With the Internet of Things acoustic emission equipment of the Internet of Things architecture, long-term online monitoring of wireless synchronous clock time difference positioning can be realized.",
      "json_metadata": "{\"tags\":[\"ae\"],\"app\":\"steemit/0.2\",\"format\":\"markdown\"}",
      "parent_author": "",
      "parent_permlink": "ae",
      "permlink": "distributed-wireless-acoustic-emission-system-and-its-application-based-on-gps-wifi-high-precision-wireless-synchronous-clock",
      "title": "Distributed wireless acoustic emission system and its application based on GPS/Wifi high-precision wireless synchronous clock"
    }
  ],
  "op_in_trx": 0,
  "timestamp": "2024-08-10T09:42:51",
  "trx_id": "51a21f9b982fa577530f8bfd29ef807f1afb540d",
  "trx_in_block": 0,
  "virtual_op": 0
}2024/08/06 02:10:21
2024/08/06 02:10:21
| delegatee | barrylee |
| delegator | steem |
| vesting shares | 17075.678695 VESTS |
| Transaction Info | Block #87479206/Trx c24c7ed2f5823e961426dcbfb54ad7452daee217 |
View Raw JSON Data
{
  "block": 87479206,
  "op": [
    "delegate_vesting_shares",
    {
      "delegatee": "barrylee",
      "delegator": "steem",
      "vesting_shares": "17075.678695 VESTS"
    }
  ],
  "op_in_trx": 0,
  "timestamp": "2024-08-06T02:10:21",
  "trx_id": "c24c7ed2f5823e961426dcbfb54ad7452daee217",
  "trx_in_block": 4,
  "virtual_op": 0
}bluesniperupvoted (100.00%) @barrylee / acoustic-emission-testing-technology2024/07/25 06:16:36
bluesniperupvoted (100.00%) @barrylee / acoustic-emission-testing-technology
2024/07/25 06:16:36
| author | barrylee |
| permlink | acoustic-emission-testing-technology |
| voter | bluesniper |
| weight | 10000 (100.00%) |
| Transaction Info | Block #87140724/Trx c3822594e8b26946e8d15619bc6d1a120f052b1d |
View Raw JSON Data
{
  "block": 87140724,
  "op": [
    "vote",
    {
      "author": "barrylee",
      "permlink": "acoustic-emission-testing-technology",
      "voter": "bluesniper",
      "weight": 10000
    }
  ],
  "op_in_trx": 0,
  "timestamp": "2024-07-25T06:16:36",
  "trx_id": "c3822594e8b26946e8d15619bc6d1a120f052b1d",
  "trx_in_block": 1,
  "virtual_op": 0
}barryleepublished a new post: acoustic-emission-testing-technology2024/07/25 06:11:03
barryleepublished a new post: acoustic-emission-testing-technology
2024/07/25 06:11:03
| author | barrylee |
| body | The phenomenon of local sources in materials releasing energy quickly to generate transient elastic waves is called acoustic emission. The technology of using instruments to detect, record and analyze acoustic emission signals and to infer the source of acoustic emission using <a href="https://www.aendt.com/blog/acoustic-emission-testing.html">acoustic emission signals</a> is called acoustic emission detection technology. ADVANTAGE Advantages of Acoustic Emission Testing As a cutting-edge dynamic nondestructive testing method, <a href="https://www.aendt.com/blog/acoustic-emission-testing.html">acoustic emission testing</a> technology can detect the activity of defects under applied structural stress. It is more sensitive to linear defects, and stable defects do not generate acoustic emission signals. Acoustic emission testing is used for regular inspection of in-service equipment , which can shorten the equipment downtime or eliminate the need for downtime. Therefore, it has advantages in corrosion monitoring and detection of active defects that other nondestructive testing methods do not have. 78feec4e4e4e094c9bfe8bd208a44924.jpg ed4767f1f257f3e1d793b0c39f18d547.jpg Figure | Acoustic emission testing site of Shenghua Company AE ON STORAGE TANK Online detection of acoustic emission of storage tanks The application of online detection and evaluation technology of acoustic emission of storage tanks provides advanced safety assurance technology for the safe and stable operation of large petrochemical storage tanks, the reduction and avoidance of environmental pollution, the extension of the life of over-service equipment and the best maintenance decision-making. It is widely used in oil, natural gas, petrochemical and other enterprises, as well as strategic oil reserves. 52bea5c3f4b7a53300c874726c7f9d08.jpg 825c435fd9a175a2c0336942af9e1055.jpg Figure | Shenghua inspectors conduct acoustic emission testing on storage tanks PROJECT Shenghua Case▉ Guangzhou Shenghua Technology Co., Ltd. is the earliest non-destructive testing organization in China to engage in the research of acoustic emission technology and the application of acoustic emission detection technology. It is one of the few units in China that has obtained the qualification of acoustic emission detection. Over the past 20 years, Shenghua has tested hundreds of atmospheric pressure storage tanks of various types ranging from 500 m³ to 50,000 m³, and has provided acoustic emission detection services for spherical tanks, long tube trailers, pressure vessels, etc. to customers in the petroleum, petrochemical, special equipment and other industries in and outside the province for many times. a5a29d92d77a3042c7b90c1d263dc29a.jpg a36efa9b04b4f3e751f8d16b702a2fe7.jpg Acoustic emission testing of gas cylinders (left) Acoustic emission testing of natural gas pressure regulating stations (right) f338e95a2aabd7f8201d1192dbb5ed59.jpg 72d46190b0bdd9a48cd539f1d5b791aa.jpg Acoustic emission detection of spherical tank (left) Acoustic emission detection of ammonia synthesis tower (right) Acoustic emission detection technology is also widely used in the fields of electricity, material testing, metal processing, aerospace industry, transportation industry, etc. With people's deeper understanding of the theoretical research on sound sources and acoustic signal propagation, acoustic emission detection technology will usher in a new and higher level of application development prospects. |
| json metadata | {"tags":["acoustic"],"links":["https://www.aendt.com/blog/acoustic-emission-testing.html"],"app":"steemit/0.2","format":"markdown"} |
| parent author | |
| parent permlink | acoustic |
| permlink | acoustic-emission-testing-technology |
| title | Acoustic Emission Testing Technology |
| Transaction Info | Block #87140613/Trx f30565bd2cf2c8d4bbe64da5df9d75f5f7f3384f |
View Raw JSON Data
{
  "block": 87140613,
  "op": [
    "comment",
    {
      "author": "barrylee",
      "body": "The phenomenon of local sources in materials releasing energy quickly to generate transient elastic waves is called acoustic emission. The technology of using instruments to detect, record and analyze acoustic emission signals and to infer the source of acoustic emission using <a href=\"https://www.aendt.com/blog/acoustic-emission-testing.html\">acoustic emission signals</a> is called acoustic emission detection technology.\n\n\nADVANTAGE\n\nAdvantages of Acoustic Emission Testing \n\nAs a cutting-edge dynamic nondestructive testing method, <a href=\"https://www.aendt.com/blog/acoustic-emission-testing.html\">acoustic emission testing</a> technology can detect the activity of defects under applied structural stress. It is more sensitive to linear defects, and stable defects do not generate acoustic emission signals. Acoustic emission testing is used for regular inspection of in-service equipment , which can shorten the equipment downtime or eliminate the need for downtime. Therefore, it has advantages in corrosion monitoring and detection of active defects that other nondestructive testing methods do not have.\n\n78feec4e4e4e094c9bfe8bd208a44924.jpg ed4767f1f257f3e1d793b0c39f18d547.jpg\n\nFigure | Acoustic emission testing site of Shenghua Company\n\nAE ON STORAGE TANK\n\nOnline detection of acoustic emission of storage tanks \n\nThe application of online detection and evaluation technology of acoustic emission of storage tanks provides advanced safety assurance technology for the safe and stable operation of large petrochemical storage tanks, the reduction and avoidance of environmental pollution, the extension of the life of over-service equipment and the best maintenance decision-making. It is widely used in oil, natural gas, petrochemical and other enterprises, as well as strategic oil reserves.\n\n52bea5c3f4b7a53300c874726c7f9d08.jpg 825c435fd9a175a2c0336942af9e1055.jpg\n\nFigure | Shenghua inspectors conduct acoustic emission testing on storage tanks\n\n\nPROJECT\n\nShenghua Case▉ \n\nGuangzhou Shenghua Technology Co., Ltd. is the earliest non-destructive testing organization in China to engage in the research of acoustic emission technology and the application of acoustic emission detection technology. It is one of the few units in China that has obtained the qualification of acoustic emission detection. Over the past 20 years, Shenghua has tested hundreds of atmospheric pressure storage tanks of various types ranging from 500 m³ to 50,000 m³, and has provided acoustic emission detection services for spherical tanks, long tube trailers, pressure vessels, etc. to customers in the petroleum, petrochemical, special equipment and other industries in and outside the province for many times.\n\na5a29d92d77a3042c7b90c1d263dc29a.jpg a36efa9b04b4f3e751f8d16b702a2fe7.jpg\n\nAcoustic emission testing of gas cylinders (left) Acoustic emission testing of natural gas pressure regulating stations (right)\n\nf338e95a2aabd7f8201d1192dbb5ed59.jpg 72d46190b0bdd9a48cd539f1d5b791aa.jpg\n\nAcoustic emission detection of spherical tank (left) Acoustic emission detection of ammonia synthesis tower (right)\n\nAcoustic emission detection technology is also widely used in the fields of electricity, material testing, metal processing, aerospace industry, transportation industry, etc. With people's deeper understanding of the theoretical research on sound sources and acoustic signal propagation, acoustic emission detection technology will usher in a new and higher level of application development prospects.",
      "json_metadata": "{\"tags\":[\"acoustic\"],\"links\":[\"https://www.aendt.com/blog/acoustic-emission-testing.html\"],\"app\":\"steemit/0.2\",\"format\":\"markdown\"}",
      "parent_author": "",
      "parent_permlink": "acoustic",
      "permlink": "acoustic-emission-testing-technology",
      "title": "Acoustic Emission Testing Technology"
    }
  ],
  "op_in_trx": 0,
  "timestamp": "2024-07-25T06:11:03",
  "trx_id": "f30565bd2cf2c8d4bbe64da5df9d75f5f7f3384f",
  "trx_in_block": 2,
  "virtual_op": 0
}2024/07/17 10:23:06
2024/07/17 10:23:06
| author | barrylee |
| permlink | bwm1-acoustic-wave-acoustic-emission-monitoring-system-for-bridges |
| voter | bluesniper |
| weight | 10000 (100.00%) |
| Transaction Info | Block #86916580/Trx 25023efc8a850f7365e3cfc3d19ae568e73ff182 |
View Raw JSON Data
{
  "block": 86916580,
  "op": [
    "vote",
    {
      "author": "barrylee",
      "permlink": "bwm1-acoustic-wave-acoustic-emission-monitoring-system-for-bridges",
      "voter": "bluesniper",
      "weight": 10000
    }
  ],
  "op_in_trx": 0,
  "timestamp": "2024-07-17T10:23:06",
  "trx_id": "25023efc8a850f7365e3cfc3d19ae568e73ff182",
  "trx_in_block": 2,
  "virtual_op": 0
}barryleepublished a new post: bwm1-acoustic-wave-acoustic-emission-monitoring-system-for-bridges2024/07/17 10:19:27
barryleepublished a new post: bwm1-acoustic-wave-acoustic-emission-monitoring-system-for-bridges
2024/07/17 10:19:27
| author | barrylee |
| body | @@ -73,32 +73,112 @@ troduction%0ABWM1 +%3Ca href=%22https://www.aendt.com/acoustic/products/p2/301.html%22%3Eacoustic emission monitoring syste @@ -170,33 +170,36 @@ onitoring system - +%3C/a%3E can be used for @@ -521,20 +521,86 @@ .png)%0A%0A%0A -BWM1 +%3Ca href=%22https://www.aendt.com/acoustic/products/p2/301.html%22%3EBWM1%3C/a%3E adopts @@ -4891,16 +4891,71 @@ 6.png)%0A%0A +%3Ca href=%22https://www.aendt.com/acoustic/solutions/s3/%22%3E Storage @@ -4969,16 +4969,20 @@ spection +%3C/a%3E %0A%0A%0A!%5Bbwm |
| json metadata | {"image":["https://cdn.steemitimages.com/DQmetahXxnxDtrEDq13LRqkvTaPyhR8FAVSci2SkEXbuvFe/bwm1.png","https://cdn.steemitimages.com/DQmTEuE3B4yo6VAWmyJDQCKLLigqFNsvgpeUmBpjqSG21cV/bwm4.png","https://cdn.steemitimages.com/DQmSA63ruRwFJkRtDtySjkzYH1YCJQKksYc9XMbdWBSLmsT/bwm6.png","https://cdn.steemitimages.com/DQmT5Nm2MajkFzDxKUsY3i1tZEx1q7Nh1fk8SaS84pMCHVC/bwm8.png","https://cdn.steemitimages.com/DQmZgGZSeipMPw9cT9domTWpamtfs57ArHD6VzQnvrN2sar/bwm9.png","https://cdn.steemitimages.com/DQmTktmwocMTVYvrYBVxcw7z5cWj2PUmXzJZDNYCbik2mEE/bwm10.png","https://cdn.steemitimages.com/DQmYc6LMVkDL7KWdctMsrChkQpD9vHjQ6qXGc3ktaTMF1nG/bwm11.png","https://cdn.steemitimages.com/DQmP1ad4XTDuTSrc4526MMapPMZJTB6ko3Jb5oeu1jh6av2/bwm12.png","https://cdn.steemitimages.com/DQmPvEyyhBD3fDTMKineX4Wd4AiW2AoikccYNt7euZBu4nS/bwm13.png","https://cdn.steemitimages.com/DQmY8gWm8kE7a32ejbZWhhrbcyXi69fQhV1J89Hfc389aJe/bwm14.png","https://cdn.steemitimages.com/DQmVKSkQU66B1guydgrqhTznhJgCWbRvG3P5ayiD1jZZ61k/bwm16.png","https://cdn.steemitimages.com/DQmPVUfAw9fPa3rRRUXvZJMPLTR6dmyGKCxNrh58WCaACEi/bwm17.png","https://cdn.steemitimages.com/DQmVHdkTBjCCnsKX4ZDrCXq9FFVsc9UW2XRb74oN5gBUCDQ/bwm7.png"],"app":"steemit/0.2","format":"markdown","links":["https://www.aendt.com/acoustic/products/p2/301.html","https://www.aendt.com/acoustic/solutions/s3/"]} |
| parent author | |
| parent permlink | bridge |
| permlink | bwm1-acoustic-wave-acoustic-emission-monitoring-system-for-bridges |
| title | BWM1 Acoustic Wave (Acoustic Emission) Monitoring System for Bridges |
| Transaction Info | Block #86916508/Trx 069091ace7b17f7b11f94248454182493df71a15 |
View Raw JSON Data
{
  "block": 86916508,
  "op": [
    "comment",
    {
      "author": "barrylee",
      "body": "@@ -73,32 +73,112 @@\n troduction%0ABWM1 \n+%3Ca href=%22https://www.aendt.com/acoustic/products/p2/301.html%22%3Eacoustic emission \n monitoring syste\n@@ -170,33 +170,36 @@\n onitoring system\n- \n+%3C/a%3E\n can be used for \n@@ -521,20 +521,86 @@\n .png)%0A%0A%0A\n-BWM1\n+%3Ca href=%22https://www.aendt.com/acoustic/products/p2/301.html%22%3EBWM1%3C/a%3E\n  adopts \n@@ -4891,16 +4891,71 @@\n 6.png)%0A%0A\n+%3Ca href=%22https://www.aendt.com/acoustic/solutions/s3/%22%3E\n Storage \n@@ -4969,16 +4969,20 @@\n spection\n+%3C/a%3E\n %0A%0A%0A!%5Bbwm\n",
      "json_metadata": "{\"image\":[\"https://cdn.steemitimages.com/DQmetahXxnxDtrEDq13LRqkvTaPyhR8FAVSci2SkEXbuvFe/bwm1.png\",\"https://cdn.steemitimages.com/DQmTEuE3B4yo6VAWmyJDQCKLLigqFNsvgpeUmBpjqSG21cV/bwm4.png\",\"https://cdn.steemitimages.com/DQmSA63ruRwFJkRtDtySjkzYH1YCJQKksYc9XMbdWBSLmsT/bwm6.png\",\"https://cdn.steemitimages.com/DQmT5Nm2MajkFzDxKUsY3i1tZEx1q7Nh1fk8SaS84pMCHVC/bwm8.png\",\"https://cdn.steemitimages.com/DQmZgGZSeipMPw9cT9domTWpamtfs57ArHD6VzQnvrN2sar/bwm9.png\",\"https://cdn.steemitimages.com/DQmTktmwocMTVYvrYBVxcw7z5cWj2PUmXzJZDNYCbik2mEE/bwm10.png\",\"https://cdn.steemitimages.com/DQmYc6LMVkDL7KWdctMsrChkQpD9vHjQ6qXGc3ktaTMF1nG/bwm11.png\",\"https://cdn.steemitimages.com/DQmP1ad4XTDuTSrc4526MMapPMZJTB6ko3Jb5oeu1jh6av2/bwm12.png\",\"https://cdn.steemitimages.com/DQmPvEyyhBD3fDTMKineX4Wd4AiW2AoikccYNt7euZBu4nS/bwm13.png\",\"https://cdn.steemitimages.com/DQmY8gWm8kE7a32ejbZWhhrbcyXi69fQhV1J89Hfc389aJe/bwm14.png\",\"https://cdn.steemitimages.com/DQmVKSkQU66B1guydgrqhTznhJgCWbRvG3P5ayiD1jZZ61k/bwm16.png\",\"https://cdn.steemitimages.com/DQmPVUfAw9fPa3rRRUXvZJMPLTR6dmyGKCxNrh58WCaACEi/bwm17.png\",\"https://cdn.steemitimages.com/DQmVHdkTBjCCnsKX4ZDrCXq9FFVsc9UW2XRb74oN5gBUCDQ/bwm7.png\"],\"app\":\"steemit/0.2\",\"format\":\"markdown\",\"links\":[\"https://www.aendt.com/acoustic/products/p2/301.html\",\"https://www.aendt.com/acoustic/solutions/s3/\"]}",
      "parent_author": "",
      "parent_permlink": "bridge",
      "permlink": "bwm1-acoustic-wave-acoustic-emission-monitoring-system-for-bridges",
      "title": "BWM1 Acoustic Wave (Acoustic Emission) Monitoring System for Bridges"
    }
  ],
  "op_in_trx": 0,
  "timestamp": "2024-07-17T10:19:27",
  "trx_id": "069091ace7b17f7b11f94248454182493df71a15",
  "trx_in_block": 5,
  "virtual_op": 0
}barryleepublished a new post: bwm1-acoustic-wave-acoustic-emission-monitoring-system-for-bridges2024/07/17 10:17:48
barryleepublished a new post: bwm1-acoustic-wave-acoustic-emission-monitoring-system-for-bridges
2024/07/17 10:17:48
| author | barrylee |
| body | BWM1 Acoustic Wave (Acoustic Emission) Monitoring System for Bridges Introduction BWM1 monitoring system can be used for wires breaks monitoring of bridge cables, such as suspension bridges, cable-stayed bridges and tied-arch bridges, etc. 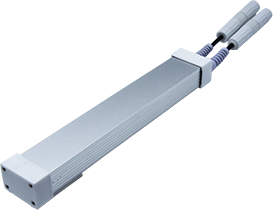 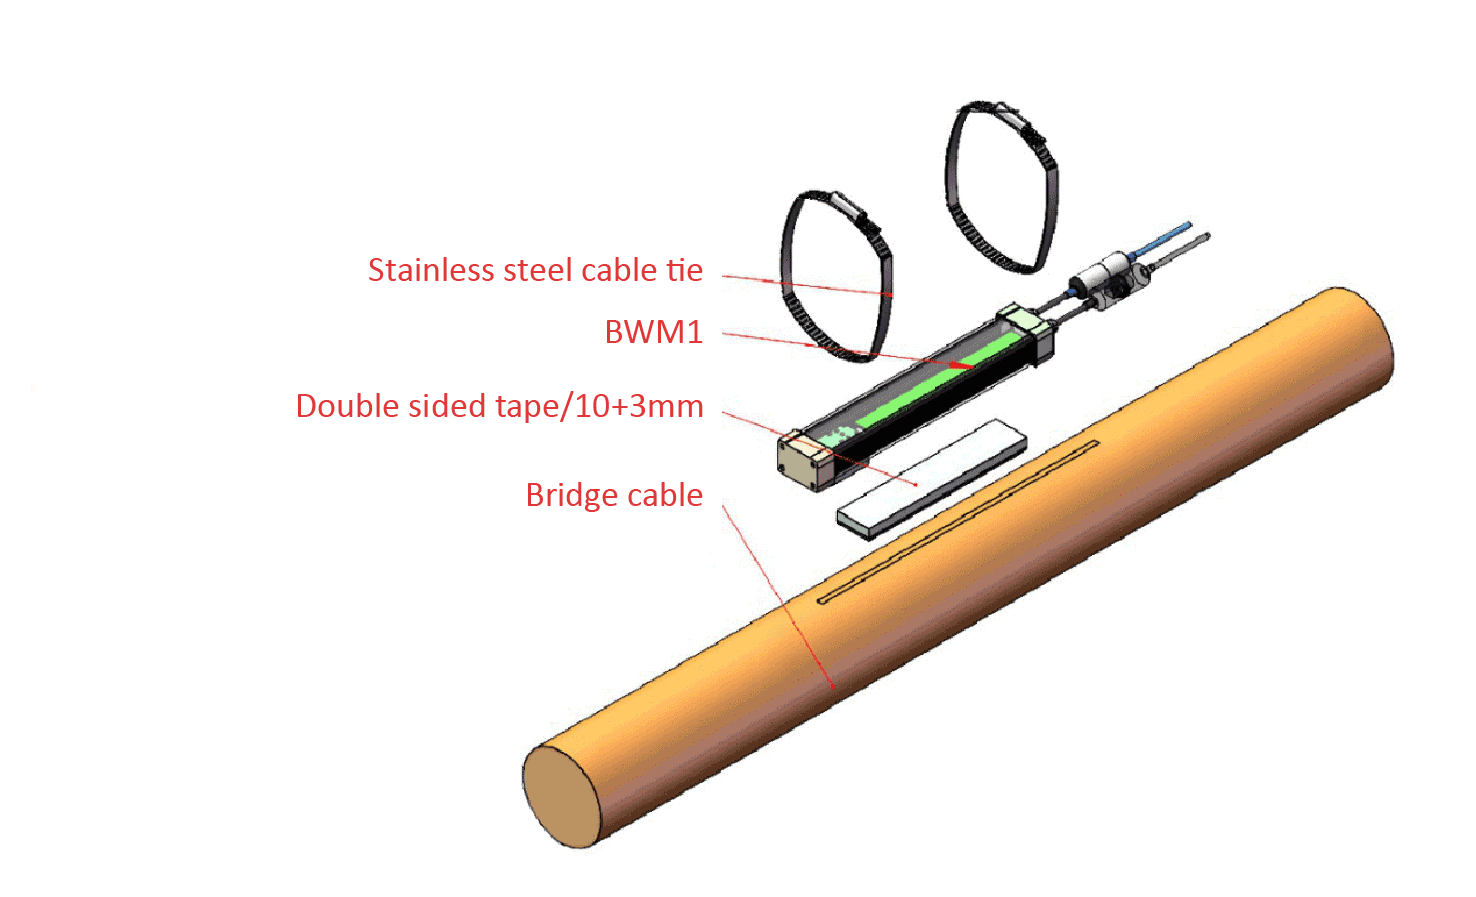 BWM1 adopts ARM system architecture, embedded A/D conversion circuit, filtering and conditioning circuit, preamplifier circuit, network port communication, which can be connected to the cloud platform through the router. The POE network cable provides communication link and power supply for BWM1. The acquisition unit is a bandage structure design integrated with the preamplifier circuit board. 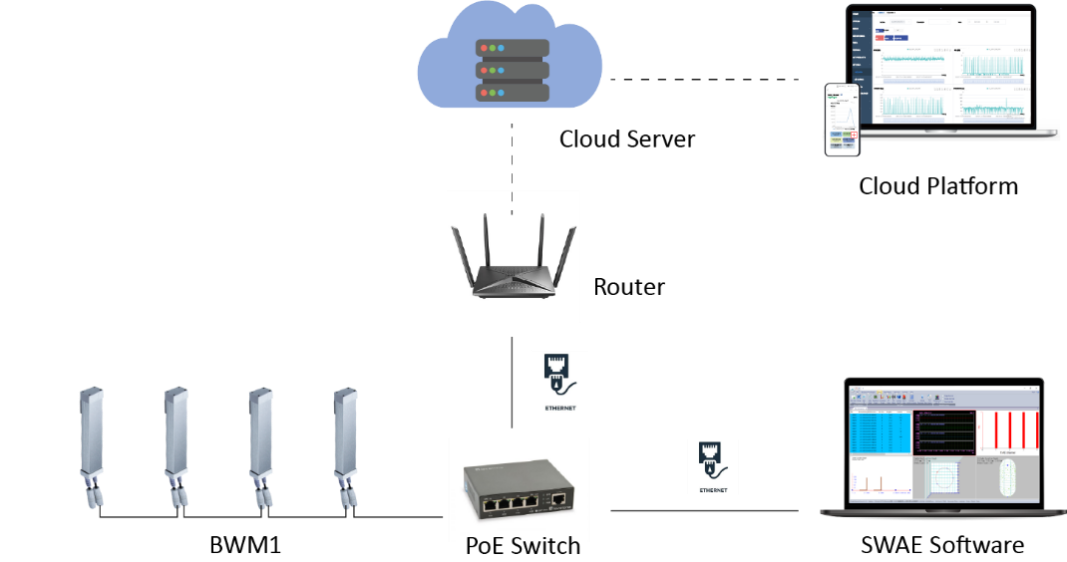 BWM1 can be networked by switches, which are connected to routers to form a large bridge monitoring system Qingcheng Cloud Platform The data can be uploaded to the cloud IoT platform (Qingcheng Cloud Platform) for display and analysis. AE characteristic parameters: arrival time, amplitude, ringing counts, energy, rise time, duration, RMS, ASL. 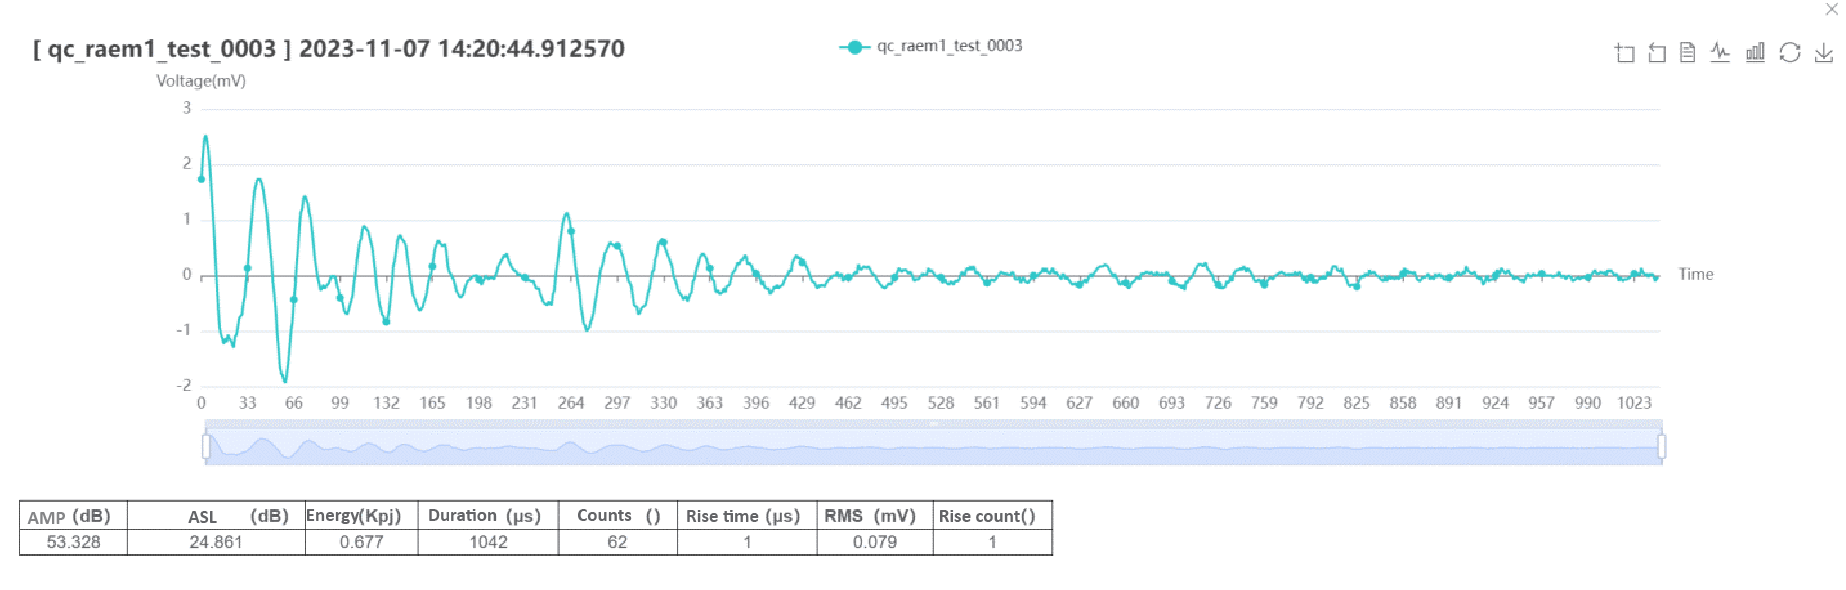 Remote configuration: remotely configuring parameters, controlling start and stop of device, timing configuration and wire breakage rating settings. 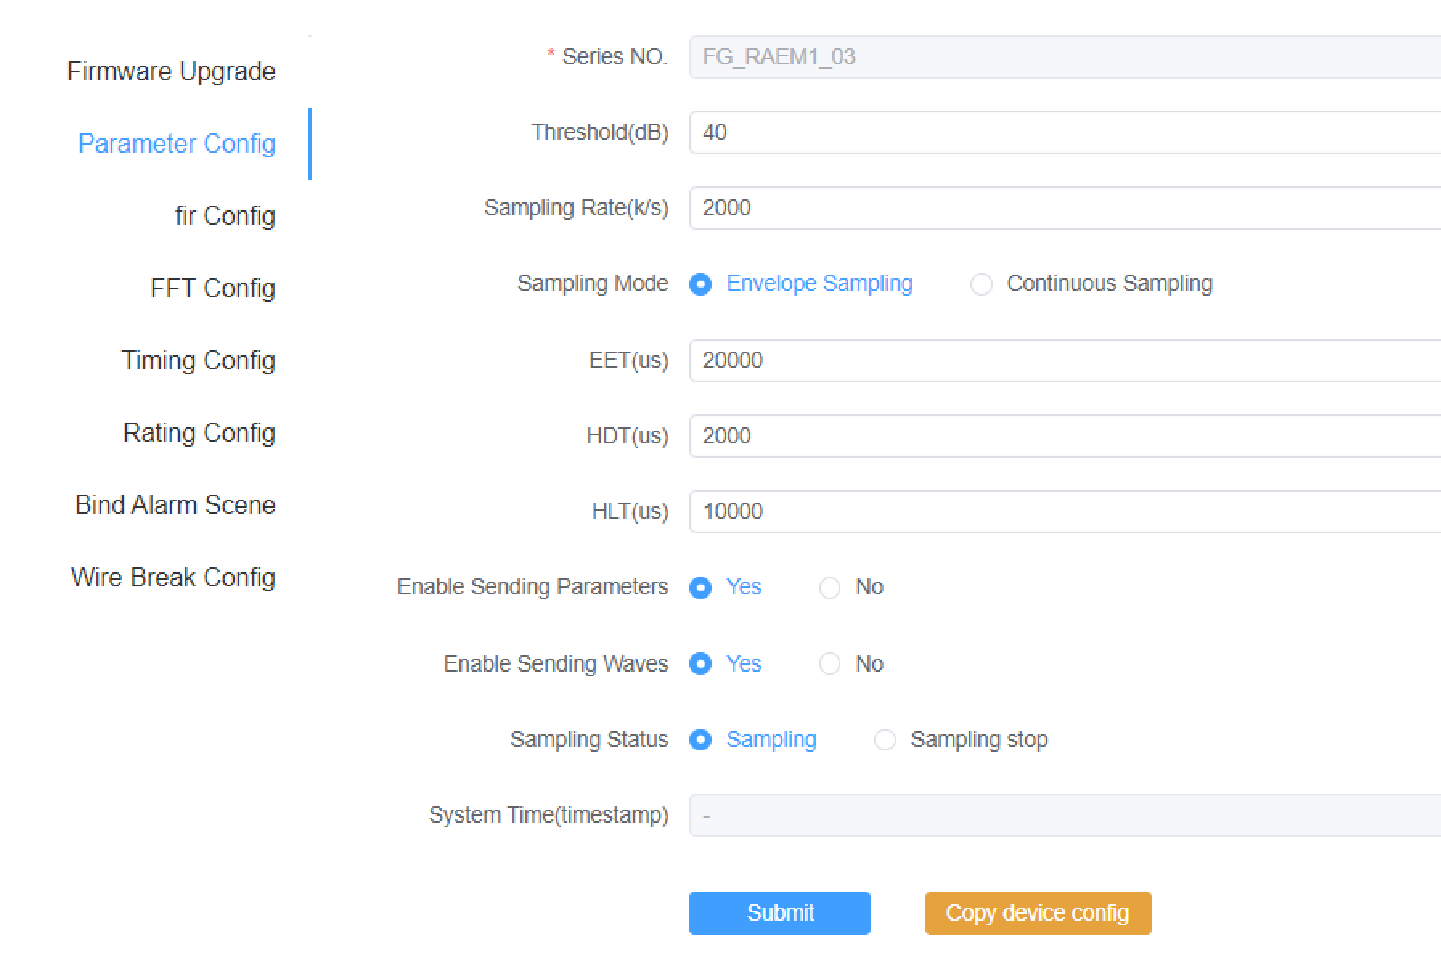 Rating function: automatic rating system, remotely viewing rating results. Acoustic emission data adopts automatic classification algorithm, intensity level, activity level and comprehensive level are obtained from acoustic emission hit parameters, which can be flexibly set to meet the rating needs of different industry standards. 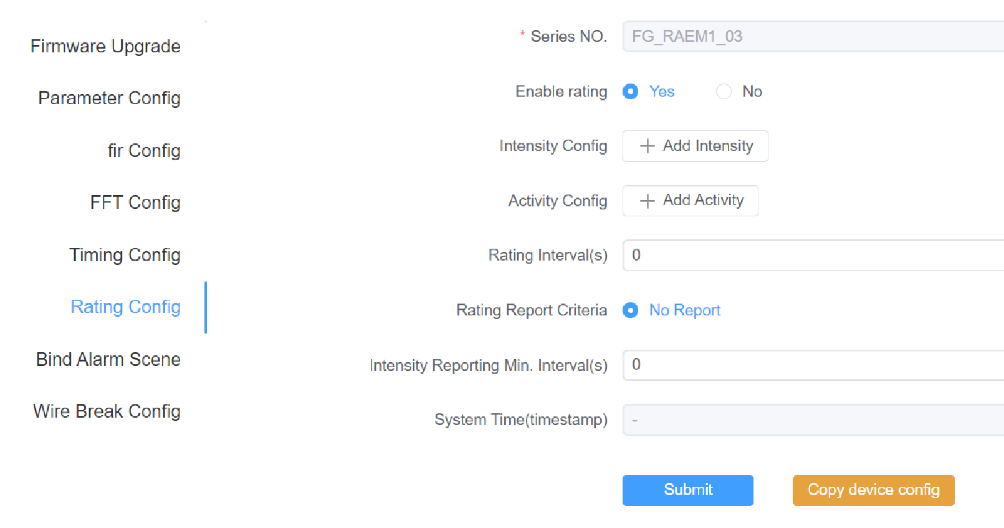 Rating parameters: hits, duration, rise time, rise count, ringing count, amplitude, ASL, RMS, energy. SWAE Software Data could be downloaded from cloud or send directly to SWAE software for in-depth analysis and processing. 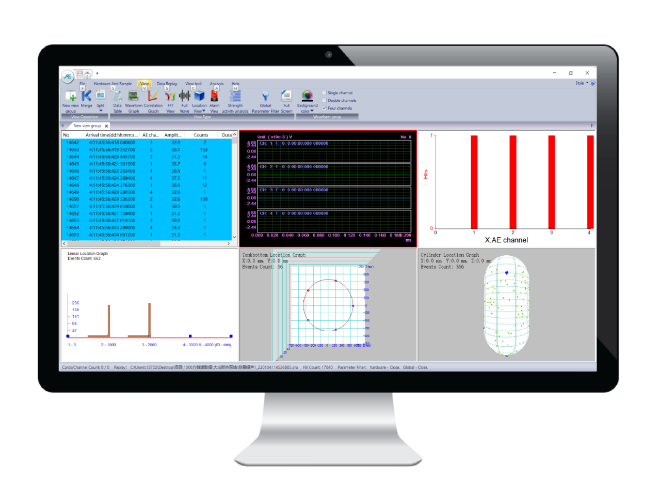 Positioning analysis, parameter analysis, correlation graph analysis, waveform analysis, Fast Fourier transform, wavelet transform rating analysis, etc. BWM1 Technical Specification: BWM1 Hardware technical specifications Channel Single channel or multi-channel combination Acquisition Mode Signal triggered / Time triggered Sampling Rate Maximum sampling rate of 2M points/second for single channel Sampling Precision 16-bit System Noise Better than 30dB Dynamic Range 70dB Input Bandwidth 10kHz-800kHz Analog Filters Combination of two high-pass filters at 30kHz and 125kHz, and two low-pass filters at 80kHz and 175kHz; default combinations are bandpass at 30kHz-80kHz or 125kHz-175kHz, fixed at the factory Digital Filters 256-order FIR filter, configurable as pass-through, high-pass, low-pass, or band-pass within the 0kHz~1000kHz frequency range Sensors Selectable center frequency of 40/150KHz; two built-in preamp gains of 20/40dB available Data Output Waveform, parameters, parameter ratings AE Parameters Arrival time, amplitude, counts, energy, rise time, duration, RMS, ASL Built-in SD Card Capacity 64GB (expandable to 512GB) Communication Method Ethernet Power Supply POE power supply Dimensions 507mm (including waterproof connector) * 50mm * 43mm Weight 285g Installation Strap (clamp) structure Protection Level IP67 Working Temperature -30℃ to +70℃ Single Node Wiring Distance Maximum of 400 meters of network cable for connecting up to 6 devices in series Main application BWM1 monitoring system can be used for wires breaks monitoring of bridge cables, such as suspension bridges, cable-stayed bridges and tied-arch bridges, etc.   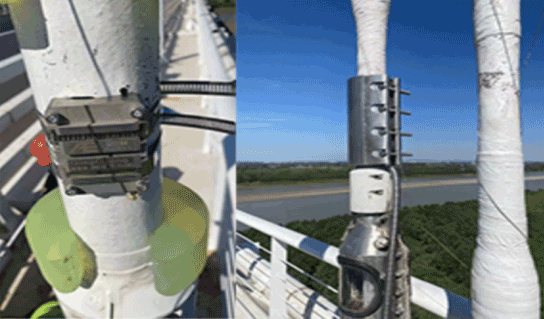 It can also be used in traditional acoustic emission detection scenarios such as storage tank inspection and pipeline inspection. Compared with traditional wiring connection method, series connection method is more reasonable and saves installation time. 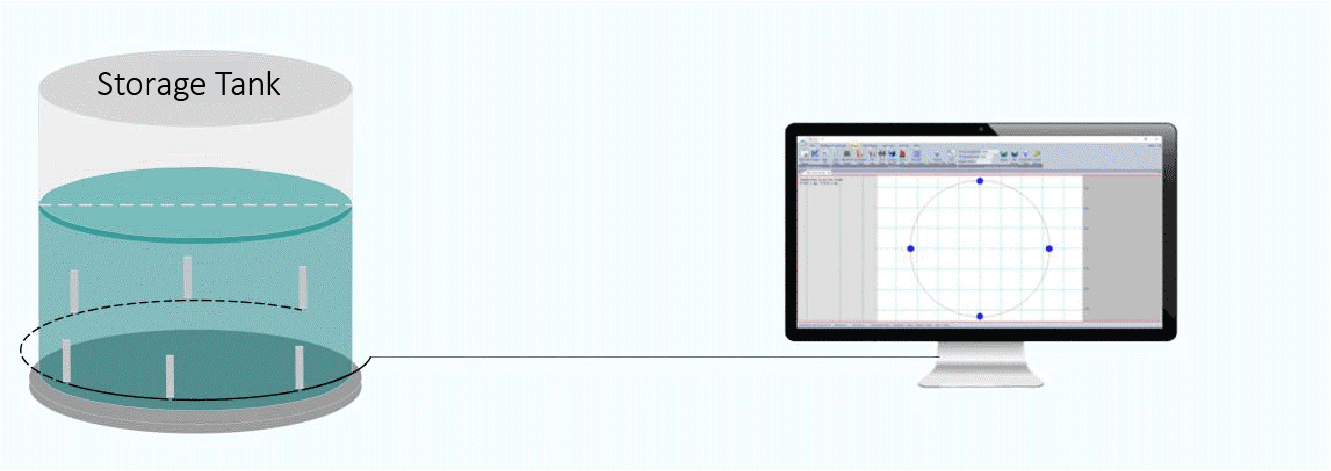 Storage tank inspection 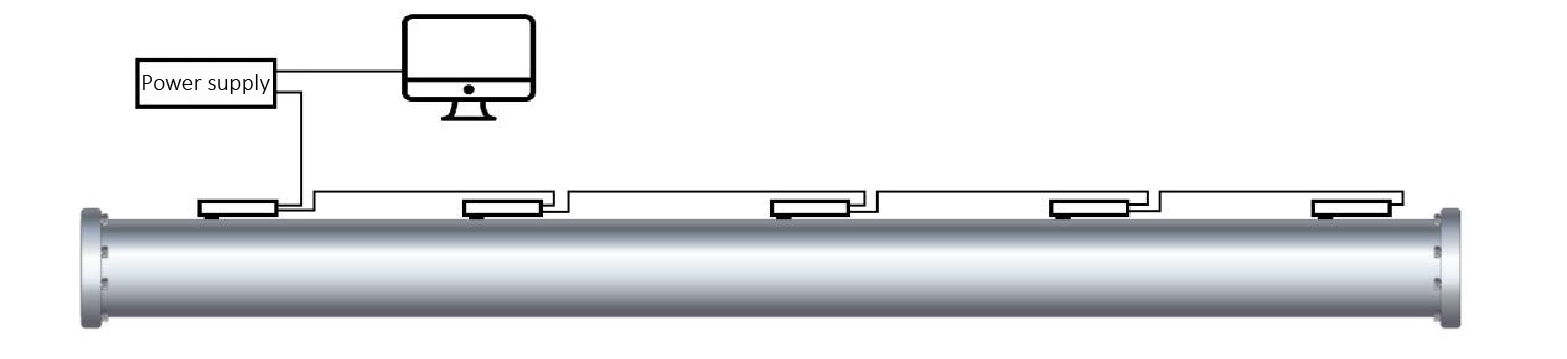 Pipeline inspection 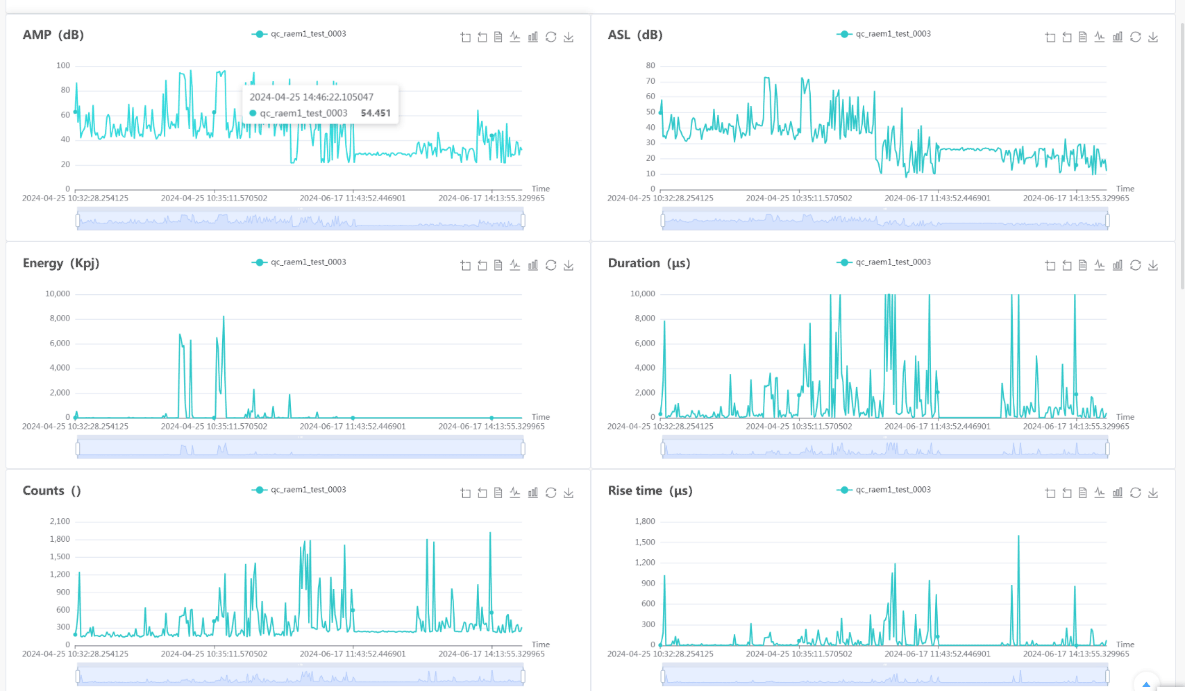 |
| json metadata | {"tags":["bridge"],"image":["https://cdn.steemitimages.com/DQmetahXxnxDtrEDq13LRqkvTaPyhR8FAVSci2SkEXbuvFe/bwm1.png","https://cdn.steemitimages.com/DQmTEuE3B4yo6VAWmyJDQCKLLigqFNsvgpeUmBpjqSG21cV/bwm4.png","https://cdn.steemitimages.com/DQmSA63ruRwFJkRtDtySjkzYH1YCJQKksYc9XMbdWBSLmsT/bwm6.png","https://cdn.steemitimages.com/DQmT5Nm2MajkFzDxKUsY3i1tZEx1q7Nh1fk8SaS84pMCHVC/bwm8.png","https://cdn.steemitimages.com/DQmZgGZSeipMPw9cT9domTWpamtfs57ArHD6VzQnvrN2sar/bwm9.png","https://cdn.steemitimages.com/DQmTktmwocMTVYvrYBVxcw7z5cWj2PUmXzJZDNYCbik2mEE/bwm10.png","https://cdn.steemitimages.com/DQmYc6LMVkDL7KWdctMsrChkQpD9vHjQ6qXGc3ktaTMF1nG/bwm11.png","https://cdn.steemitimages.com/DQmP1ad4XTDuTSrc4526MMapPMZJTB6ko3Jb5oeu1jh6av2/bwm12.png","https://cdn.steemitimages.com/DQmPvEyyhBD3fDTMKineX4Wd4AiW2AoikccYNt7euZBu4nS/bwm13.png","https://cdn.steemitimages.com/DQmY8gWm8kE7a32ejbZWhhrbcyXi69fQhV1J89Hfc389aJe/bwm14.png","https://cdn.steemitimages.com/DQmVKSkQU66B1guydgrqhTznhJgCWbRvG3P5ayiD1jZZ61k/bwm16.png","https://cdn.steemitimages.com/DQmPVUfAw9fPa3rRRUXvZJMPLTR6dmyGKCxNrh58WCaACEi/bwm17.png","https://cdn.steemitimages.com/DQmVHdkTBjCCnsKX4ZDrCXq9FFVsc9UW2XRb74oN5gBUCDQ/bwm7.png"],"app":"steemit/0.2","format":"markdown"} |
| parent author | |
| parent permlink | bridge |
| permlink | bwm1-acoustic-wave-acoustic-emission-monitoring-system-for-bridges |
| title | BWM1 Acoustic Wave (Acoustic Emission) Monitoring System for Bridges |
| Transaction Info | Block #86916475/Trx b68b35e940ae0139bed293478084ab9c59310eff |
View Raw JSON Data
{
"block": 86916475,
"op": [
"comment",
{
"author": "barrylee",
"body": "BWM1 Acoustic Wave (Acoustic Emission) Monitoring System for Bridges\n\nIntroduction\nBWM1 monitoring system can be used for wires breaks monitoring of bridge cables, such as suspension bridges, cable-stayed bridges and tied-arch bridges, etc.\n\n\n\n\n\n\nBWM1 adopts ARM system architecture, embedded A/D conversion circuit, filtering and conditioning circuit, preamplifier circuit, network port communication, which can be connected to the cloud platform through the router. The POE network cable provides communication link and power supply for BWM1. The acquisition unit is a bandage structure design integrated with the preamplifier circuit board.\n\n\n\n\nBWM1 can be networked by switches, which are connected to routers to form a large bridge monitoring system\n\n\nQingcheng Cloud Platform\n The data can be uploaded to the cloud IoT platform (Qingcheng Cloud Platform) for display and analysis.\n\n\n AE characteristic parameters: arrival time, amplitude, ringing counts, energy, rise time, duration, RMS, ASL.\n\n\n\n\n Remote configuration: remotely configuring parameters, controlling start and stop of device, timing configuration and wire breakage rating settings.\n\n\n\n\n Rating function: automatic rating system, remotely viewing rating results.\nAcoustic emission data adopts automatic classification algorithm, intensity level, activity level and comprehensive level are obtained from acoustic emission hit parameters, which can be flexibly set to meet the rating needs of different industry standards.\n\n\n\n\n Rating parameters: hits, duration, rise time, rise count, ringing count, amplitude, ASL, RMS, energy.\nSWAE Software\nData could be downloaded from cloud or send directly to SWAE software for in-depth analysis and processing.\n\n\n\n\n Positioning analysis, parameter analysis, correlation graph analysis, waveform analysis, Fast Fourier transform, wavelet transform rating analysis, etc.\nBWM1\n\nTechnical Specification:\nBWM1 Hardware technical specifications\n\nChannel\tSingle channel or multi-channel combination\nAcquisition Mode\tSignal triggered / Time triggered\nSampling Rate\tMaximum sampling rate of 2M points/second for single channel\nSampling Precision\t16-bit\nSystem Noise\tBetter than 30dB\nDynamic Range\t70dB\nInput Bandwidth\t10kHz-800kHz\nAnalog Filters\tCombination of two high-pass filters at 30kHz and 125kHz, and two low-pass filters at 80kHz and 175kHz; default combinations are bandpass at 30kHz-80kHz or 125kHz-175kHz, fixed at the factory\nDigital Filters\t256-order FIR filter, configurable as pass-through, high-pass, low-pass, or band-pass within the 0kHz~1000kHz frequency range\nSensors\tSelectable center frequency of 40/150KHz; two built-in preamp gains of 20/40dB available\nData Output\tWaveform, parameters, parameter ratings\nAE Parameters\tArrival time, amplitude, counts, energy, rise time, duration, RMS, ASL\nBuilt-in SD Card Capacity\t64GB (expandable to 512GB)\nCommunication Method\tEthernet\nPower Supply\tPOE power supply\nDimensions\t507mm (including waterproof connector) * 50mm * 43mm\nWeight\t285g\nInstallation\tStrap (clamp) structure\nProtection Level\tIP67\nWorking Temperature\t-30℃ to +70℃\nSingle Node Wiring Distance\tMaximum of 400 meters of network cable for connecting up to 6 devices in series\nMain application\nBWM1 monitoring system can be used for wires breaks monitoring of bridge cables, such as suspension bridges, cable-stayed bridges and tied-arch bridges, etc.\n\n\n\n\n\n\n\n\n\nIt can also be used in traditional acoustic emission detection scenarios such as storage tank inspection and pipeline inspection. Compared with traditional wiring connection method, series connection method is more reasonable and saves installation time.\n\n\n\n\n\nStorage tank inspection\n\n\n\n\nPipeline inspection\n",
"json_metadata": "{\"tags\":[\"bridge\"],\"image\":[\"https://cdn.steemitimages.com/DQmetahXxnxDtrEDq13LRqkvTaPyhR8FAVSci2SkEXbuvFe/bwm1.png\",\"https://cdn.steemitimages.com/DQmTEuE3B4yo6VAWmyJDQCKLLigqFNsvgpeUmBpjqSG21cV/bwm4.png\",\"https://cdn.steemitimages.com/DQmSA63ruRwFJkRtDtySjkzYH1YCJQKksYc9XMbdWBSLmsT/bwm6.png\",\"https://cdn.steemitimages.com/DQmT5Nm2MajkFzDxKUsY3i1tZEx1q7Nh1fk8SaS84pMCHVC/bwm8.png\",\"https://cdn.steemitimages.com/DQmZgGZSeipMPw9cT9domTWpamtfs57ArHD6VzQnvrN2sar/bwm9.png\",\"https://cdn.steemitimages.com/DQmTktmwocMTVYvrYBVxcw7z5cWj2PUmXzJZDNYCbik2mEE/bwm10.png\",\"https://cdn.steemitimages.com/DQmYc6LMVkDL7KWdctMsrChkQpD9vHjQ6qXGc3ktaTMF1nG/bwm11.png\",\"https://cdn.steemitimages.com/DQmP1ad4XTDuTSrc4526MMapPMZJTB6ko3Jb5oeu1jh6av2/bwm12.png\",\"https://cdn.steemitimages.com/DQmPvEyyhBD3fDTMKineX4Wd4AiW2AoikccYNt7euZBu4nS/bwm13.png\",\"https://cdn.steemitimages.com/DQmY8gWm8kE7a32ejbZWhhrbcyXi69fQhV1J89Hfc389aJe/bwm14.png\",\"https://cdn.steemitimages.com/DQmVKSkQU66B1guydgrqhTznhJgCWbRvG3P5ayiD1jZZ61k/bwm16.png\",\"https://cdn.steemitimages.com/DQmPVUfAw9fPa3rRRUXvZJMPLTR6dmyGKCxNrh58WCaACEi/bwm17.png\",\"https://cdn.steemitimages.com/DQmVHdkTBjCCnsKX4ZDrCXq9FFVsc9UW2XRb74oN5gBUCDQ/bwm7.png\"],\"app\":\"steemit/0.2\",\"format\":\"markdown\"}",
"parent_author": "",
"parent_permlink": "bridge",
"permlink": "bwm1-acoustic-wave-acoustic-emission-monitoring-system-for-bridges",
"title": "BWM1 Acoustic Wave (Acoustic Emission) Monitoring System for Bridges"
}
],
"op_in_trx": 0,
"timestamp": "2024-07-17T10:17:48",
"trx_id": "b68b35e940ae0139bed293478084ab9c59310eff",
"trx_in_block": 4,
"virtual_op": 0
}bluesniperupvoted (100.00%) @barrylee / wire-breakage-monitoring-of-taipinghu-bridge2024/07/09 10:08:36
bluesniperupvoted (100.00%) @barrylee / wire-breakage-monitoring-of-taipinghu-bridge
2024/07/09 10:08:36
| author | barrylee |
| permlink | wire-breakage-monitoring-of-taipinghu-bridge |
| voter | bluesniper |
| weight | 10000 (100.00%) |
| Transaction Info | Block #86687134/Trx 430242f3eabdac674d05c758aff25b1dfb4b7808 |
View Raw JSON Data
{
  "block": 86687134,
  "op": [
    "vote",
    {
      "author": "barrylee",
      "permlink": "wire-breakage-monitoring-of-taipinghu-bridge",
      "voter": "bluesniper",
      "weight": 10000
    }
  ],
  "op_in_trx": 0,
  "timestamp": "2024-07-09T10:08:36",
  "trx_id": "430242f3eabdac674d05c758aff25b1dfb4b7808",
  "trx_in_block": 4,
  "virtual_op": 0
}barryleepublished a new post: wire-breakage-monitoring-of-taipinghu-bridge2024/07/09 10:05:57
barryleepublished a new post: wire-breakage-monitoring-of-taipinghu-bridge
2024/07/09 10:05:57
| author | barrylee |
| body | @@ -118,33 +118,202 @@ ime. -%0A%0AProject Overview%0A%0A + (%3Ca href=%22https://www.aendt.com/acoustic/solutions/s2/%22%3EWire breakage monitoring system of Bridge%3C/a%3E)%0A%0AProject Overview%0A%0A%3Ca href=%22https://www.aendt.com/acoustic/products/p2/158.html%22%3E RAME1 +%3C/a%3E wor @@ -331,14 +331,95 @@ the -sensor +%3Ca href=%22https://www.aendt.com/acoustic/products/Sensors/%22%3Eacoustic emission sensor%3C/a%3E rec @@ -735,17 +735,215 @@ tc.%0A%0A %0A%0A -%0A +!%5B2023_Vasco-da-Gama-bridge-471661746_5332x3333-scaled-1.jpg%5D(https://cdn.steemitimages.com/DQmaMRhakX7wDwV1Tp9MWdJbhkrAH7KqDVCW3WGL9Yzf2rF/2023_Vasco-da-Gama-bridge-471661746_5332x3333-scaled-1.jpg) %0A%0A %0A%0ASet @@ -2992,28 +2992,154 @@ r's health diagnosis system. +%0A!%5B1-2212011AR6393ss.jpg%5D(https://cdn.steemitimages.com/DQmZNsxPESRXhJSyDtdwr3di5XEfSgZSwssEd22Aad3cYje/1-2212011AR6393ss.jpg) |
| json metadata | {"app":"steemit/0.2","format":"markdown","image":["https://cdn.steemitimages.com/DQmaMRhakX7wDwV1Tp9MWdJbhkrAH7KqDVCW3WGL9Yzf2rF/2023_Vasco-da-Gama-bridge-471661746_5332x3333-scaled-1.jpg","https://cdn.steemitimages.com/DQmZNsxPESRXhJSyDtdwr3di5XEfSgZSwssEd22Aad3cYje/1-2212011AR6393ss.jpg"],"links":["https://www.aendt.com/acoustic/solutions/s2/","https://www.aendt.com/acoustic/products/p2/158.html","https://www.aendt.com/acoustic/products/Sensors/"]} |
| parent author | |
| parent permlink | bridemonitoring |
| permlink | wire-breakage-monitoring-of-taipinghu-bridge |
| title | Wire breakage monitoring of Taipinghu Bridge |
| Transaction Info | Block #86687081/Trx 75df886f2488828908ca25219c07c7e98bc4bc1d |
View Raw JSON Data
{
  "block": 86687081,
  "op": [
    "comment",
    {
      "author": "barrylee",
      "body": "@@ -118,33 +118,202 @@\n ime.\n-%0A%0AProject Overview%0A%0A\n+ (%3Ca href=%22https://www.aendt.com/acoustic/solutions/s2/%22%3EWire breakage monitoring system of Bridge%3C/a%3E)%0A%0AProject Overview%0A%0A%3Ca href=%22https://www.aendt.com/acoustic/products/p2/158.html%22%3E\n RAME1\n+%3C/a%3E\n  wor\n@@ -331,14 +331,95 @@\n the \n-sensor\n+%3Ca href=%22https://www.aendt.com/acoustic/products/Sensors/%22%3Eacoustic emission sensor%3C/a%3E\n  rec\n@@ -735,17 +735,215 @@\n tc.%0A%0A %0A%0A\n-%0A\n+!%5B2023_Vasco-da-Gama-bridge-471661746_5332x3333-scaled-1.jpg%5D(https://cdn.steemitimages.com/DQmaMRhakX7wDwV1Tp9MWdJbhkrAH7KqDVCW3WGL9Yzf2rF/2023_Vasco-da-Gama-bridge-471661746_5332x3333-scaled-1.jpg)\n %0A%0A %0A%0ASet\n@@ -2992,28 +2992,154 @@\n r's health diagnosis system.\n+%0A!%5B1-2212011AR6393ss.jpg%5D(https://cdn.steemitimages.com/DQmZNsxPESRXhJSyDtdwr3di5XEfSgZSwssEd22Aad3cYje/1-2212011AR6393ss.jpg)\n",
      "json_metadata": "{\"app\":\"steemit/0.2\",\"format\":\"markdown\",\"image\":[\"https://cdn.steemitimages.com/DQmaMRhakX7wDwV1Tp9MWdJbhkrAH7KqDVCW3WGL9Yzf2rF/2023_Vasco-da-Gama-bridge-471661746_5332x3333-scaled-1.jpg\",\"https://cdn.steemitimages.com/DQmZNsxPESRXhJSyDtdwr3di5XEfSgZSwssEd22Aad3cYje/1-2212011AR6393ss.jpg\"],\"links\":[\"https://www.aendt.com/acoustic/solutions/s2/\",\"https://www.aendt.com/acoustic/products/p2/158.html\",\"https://www.aendt.com/acoustic/products/Sensors/\"]}",
      "parent_author": "",
      "parent_permlink": "bridemonitoring",
      "permlink": "wire-breakage-monitoring-of-taipinghu-bridge",
      "title": "Wire breakage monitoring of Taipinghu Bridge"
    }
  ],
  "op_in_trx": 0,
  "timestamp": "2024-07-09T10:05:57",
  "trx_id": "75df886f2488828908ca25219c07c7e98bc4bc1d",
  "trx_in_block": 1,
  "virtual_op": 0
}barryleepublished a new post: wire-breakage-monitoring-of-taipinghu-bridge2024/07/09 10:03:00
barryleepublished a new post: wire-breakage-monitoring-of-taipinghu-bridge
2024/07/09 10:03:00
| author | barrylee |
| body | The broken wire of steel cable belongs to sudden signal and has no rules to follow, so it must be monitored in real time. Project Overview RAME1 working mode: the sensor receives the signal generated by the monitored cable steel wire fracture, and obtains the digital original waveform data through analog filtering and ad analog-to-digital conversion. Do alarm analysis and processing to get alarm status data. Data include: waveform, characteristic parameters, alarm parameters, etc. Setting, output content and mode of data acquisition and output of steel cable broken wire monitoring: Acquisition threshold: 3dB higher than the ambient noise, and the empirical value can be initially set to 60dB. The first alarm criterion: (the comprehensive criterion includes multi parameter fusion, threshold value, duration and other parameter values) is equal to the real signal exceeding the trigger threshold. The second criterion: the amplitude is higher than the real signal of bad situation noise, such as thunderstorm weather. The noise under bad conditions can be measured or initially determined as 80dB by experience. Output the alarm results, parameters, waveforms and other data to the cloud server (Alibaba cloud and Qingcheng self built cloud platform), in which the secondary alarm results are actively and directly pushed to the user's mobile phone, and the user can also query the cloud server (Alibaba cloud and Qingcheng self built cloud platform) at any time. The signal characteristics of environmental noise and bad situation noise can also be corrected through actual operation. For example, frequent alarm, after verification, it is likely that the noise signal is set too low, and the noise trigger and alarm threshold are improved. The alarm criterion (data fusion setting, multi parameter criterion setting) and trigger threshold can be adjusted continuously, and finally only the wire breaking signal will give an alarm, so as to realize unattended and accurate wire breaking monitoring and alarm. The monitoring data of broken wire of acoustic emission steel wire rope can also be added to the customer's health diagnosis system. The alarm criterion (data fusion setting, multi parameter criterion setting) and trigger threshold can be adjusted continuously, and finally only the wire breaking signal will give an alarm, so as to realize unattended and accurate wire breaking monitoring and alarm. The monitoring data of broken wire of acoustic emission steel wire rope can also be added to the customer's health diagnosis system. |
| json metadata | {"tags":["bridemonitoring"],"app":"steemit/0.2","format":"markdown"} |
| parent author | |
| parent permlink | bridemonitoring |
| permlink | wire-breakage-monitoring-of-taipinghu-bridge |
| title | Wire breakage monitoring of Taipinghu Bridge |
| Transaction Info | Block #86687023/Trx 8c21af883cf557a0b414e0711bdbb5b56d69e373 |
View Raw JSON Data
{
  "block": 86687023,
  "op": [
    "comment",
    {
      "author": "barrylee",
      "body": "The broken wire of steel cable belongs to sudden signal and has no rules to follow, so it must be monitored in real time.\n\nProject Overview\n\nRAME1 working mode: the sensor receives the signal generated by the monitored cable steel wire fracture, and obtains the digital original waveform data through analog filtering and ad analog-to-digital conversion. Do alarm analysis and processing to get alarm status data. Data include: waveform, characteristic parameters, alarm parameters, etc.\n\n \n\n\n\n\n \n\nSetting, output content and mode of data acquisition and output of steel cable broken wire monitoring:\n \nAcquisition threshold: 3dB higher than the ambient noise, and the empirical value can be initially set to 60dB.\n \nThe first alarm criterion: (the comprehensive criterion includes multi parameter fusion, threshold value, duration and other parameter values) is equal to the real signal exceeding the trigger threshold.\n \nThe second criterion: the amplitude is higher than the real signal of bad situation noise, such as thunderstorm weather. The noise under bad conditions can be measured or initially determined as 80dB by experience. Output the alarm results, parameters, waveforms and other data to the cloud server (Alibaba cloud and Qingcheng self built cloud platform), in which the secondary alarm results are actively and directly pushed to the user's mobile phone, and the user can also query the cloud server (Alibaba cloud and Qingcheng self built cloud platform) at any time.\n\nThe signal characteristics of environmental noise and bad situation noise can also be corrected through actual operation. For example, frequent alarm, after verification, it is likely that the noise signal is set too low, and the noise trigger and alarm threshold are improved. The alarm criterion (data fusion setting, multi parameter criterion setting) and trigger threshold can be adjusted continuously, and finally only the wire breaking signal will give an alarm, so as to realize unattended and accurate wire breaking monitoring and alarm. The monitoring data of broken wire of acoustic emission steel wire rope can also be added to the customer's health diagnosis system.\n\nThe alarm criterion (data fusion setting, multi parameter criterion setting) and trigger threshold can be adjusted continuously, and finally only the wire breaking signal will give an alarm, so as to realize unattended and accurate wire breaking monitoring and alarm. The monitoring data of broken wire of acoustic emission steel wire rope can also be added to the customer's health diagnosis system.",
      "json_metadata": "{\"tags\":[\"bridemonitoring\"],\"app\":\"steemit/0.2\",\"format\":\"markdown\"}",
      "parent_author": "",
      "parent_permlink": "bridemonitoring",
      "permlink": "wire-breakage-monitoring-of-taipinghu-bridge",
      "title": "Wire breakage monitoring of Taipinghu Bridge"
    }
  ],
  "op_in_trx": 0,
  "timestamp": "2024-07-09T10:03:00",
  "trx_id": "8c21af883cf557a0b414e0711bdbb5b56d69e373",
  "trx_in_block": 3,
  "virtual_op": 0
}bluesniperupvoted (100.00%) @barrylee / acoustic-emission-testing-an-in-depth-guide-new-for-20242024/06/25 10:17:36
bluesniperupvoted (100.00%) @barrylee / acoustic-emission-testing-an-in-depth-guide-new-for-2024
2024/06/25 10:17:36
| author | barrylee |
| permlink | acoustic-emission-testing-an-in-depth-guide-new-for-2024 |
| voter | bluesniper |
| weight | 10000 (100.00%) |
| Transaction Info | Block #86285448/Trx 0ec194409e7e1f1eb78e46e5ee7993be8dec6839 |
View Raw JSON Data
{
  "block": 86285448,
  "op": [
    "vote",
    {
      "author": "barrylee",
      "permlink": "acoustic-emission-testing-an-in-depth-guide-new-for-2024",
      "voter": "bluesniper",
      "weight": 10000
    }
  ],
  "op_in_trx": 0,
  "timestamp": "2024-06-25T10:17:36",
  "trx_id": "0ec194409e7e1f1eb78e46e5ee7993be8dec6839",
  "trx_in_block": 0,
  "virtual_op": 0
}barryleepublished a new post: acoustic-emission-testing-an-in-depth-guide-new-for-20242024/06/25 10:14:21
barryleepublished a new post: acoustic-emission-testing-an-in-depth-guide-new-for-2024
2024/06/25 10:14:21
| author | barrylee |
| body | @@ -732,16 +732,48 @@ Emerson%0A +%3Ca href=%22https://www.aendt.com%22%3E Qawrums @@ -775,16 +775,20 @@ rums Ltd +%3C/a%3E %0AHexagon @@ -842,24 +842,92 @@ yd%0A%0AWhat Is +%3Ca href=%22https://www.aendt.com/blog/acoustic-emission-testing.html%22%3E Acoustic Emi @@ -939,16 +939,20 @@ Testing +%3C/a%3E ?%0AAcoust |
| json metadata | {"app":"steemit/0.2","format":"markdown","links":["https://www.aendt.com","https://www.aendt.com/blog/acoustic-emission-testing.html"]} |
| parent author | |
| parent permlink | acousticemission |
| permlink | acoustic-emission-testing-an-in-depth-guide-new-for-2024 |
| title | Acoustic Emission Testing: An In-Depth Guide [New for 2024] |
| Transaction Info | Block #86285383/Trx d5bda1a17a4731561b931f5564e0bed7de130b5a |
View Raw JSON Data
{
  "block": 86285383,
  "op": [
    "comment",
    {
      "author": "barrylee",
      "body": "@@ -732,16 +732,48 @@\n Emerson%0A\n+%3Ca href=%22https://www.aendt.com%22%3E\n Qawrums \n@@ -775,16 +775,20 @@\n rums Ltd\n+%3C/a%3E\n %0AHexagon\n@@ -842,24 +842,92 @@\n yd%0A%0AWhat Is \n+%3Ca href=%22https://www.aendt.com/blog/acoustic-emission-testing.html%22%3E\n Acoustic Emi\n@@ -939,16 +939,20 @@\n  Testing\n+%3C/a%3E\n ?%0AAcoust\n",
      "json_metadata": "{\"app\":\"steemit/0.2\",\"format\":\"markdown\",\"links\":[\"https://www.aendt.com\",\"https://www.aendt.com/blog/acoustic-emission-testing.html\"]}",
      "parent_author": "",
      "parent_permlink": "acousticemission",
      "permlink": "acoustic-emission-testing-an-in-depth-guide-new-for-2024",
      "title": "Acoustic Emission Testing: An In-Depth Guide [New for 2024]"
    }
  ],
  "op_in_trx": 0,
  "timestamp": "2024-06-25T10:14:21",
  "trx_id": "d5bda1a17a4731561b931f5564e0bed7de130b5a",
  "trx_in_block": 3,
  "virtual_op": 0
}barryleepublished a new post: acoustic-emission-testing-an-in-depth-guide-new-for-20242024/06/25 10:12:51
barryleepublished a new post: acoustic-emission-testing-an-in-depth-guide-new-for-2024
2024/06/25 10:12:51
| author | barrylee |
| body | @@ -1,8 +1,817 @@ +Global Acoustic Emission (AE) Equipment Market: Segment Analysis%0A%0AThe research report includes specific segments by region (country), by manufacturers, by Type and by Application. Each type provides information about the production during the forecast period of 2023 to 2032. by Application segment also provides consumption during the forecast period of 2023 to 2032. Understanding the segments helps in identifying the importance of different factors that aid the market growth.%0A%0AAcoustic Emission (AE) Equipment Market Segmentation By Type:%0A%0ATesting Equipment%0AData Acquisition Equipment%0AAnalysis Equipment%0AOthers%0A%0AAcoustic Emission (AE) Equipment Market Segmentation By Application:%0A%0AMISTRAS Group%0AQingcheng Ltd.%0AVallen Systeme%0AEmerson%0AQawrums Ltd%0AHexagon Digital Wave%0APhysical Acoustics%0AKitiwake Holroyd%0A%0A What Is @@ -1681,53 +1681,8 @@ e.%0A%0A -acoustic-emission-testing-nasa%0A%0ACredit: NASA%0A %0APri |
| json metadata | {"app":"steemit/0.2","format":"markdown"} |
| parent author | |
| parent permlink | acousticemission |
| permlink | acoustic-emission-testing-an-in-depth-guide-new-for-2024 |
| title | Acoustic Emission Testing: An In-Depth Guide [New for 2024] |
| Transaction Info | Block #86285354/Trx eb680a841d528a5862daf5fa0ac2596bf18ca25d |
View Raw JSON Data
{
  "block": 86285354,
  "op": [
    "comment",
    {
      "author": "barrylee",
      "body": "@@ -1,8 +1,817 @@\n+Global Acoustic Emission (AE) Equipment Market: Segment Analysis%0A%0AThe research report includes specific segments by region (country), by manufacturers, by Type and by Application. Each type provides information about the production during the forecast period of 2023 to 2032. by Application segment also provides consumption during the forecast period of 2023 to 2032. Understanding the segments helps in identifying the importance of different factors that aid the market growth.%0A%0AAcoustic Emission (AE) Equipment Market Segmentation By Type:%0A%0ATesting Equipment%0AData Acquisition Equipment%0AAnalysis Equipment%0AOthers%0A%0AAcoustic Emission (AE) Equipment Market Segmentation By Application:%0A%0AMISTRAS Group%0AQingcheng Ltd.%0AVallen Systeme%0AEmerson%0AQawrums Ltd%0AHexagon Digital Wave%0APhysical Acoustics%0AKitiwake Holroyd%0A%0A\n What Is \n@@ -1681,53 +1681,8 @@\n e.%0A%0A\n-acoustic-emission-testing-nasa%0A%0ACredit: NASA%0A\n %0APri\n",
      "json_metadata": "{\"app\":\"steemit/0.2\",\"format\":\"markdown\"}",
      "parent_author": "",
      "parent_permlink": "acousticemission",
      "permlink": "acoustic-emission-testing-an-in-depth-guide-new-for-2024",
      "title": "Acoustic Emission Testing: An In-Depth Guide [New for 2024]"
    }
  ],
  "op_in_trx": 0,
  "timestamp": "2024-06-25T10:12:51",
  "trx_id": "eb680a841d528a5862daf5fa0ac2596bf18ca25d",
  "trx_in_block": 9,
  "virtual_op": 0
}Manabar
Voting Power100.00%
Downvote Power100.00%
Resource Credits100.00%
Reputation Progress48.85%
{
  "voting_manabar": {
    "current_mana": "5585256183",
    "last_update_time": 1745150373
  },
  "downvote_manabar": {
    "current_mana": 1396314045,
    "last_update_time": 1745150373
  },
  "rc_account": {
    "account": "barrylee",
    "rc_manabar": {
      "current_mana": "22225891636",
      "last_update_time": 1745150373
    },
    "max_rc_creation_adjustment": {
      "amount": "5319301333",
      "precision": 6,
      "nai": "@@000000037"
    },
    "max_rc": "10904557516"
  }
}
Account Metadata
| POSTING JSON METADATA | |
| profile | {"profile_image":"https://cdn.steemitimages.com/DQmXbKk6eTxNNfPnudYCgKHmJvHCHmivAnaFDsAVDXsRjrU/jpg2.jpg","cover_image":"https://cdn.steemitimages.com/DQmXGbD3ofNYWjvzTdaFtHFwrfdoTVkk2yDYS33BT54Db2p/channels4_banner.jpg","name":"Qawrums Ltd","about":"QingCheng AE Institute (Guangzhou) Co., Ltd have been committed to acoustic emission detection and monitoring in NDT industry for more than 20 years.","location":"China","website":"https://www.aendt.com","version":2} |
| JSON METADATA | |
| None | |
{
  "posting_json_metadata": {
    "profile": {
      "profile_image": "https://cdn.steemitimages.com/DQmXbKk6eTxNNfPnudYCgKHmJvHCHmivAnaFDsAVDXsRjrU/jpg2.jpg",
      "cover_image": "https://cdn.steemitimages.com/DQmXGbD3ofNYWjvzTdaFtHFwrfdoTVkk2yDYS33BT54Db2p/channels4_banner.jpg",
      "name": "Qawrums Ltd",
      "about": "QingCheng AE Institute (Guangzhou) Co., Ltd have been committed to acoustic emission detection and monitoring in NDT industry for more than 20 years.",
      "location": "China",
      "website": "https://www.aendt.com",
      "version": 2
    }
  },
  "json_metadata": {}
}
Auth Keys
Owner
Single Signature
Public Keys
STM5WDJ5jVXuN27exTThXTh7S82MP7gxnPDW7Evi7u5243cz4hnNP1/1
Active
Single Signature
Public Keys
STM4vmtm6jDJUMt6666fFaGXVunQo6sUiwQDwVFKLLt1mJvvhiXKG1/1
Posting
Single Signature
Public Keys
STM5yCXao13ZwvxLBJyKWakfjp9FW543oe3DFf4qnKxTk99VB4xam1/1
Memo
STM6mwnLrgnmBBV8y1eZKyR4Gm1L9Zd2KCzTmU2YPMx2rixGZWXGU
{
  "owner": {
    "weight_threshold": 1,
    "account_auths": [],
    "key_auths": [
      [
        "STM5WDJ5jVXuN27exTThXTh7S82MP7gxnPDW7Evi7u5243cz4hnNP",
        1
      ]
    ]
  },
  "active": {
    "weight_threshold": 1,
    "account_auths": [],
    "key_auths": [
      [
        "STM4vmtm6jDJUMt6666fFaGXVunQo6sUiwQDwVFKLLt1mJvvhiXKG",
        1
      ]
    ]
  },
  "posting": {
    "weight_threshold": 1,
    "account_auths": [],
    "key_auths": [
      [
        "STM5yCXao13ZwvxLBJyKWakfjp9FW543oe3DFf4qnKxTk99VB4xam",
        1
      ]
    ]
  },
  "memo": "STM6mwnLrgnmBBV8y1eZKyR4Gm1L9Zd2KCzTmU2YPMx2rixGZWXGU"
}
Witness Votes
0 / 30
No active witness votes.
[]